6
EQ2: Producer prices
To what extent have the CAP measures applicable to the dairy sector affected prices paid to producers, the payment system (links to quantity and/or quality) and price stability.
6.1
Interpretation and comprehension of the key terms of the EQ2
The three key issues in this EQ are the effect of CAP measures applicable to dairy on the producer price for milk (its level), on the payment system for milk and on the stability of producer prices.
The CAP measures that potentially affect price are (a) border measures, which support domestic market prices above world market levels, (b) the target milk price (abolished following Regulation (EC) 1787/2003) and intervention prices (progressively lowered during the period since 2003), (c) private storage aids (also progressively reduced or eliminated), (d) internal consumption aids, which stimulate domestic demand for certain dairy products (also subject to reduction over the period, abolished for butter and cream in 2009)) and (e) quotas on milk supply (deliveries and direct sales) from farms. The payment system is interpreted as comprising (a) the process whereby the price received by milk producers from purchasers (dairies) is established and (b) the factors that determine the level of price paid. IN an operational sense, the payment system is the link between the milk price paid to producers (which is an input cost for dairies) and the prices of processed products (determining the output revenue generated from milk processing by dairies). When price changes in product markets are fully passed back to milk producers (according to the share of milk in the value of the final product), backward price transmission is said to be perfect. The price transmission relationship is important in that it determines how effective policy measures applied to dairy product markets are for supporting the milk price, and yet price transmission itself lies outside the scope or control of any policy measure.
CAP measures that can stabilise milk prices in the EU are the intervention system (temporary withdrawal of products from the market) and the permanent disposal measures, export refunds and consumption aids. In each case, it is the timing of the use of the measure that is important for price stabilisation, with more supply being taken off the domestic market when prices are falling, and −in the case of intervention− being returned to the market when prices are rising. In theory, the objective of the intervention system was the stabilisation of within-year price and quantity movements caused by seasonality in yields and production systems (which is quite pronounced in some EU regions) or, less typically, to movements from one year to the next due to unusual meteorological variations. Stabilisation measures applied in product markets are effective in stabilising producer prices for milk only to the extent that corrections for instability in product prices are transmitted back up the chain to milk producers.
6.2
Methodology used for answering the EQ2
6.2.1
Level of producer prices
This question is decomposed into two aspects: the impact of CAP dairy policy measures on the absolute level of the producer milk price over time, and the extent to which these measures support the producer prices for milk within the EU above the prices prevailing on world markets.
The switch of some income support out of market price support into direct payments that occurred with the introduction of the dairy premium in 2004 and the phased reduction in the ‘floor’ prices for intervention products are expected to cause a reduction in market prices beginning in 2004 or soon afterwards, and a continuing downward trend for a few years after that. As long as world market prices remain reasonably stable, this should also be translated into a reduction in price support. However, it should be noted that changes the producer milk price and the price gap between the EU price and the equivalent world market price are affected by other factors apart from policies such as the performance of dairies in valorising milk products (e.g. producing high-value products), which in turn may be partially or fully translated into the producer price for milk.
A straightforward comparison of the levels and trends in milk price before and after 2004 is used to evaluate the impact of policy changes on milk prices. A more elaborate methodology is required to calculate the level and trend in price support relative to world market prices. Raw milk itself is not traded on world markets, and hence there is no directly observable world market price for milk. This is overcome by calculating a composite world market price for the milk content of the basic bulk products, butter and SMP. This calculation is performed for each Member State to produce a ‘world milk price equivalent’ (WMPE), which is interpreted as the price of the milk content of each Member State’s butter and SMP production if these products were remunerated at the world market prices for butter and SMP facing that particular Member State.
Specifically, the WMPE is based on the (FOB) prices world market prices facing Member State i, processing costs of butter and SMP, and the fat and protein content of Member State i’s milk production, as follows:
)
1
(
)
(
)
(
)
(
i prot SMP SMP i fat but but iFF
C
PC
P
FF
C
PC
P
WMPE
=
−
+
−
−
(1)where:
WMPE
i: equivalent world market milk price faced by Member State i butP
: FOB world market price of butter SMPP
: FOB world market price of SMP butPC
: processing costs butter SMPPC
: processing costs SMP fatC
: quantity of fat necessary to produce 1 kg of butter protC
: quantity of skimmed milk needed to produce 1 kg of SMP iFF
: fat percentage of raw milk produced in Member State I (Eurostat, see Table 2.17) The processing costs for butter and SMP are taken as €29.31/100 kg and €28.34/100 kg, respectively, and the quantities of fat to produce 1kg of butter and of skimmed milk to produce 1kg of SMP are taken as 0.8374(kg) and 11(kg), based on estimates of DG AGRI (2011) and of the Dutch Dairy Board (Produktschap Zuivel, 2011). The world market prices for the calculation are the Oceania FOB export price of butter (82% butterfat) and the non-fat dry milk (1.25% butterfat) (see Table 2.17).The milk price equivalent based on actual EU market prices for butter and SMP in each Member State (‘producer milk price equivalent’, or PMPE) is calculated using formula (1) after substituting EU Member States prices for butter and SMP (Tables 2.20 and 2.24 respectively). In addition, the (effective) intervention40 milk price equivalent (IMPE) is calculated following a formula similar to (1), but using ‘effective’ intervention prices for butter and SMP rather than market prices.
40 For butter, the effective intervention price is set at 90% of the official intervention price and is based on the effective quantity and quality of each product that qualified for intervention purchasing. For SMP, it equals the official intervention price in each period.
The difference between the PMPE in a given Member State and its WMPE then provides a measure of the price support (P-SUP) of EU policy to dairy farmers for that Member State. P-SUP will be an over- or under-estimate of the rate of price support depending on whether the price gap between domestic and world market prices for higher-valued products (e.g. cheese and WMP) is larger or smaller than that of the bulk products butter and SMP. However, if the prices of all these products move more or less in parallel, then changes in the P-SUP ratio should capture changes in total price support. Note that P-SUP is Member State-specific and year-specific (with time subscript left out for convenience). The formula, for the i-th Member State, is given as
i i i i
WMPE
WMPE
PMPE
SUP
P
−
=
(
−
)
. (2)If P-SUP is greater than zero, then the CAP measures provide positive support to the milk price. For example, if P-SUPi=0.25, then the CAP supports the price of the milk used for basic products of the i-th Member State at a level that is 25% above the equivalent world market price level, and when P-SUPi=0, then policies do not create any difference between the price of the milk used in the Member State for butter and SMP production and its equivalent price on world markets. Other factors, such as transport and handling costs from the location of measurement in the Member State to the nearest port for export or import could lead to a non-zero P-SUP ratio, even when the effective support provided by the policy is zero. This component is expected to be relatively minor, however, and constant over time, in which case changes in P-SUP over time can be interpreted as very largely due to changing policy impacts.
The approach assumes that the underlying behaviour of farmers and processors, processing costs, and yield coefficients, remain unchanged over time. Furthermore, it is assumed that the quantities and prices of higher-value dairy products move proportionately with those for basic prices, and that world market prices are not sensitive to changing policy impacts on EU dairy product markets.
6.2.2
Payment system
Since most of the EU dairy policy measures directly target the prices and/or markets of milk products rather than the producer price for milk, understanding the payment system is important for gaining insight into how prices are formed at the first link in the supply chain and, specifically, the degree of price transmission from product markets back to the market for raw milk. Information on this issue is based on three sources:
•
Information on the typical structure of the payment system (factual information) from the case studies (milk producer and dairy processor surveys);•
Information on whether, and if so how, the payment system was perceived to have changed due to policy changes from the case studies;•
Literature research on price transmission (often based on econometric analysis of time series of prices).Information about the payment system is often considered by the dairies to be sensitive information. Although some dairies report information on the general principles according to which they price the raw milk they collect, how the system actually works in practice cannot necessarily be inferred from these general principles.
6.2.3
Price volatility
The effects of the CAP measures on price stability are analysed by comparing volatility indicators for monthly prices. When comparing volatility between Member States, the producer milk price is used. However, when comparing volatility between the EU milk price and the world milk price, the comparison is between the PMPE and the monthly world market milk price equivalent (WMPE). This is because, as raw milk is hardly traded on the world market, there is no ‘world milk price’ as such.
No single indicator is universally used as a measure of volatility. Two approaches are offered here, in order to appeal to both a non-technical and technical readership:
•
non-technical analysis-measures such as the trend and ±10% band indicators (graphical analysis of variability), and•
technical measures, i.e. specific statistics measuring variability in price series.Variation from trend or price-band analysis: This non-technical method involves calculating a ±10% band around the trend line and counting the share of observations within and outside this band (Keane and O’Connor, 2009). The number of outlying observations since January 2004 is compared with the number during the period of similar duration up to December 2003. Note that a wider or narrower band width could be chosen. The appropriate width of the band outside which an observed price is considered an ‘extreme’ observation depends on the extent of variability of the series in the pre-2004 period. Statistical measures: we select two alternative statistics for measuring volatility: the coefficient of variation, and the annualised standard deviation.
Coefficient of variation: The standard deviation (SD) of a variable measures the extent to which the variable fluctuates around its mean. However, it is a poor measure of volatility between variables when they do not have a common mean. In these circumstances, one must standardise the SD in relation to its mean, and this produces the coefficient of variation (CV) for the variable. The CV expresses the SD as a percentage of the mean, and is calculated as follows:
100
×
=
x
SD
CV
, where SD is the standard deviation andx
is the mean.Annualised standard deviation: This statistic is commonly used to compute historic volatility (O’Connor and Keane, 2011). The annualised standard deviation (ASD) is the standard deviation of the logarithm of price multiplied by the square root of the number of measurement periods per year (which in this case is 12, as monthly data are used). Converting the prices to logarithmic form allows variability to be measured as a percentage of the (geometric) mean. This solves the problem of non-comparability noted above for the SD of price levels. The ASD is given as follows:
12
)
,...,
(
)
,...,
(
p
1p
n=
SD
p
1p
n×
ASD
(3)where
p
1,...,
p
n is a price series in logarithmic form, extending over n periods.To the extent that data availability allows, the volatility analysis is done at Member State level. When and where price information from key dairies is available, this information has also been used to do some cross validation and check on the calculations based on average producer price for milk at MS level. As regards the time horizon, the seven-year period before the Luxembourg Agreement 2003 and several shorter periods thereafter are considered and compared.
In addition to the analyses described above, this EQ reports information from the milk producers’ and the dairy processors’ survey regarding the impact of volatility. Milk producers were asked to assess how increased price volatility had affected their willingness to remain in dairying or their decision to leave. Processors were asked about the extent to which higher price volatility had led them to adjust their payment system and their contracts with other segments of the supply chain. The aim of these questions was to gain insight into the impacts of price volatility on dairy processors and dairy farms, on the extent to which they can cope with volatility, and their reactions to it.
6.3
Judgement criteria, indicators and information sources used for each
indicator
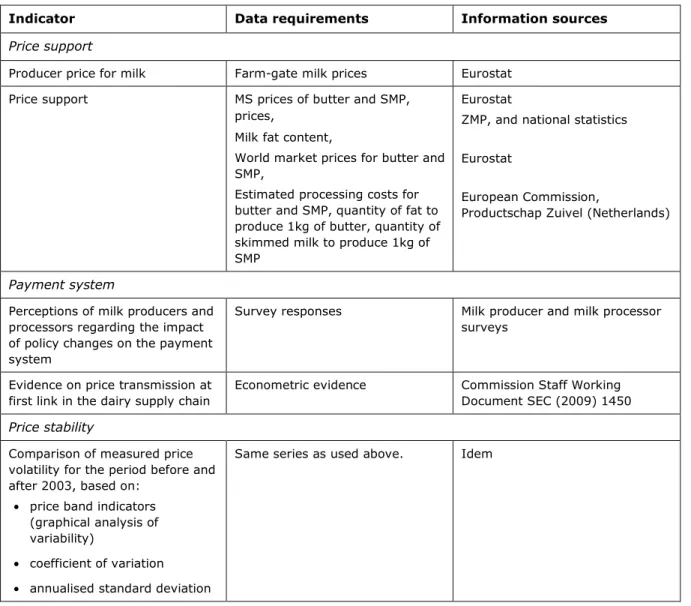
Table 6.1 lists the indicators used to address this evaluation question, their data requirements and the sources of these data.
Table 6.1 Indicators, data requirements and information sources for EQ2
Indicator Data requirements Information sources
Price support
Producer price for milk Farm-gate milk prices Eurostat Price support MS prices of butter and SMP,
prices,
Milk fat content,
World market prices for butter and SMP,
Estimated processing costs for butter and SMP, quantity of fat to produce 1kg of butter, quantity of skimmed milk to produce 1kg of SMP
Eurostat
ZMP, and national statistics Eurostat
European Commission,
Productschap Zuivel (Netherlands)
Payment system
Perceptions of milk producers and processors regarding the impact of policy changes on the payment system
Survey responses Milk producer and milk processor surveys
Evidence on price transmission at first link in the dairy supply chain
Econometric evidence Commission Staff Working Document SEC (2009) 1450 Price stability
Comparison of measured price volatility for the period before and after 2003, based on:
• price band indicators (graphical analysis of variability)
• coefficient of variation • annualised standard deviation
Same series as used above. Idem
The following judgement criteria are used:
•
the level and the trend in producer milk price are both examined and in each case compared for the periods before and after 2003. In particular, it is expected to find a decline in the milk price starting in 2004 when some income support was shifted about of market price support into the dairy premium. If this is found, it would indicate the expected impact of policy changes on price.•
the level and the trend (if any) in P-SUP (measured per year) are both measured and compared for the years before 2003 and during the period in which the 2003 reforms were applied. If the level remains more or less constant on average across the two periods, or if pre-2003 trend is maintained post-2003, then this implies that the changes in CAP measures have not affected the degree of underlying price support. Given the expectation that policy lowered the milk price from 2004 onwards, price support is also expected to be lower also, providing world market price conditions remain stable. However, if world market prices are also changing, then this affects the measured gap between domestic and world market equivalent milk price, and may mask the effect of lower price. If price support remains constant while domestic price falls, this would mean that world market prices were also falling.•
the payment system is not a direct policy target. However, policy changes may provide incentives for processors to adapt their payment systems. The survey evidence will be taken as decisive here providing it can be backed up by theoretical reasoning and other, related empirical evidence.•
the price volatility indicators will be used to reach a judgement on whether (a) observed volatility inthe milk price increased in the period, and sub-periods, after 2003 relative to the period before these changes, and how these differences were distributed among the Member States, and whether (b) the degree of stability of the EU internal milk price relative to the world market price decreased after the policy changes that are evaluated in this report. This is expected to be the case, since the 2003 and subsequent legislation, as well as market management decisions, implied less vigorous use of export subsidies and the scaling down or phasing out of internal stabilisation measures.
6.4
Impact of policy changes on milk price
6.4.1
Price trends
Figure 6.1 shows the pattern of the monthly producer price for milk in the EU-15 countries between January 1996 and December 2010. For most of the period, there is a marked seasonal pattern. However, it is clear that between 1996 and the beginning of 2005 (and with the exception of the two seasons 2001/2, and 2002/3), the seasonal fluctuation was between 29 and 33 cents per kg. Starting during 2004 and for the two seasons 2005/6 and 2006/7, however, this pattern shifted downwards, so that the (smaller) fluctuation was contained between (approximately) 28 and 31 cents per kg. This indicates the impact on price of shifting income support out of market price support and into the dairy premium, of the lower intervention prices for butter and SMP, and lower levels of disposal aids and export refunds. Nevertheless, for EU-15 as a whole, the fall in the average raw milk price is less than the fall in intervention prices. From mid-2007 onwards, the pattern in milk prices is completely masked by the strong price fluctuations that characterised agricultural commodity prices worldwide, including those for dairy products.
Figure 6.1 Monthly producer price for milk, EU-15, €/100kg, 1996(1)-2010(12)
25
27
29
31
33
35
37
39
41
43
1996-01 1997-01 1998-01 1999-01 2000-01 2001-01 2002-01 2003-01 2004-01 2005-01 2006-01 2007-01 2008-01 2009-01 2010-01 € /1 0 0 k g Source: Eurostat.The strong and atypical price volatility, which affected dairy markets worldwide between 2007 and 2009, over-rides the underlying downward shift in milk price after 2007. This is underlined by the sub-period
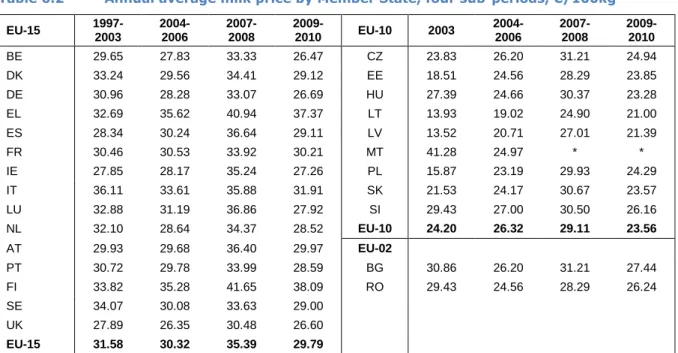
averages in Table 6.2. The average EU-15 raw milk price (€30.32/100kg) was more than €1/100kg lower in 2004-2005 than in 1997-2003, and rose to above €35/100kg in 2007-2008. After the high prices of 2007-2008, milk prices fell very steeply, beginning in late 2008 and reaching unusually low levels in mid-2009. In 2009, the average EU-15 raw milk price was under €27/100kg for the months of May, June, and July, whereas the average EU-27 price fell below €25/100kg in June and July.
Table 6.2 shows that there is considerable heterogeneity between Member States regarding raw milk price. A few EU-15 Member States have a higher average for 2004-2006 than in 1997-2003, although for the majority of them it is lower. Even during the market disruptions of 2007-2010, the same heterogeneity is observed. The steepest price falls (between the average for 2007-2008 and the average for 2009-2010) are observed in Luxembourg, Ireland, Spain, Hungary and Belgium, where the difference between the averages for the two periods is greater than €6.50/100kg. In 2009-2010, average raw milk prices fell back to a level lower than the average for 1997-2003, whilst for others it remained higher. In the Member States of EU-10, the change on accession is an upward shift for six of the countries shown, but a fall for three others (Cyprus is not included). However, they all experience a higher price in 2007-2008 but by less than the other EU Member States.
There is little evidence in Table 6.2 of convergence between milk prices in EU-15 Member States over the period. The range (between the lowest and highest MS price) is wider in 2009-2010 than in 1997-2003 in EU-15, but smaller in EU-10 (for the countries shown) than in 2003.
Table 6.2 Annual average milk price by Member State, four sub-periods, €/100kg
EU-15 1997-2003 2004-2006 2007-2008 2009-2010 EU-10 2003 2004-2006 2007-2008 2009-2010 BE 29.65 27.83 33.33 26.47 CZ 23.83 26.20 31.21 24.94 DK 33.24 29.56 34.41 29.12 EE 18.51 24.56 28.29 23.85 DE 30.96 28.28 33.07 26.69 HU 27.39 24.66 30.37 23.28 EL 32.69 35.62 40.94 37.37 LT 13.93 19.02 24.90 21.00 ES 28.34 30.24 36.64 29.11 LV 13.52 20.71 27.01 21.39 FR 30.46 30.53 33.92 30.21 MT 41.28 24.97 * * IE 27.85 28.17 35.24 27.26 PL 15.87 23.19 29.93 24.29 IT 36.11 33.61 35.88 31.91 SK 21.53 24.17 30.67 23.57 LU 32.88 31.19 36.86 27.92 SI 29.43 27.00 30.50 26.16 NL 32.10 28.64 34.37 28.52 EU-10 24.20 26.32 29.11 23.56 AT 29.93 29.68 36.40 29.97 EU-02 PT 30.72 29.78 33.99 28.59 BG 30.86 26.20 31.21 27.44 FI 33.82 35.28 41.65 38.09 RO 29.43 24.56 28.29 26.24 SE 34.07 30.08 33.63 29.00 UK 27.89 26.35 30.48 26.60 EU-15 31.58 30.32 35.39 29.79
Notes: * Average not shown because the series is incomplete. Source: Eurostat.
6.4.2
Price support (P-SUP): Levels and trends
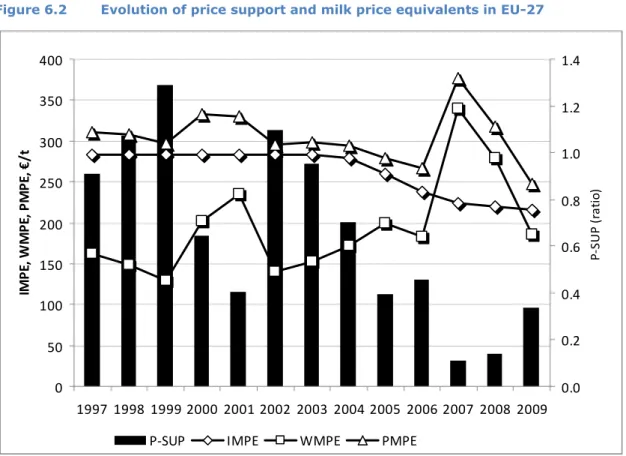
As the IMPE is determined by the effective EU intervention prices, the IMPE during the period 1997-2003 was quite steady at around €283/t milk (Figure 6.2). However, from 2004 onwards, the IMPE began to decline, and by 2009 it was about €216/t, 22% below the level of the pre-2004 period.
In the first sub-period, the producer milk price equivalent (PMPE) based on butter and SMP prices was 4-9% above the IMPE, depending on the year, except in 2001 and 2002 when it stood at 16-17% above the IMPE. From 2004 onwards, the relative difference between the PMPE and the IMPE became consistently greater, reaching 68% above the IMPE in 2007 but then falling to 44% in 2008 and 14% in 2009. This indicates that intervention prices were playing an increasingly minor role in setting the level for producer bulk product prices, and that market forces (and especially those that caused the price spike in 2008) were much more important.
From 1997-2003, there is a weak influence of world price on PMPE, but from 2003 to 2006 the effects of reform mask this influence. The IMPE (EU) was between 40% and 120 % higher than the WMPE (world) in the pre-2004 period; however, from a position of 62% higher in 2004, the IMPE fell relative to the WMPE, and in fact in 2007 and 2008, it was 34% and 21% lower than the WMPE, respectively. In 2009, it was just 17% higher.
The P-SUP ratio shows the net impact of these independent movements on the effective price support for milk used for bulk products within the EU above the world market equivalent price. Not surprisingly, there is considerable annual variation. However, it is noticeable that whereas this ratio exceeded 1 in two years during the 1997-2003 period, indicating that milk price was more than double world market equivalent price, from 2004 onwards this level was never again reached, and in the last five years, P-SUP was 50% or far less of the WMPE. In 2007 and 2008, P-SUP was very low and the internal EU milk price equivalent moved in parallel with the world market equivalent, as policy measures for managing internal prices were rendered ineffective by the negative price gap between IMPE and WMPE.
Figure 6.2 Evolution of price support and milk price equivalents in EU-27
0
50
100
150
200
250
300
350
400
1997 1998 1999 2000 2001 2002 2003 2004 2005 2006 2007 2008 2009
IM
P
E
,
W
M
P
E
,
P
M
P
E
,
€
/
t
0.0
0.2
0.4
0.6
0.8
1.0
1.2
1.4
P -S U P ( ra ti o )P-SUP
IMPE
WMPE
PMPE
Note: PMPE is the domestic price of milk as used for butter and SMP; IMPE is the intervention milk price equivalent; WMPE is the world milk price equivalent based on (FOB) world market prices for butter and SMP. Source: own calculations.
Table 6.3 EU and world market prices, EU price support, averages for sub-periods of
1997-2009 1997-2003 2004-2006 Change relative to 1997-2003 2007-2008 Change relative to 1997-2003 2009 Change relative to 1997-2003 €/t €/t % €/t % €/t % IMPE 283.24 258.59 -8.7 222.38 -21.5 216.15 -23.7 WMPE 167.29 184.93 10.5 309.02 84.7 184.89 10.5 PMPE 310.09 279.54 -9.9 347.41 12.0 247.31 -20.2 P-SUP 0.91 0.52 -43.0 0.13 -86.2 0.34 -62.9
There are sharp year-to-year movements in some of the statistics shown in Figure 6.2. The four sub-period averages shown in Table 6.3 smooth these fluctuations in order to summarise the general level of these different variables in the years before and after the reduction in intervention prices and the introduction of direct payments for milk. The summary shows clearly that in 2004-2006 policies provided a much lower floor price for milk via the intervention mechanism, and that producer milk prices (PMPE) on average fell by slightly more (-9.7%) in relative terms than the IMPE (-8.7%). During 2007-2008, the PMPE cut loose from the IMPE and rose to a higher average level than in 1997-2003. By 2009-2010, however, it had fallen –relative to its pre-2004 average– by nearly as much as the IMPE.
Table 6.4 shows the calculated P-SUP at Member State level. This ratio denotes the degree of support given to the price of milk for bulk products, as a fraction of the equivalent world market price of milk for bulk products. Although there are some marked differences between Member States and between years for the same Member State, which we do not attempt to explain here, it is clear that the pattern at EU level (namely, much lower effective price support from 2004 onwards) is repeated at Member State level. In fact, in 2008 the P-SUP ratio was negative for Ireland, the Netherlands and Slovakia.
Table 6.4 Price support indicator (P-SUP) for the EU-27
2001 2002 2003 2004 2005 2006 2007 2008 2009 Austria 0.49 1.13 0.95 0.70 0.44 Belgium 0.38 1.02 0.90 0.68 0.36 0.49 0.20 0.06 0.32 Denmark 0.53 1.35 1.18 0.91 0.58 0.63 0.15 0.29 0.43 Finland 0.36 0.96 0.83 0.61 0.34 France 0.35 0.98 0.86 0.66 0.36 0.46 0.19 0.00 0.26 Germany 0.42 1.04 0.91 0.68 0.37 0.50 0.22 0.05 0.24 Greece Ireland 0.23 0.92 0.80 0.57 0.27 0.34 0.08 -0.06 0.18 Italy Luxembourg Netherlands 0.37 1.03 0.90 0.68 0.35 0.48 0.19 -0.02 0.27 Portugal 0.72 Spain 0.39 1.02 0.77 0.62 0.36 Sweden 0.38 1.33 1.14 United Kingdom 0.53 1.12 0.93 0.73 0.42 0.44 0.12 0.11 0.22 Cyprus Czech Rep. 0.57 0.34 0.40 0.02 0.06 0.18 Estonia 0.47 0.24 Hungary 0.47 0.31 0.32 -0.15 0.17 0.17 Latvia 0.47 0.30 0.47 0.11 0.42 0.53 Lithuania 0.34 0.32 Malta Poland 0.42 0.26 0.38 0.07 -0.03 0.18 Slovakia 0.47 0.36 0.48 0.12 0.28 0.57 Slovenia 1.25 0.96 Bulgaria Romania EU-27 0.40 1.10 0.94 0.70 0.40 0.46 0.11 0.14 0.34
Notes: An empty cell means that not all data were available for performing the calculation. Source: own calculations.
6.5
Information on the payment system
There is no standardised payment system across the EU. The way milk price is determined differs from one Member State to another, and between the two main types of processing company (cooperatives and private companies). However, the underlying principles are more or less the same in all systems. There is a basic price, which depends on a standard fat and protein content. This price is then adjusted according to:
•
composition (actual fat and protein content),•
hygienic quality•
other quality criteria.Fat and protein content are the dominant criteria (hence the name ‘component pricing’), as they are decisive for the yield of the milk in terms of the processed product. However, other criteria that affect the value-adding process or contribute to cost savings for the dairy are also subject to special bonuses, including the milk’s freezing point, bacteria and somatic cell counts, seasonality, large-volume deliveries, guarantee to be from dairy cows grazing out of doors and organic production.
Thus, the payment system acts as a powerful set of incentives for producers, encouraging them to supply milk of the desired composition and quality, and at the times of the year that maximise the return to the milk when it is sold on by processors in the form of dairy products. Most of these criteria are cost- or consumer-oriented, and not directly affected by policy. An important exception is the return to fat and protein themselves, which will depend (a) on the extent that butter and skim milk powder prices are supported by export refunds and (b) the extent to which their price movements are smoothed by intervention buying and selling. Moreover, (c) the relative incentives to produce fat rather than protein will also be influenced by the management of export refunds and the extent of intervention for these two basic products relative to each other. The other incentive criteria for adjusting milk prices are more dependent on market signals and cost-reducing potential.
There are differences in the payment system between cooperatives and private dairies. The price paid by the latter is the result of contractual negotiations between the individual milk producer or producer organisation. It is difficult to obtain comprehensive empirical information on how much of the net value added of the milk is captured by the primary producer in these negotiations. It depends very much on the relative bargaining strengths of the two ‘sides’ of the market, and anecdotal evidence suggests that this varies from country to country, and between dairies in the same country. In fact, unequal bargaining power may be a very localised phenomenon, where one dairy is effectively the only downstream outlet for a geographically determined group of producers. By contrast, milk producers delivering to a cooperative have to be members of the cooperative, and the price paid depends on the economic success of the cooperative. In theory, all the cooperative’s net value added is paid out to members. However, cooperatives are obliged to collect all the milk offered by their members, whereas private dairies do not have this obligation and instead they collect milk on a negotiated basis. This allows private firms more flexibility as compared to cooperatives to adjust their milk intake as a function of their marketing opportunities. Without this flexibility, cooperatives face higher risks compared to private dairies. In addition, there is evidence in some countries that private companies are more innovative in product design and have a more market-oriented product mix, so it is by no means a foregone conclusion that cooperatives always pay higher milk prices than private companies.41
Market intervention is targeted to processed dairy products (butter and SMP) rather than to raw milk. However, the range of dairy products determining the remuneration of milk fat and milk protein is much wider than butter and SMP. The product mix usually also includes various high-value products (for example, PDO/PGI cheeses and fresh dairy products) and the composition of the product mix is likely to vary over Member States. The degree of self-sufficiency in the different derived dairy products and the shares of the products going to domestic and foreign or export markets also play a role in determining the level of the domestic prices.
41 This is confirmed by the annual International Milk Price Comparison (prices paid by individual milk processing entities) by LTO in the Netherlands.
None of the policy measures applied to the dairy sector target the bargaining process between milk producer and processor at this first link of the chain. So, although the measures already mentioned can influence the price of fat relative to protein, and even the absolute prices of these components that the dairies receive for them, these policy measures do not have any leverage over the share of these prices that is passed back to the milk producer. Moreover, less restrictive quota limits are thought to have weakened producers’ bargaining power.
Good price transmission from processors to milk producers is a necessary condition for the payment system to act an effective conduit for policy impacts to producers. Vertical price transmission involves passing price shocks along the chain from primary producer to wholesale to retail levels, and vice versa. The European Commission (2009b) analysed price transmission in several EU Member States (Austria, Denmark, France, Germany, and Slovenia) and for several dairy products (among which drinking milk, cheese, yogurts, butter). The study concluded that price transmission between producer and consumer prices is weak (with price transmission coefficients for most countries and products well below 1) and asymmetric (price rises more fully and more speedily passed forward down the chain than price falls, and the reverse for backward transmission). However, this evidence relates to transmission between the markets at each end of the chain, and does not necessarily hold for each link in the chain. There is some evidence that vertical transmission between dairy wholesale prices and producer milk prices may be more effective in some countries. For example, O’Connor (2006) found clear evidence of price transmission between the composite product price series and the farm gate price for milk. However, European Commission (2009b) reports that there has been a clear trend lately towards an increase in the level of gross margins at processing level for some dairy products in some countries (e.g. UHT milk and yogurt in France, and liquid milk and butter in Denmark). Milk prices are well documented, and retail dairy prices are also collected but less systematically. However, wholesale prices for dairy products are hard to observe and are not collected on a regular basis. This hampers the conduct of a rigorous statistical analysis of price transmission between intermediate stages in the chain.
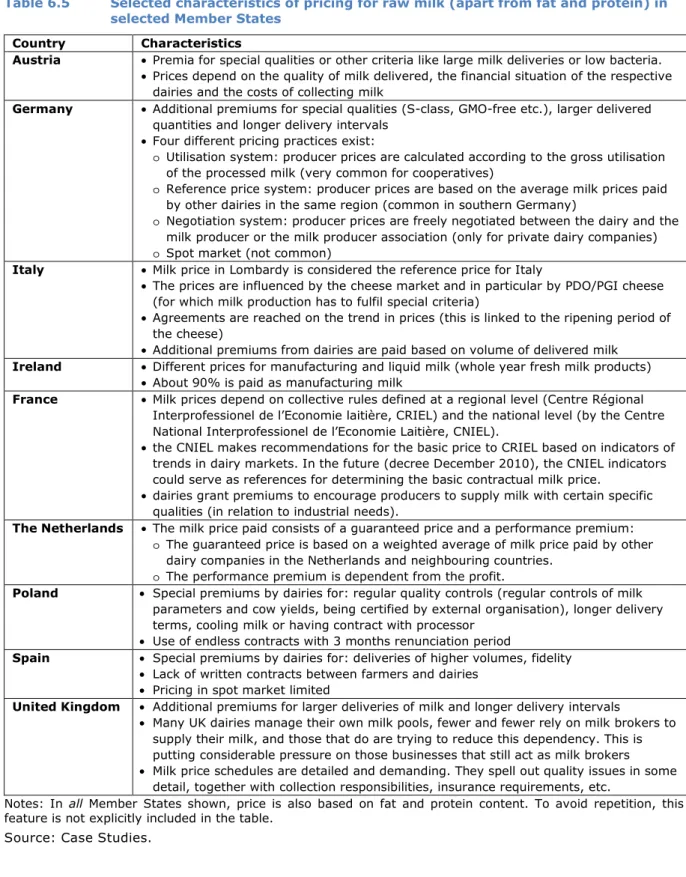
Table 6.5 summarises the main characteristics of the payment systems reported by the survey respondents in the selected Member States where case studies were conducted. In all case, the fat and protein components of the milk help to determine its price. This implies that, ceteris paribus, changes in the prices for fat and protein, which are implicit in the prices of derived dairy products such as butter (fat), SMP (protein), and cheese (fat and protein) should via the payment system induce changes in the price of raw milk. Moreover, as already stressed above, market measures targeting the prices of butter and SMP will potentially indirectly influence the milk price. As also stressed, the extent to which this occurs depends on the relative bargaining strengths of milk producers and milk processors.
The evaluation question asks whether CAP measures have influenced the payment system regarding links between price and the quantity of milk produced. The answer is negative. A preoccupation of CAP dairy policy has been the need to achieve market balance by limiting supply, yet the payment system in many countries rewards producers for larger deliveries because this reduces collection and testing costs. Incidentally, this premium, which is motivated by the aim of dairies to reduce costs, provides an incentive for structural change in the milk producing sector, which as explained earlier in the report, is a policy objective. Thus, there is a positive impact from a market-motivated feature of the payment system on a policy objective.
The evidence from the surveys on whether the changes in dairy policy since 2003 provoked changes in payment systems can be broken down into two parts. Milk processors were asked this question directly, and the answers were almost unanimously negative. The second type of evidence concerns whether the production decisions of milk producers are in fact influenced by the payment system. A few respondents said they were influenced by environmental or quality incentives, but there was no evidence that producers’ decisions were influenced by the elements of the price system that might theoretically (according to the discussion above) be responsive to policy changes. Thus, if policy changes have not had an impact on the payment system, and if in any case features of the payment system do not for the most part influence milk producers’ decisions, then there can be no causality via this link between policy changes and the performance of the milk-producing sector.
Table 6.5 Selected characteristics of pricing for raw milk (apart from fat and protein) in selected Member States
Country Characteristics
Austria • Premia for special qualities or other criteria like large milk deliveries or low bacteria. • Prices depend on the quality of milk delivered, the financial situation of the respective
dairies and the costs of collecting milk
Germany • Additional premiums for special qualities (S-class, GMO-free etc.), larger delivered quantities and longer delivery intervals
• Four different pricing practices exist:
o Utilisation system: producer prices are calculated according to the gross utilisation of the processed milk (very common for cooperatives)
o Reference price system: producer prices are based on the average milk prices paid
by other dairies in the same region (common in southern Germany)
o Negotiation system: producer prices are freely negotiated between the dairy and the
milk producer or the milk producer association (only for private dairy companies)
o Spot market (not common)
Italy • Milk price in Lombardy is considered the reference price for Italy
• The prices are influenced by the cheese market and in particular by PDO/PGI cheese (for which milk production has to fulfil special criteria)
• Agreements are reached on the trend in prices (this is linked to the ripening period of the cheese)
• Additional premiums from dairies are paid based on volume of delivered milk Ireland • Different prices for manufacturing and liquid milk (whole year fresh milk products)
• About 90% is paid as manufacturing milk
France • Milk prices depend on collective rules defined at a regional level (Centre Régional Interprofessionel de l’Economie laitière, CRIEL) and the national level (by the Centre National Interprofessionel de l’Economie Laitière, CNIEL).
• the CNIEL makes recommendations for the basic price to CRIEL based on indicators of trends in dairy markets. In the future (decree December 2010), the CNIEL indicators could serve as references for determining the basic contractual milk price.
• dairies grant premiums to encourage producers to supply milk with certain specific qualities (in relation to industrial needs).
The Netherlands • The milk price paid consists of a guaranteed price and a performance premium:
o The guaranteed price is based on a weighted average of milk price paid by other
dairy companies in the Netherlands and neighbouring countries.
o The performance premium is dependent from the profit.
Poland • Special premiums by dairies for: regular quality controls (regular controls of milk parameters and cow yields, being certified by external organisation), longer delivery terms, cooling milk or having contract with processor
• Use of endless contracts with 3 months renunciation period
Spain • Special premiums by dairies for: deliveries of higher volumes, fidelity • Lack of written contracts between farmers and dairies
• Pricing in spot market limited
United Kingdom • Additional premiums for larger deliveries of milk and longer delivery intervals
• Many UK dairies manage their own milk pools, fewer and fewer rely on milk brokers to supply their milk, and those that do are trying to reduce this dependency. This is putting considerable pressure on those businesses that still act as milk brokers • Milk price schedules are detailed and demanding. They spell out quality issues in some
detail, together with collection responsibilities, insurance requirements, etc.
Notes: In all Member States shown, price is also based on fat and protein content. To avoid repetition, this feature is not explicitly included in the table.
Source: Case Studies.
6.6
Price volatility
The questions addressed in this section are (a) whether observed volatility in the milk price increased in the period after 2003 relative to the period before these changes, and how these differences were distributed among the Member States, and (b) whether the degree of stability of the EU internal milk price relative to the world market price decreased after the policy changes that are evaluated in this report.
First, several different indicators are used to assess what happened to price stability in the evaluation period, which starts at 2003, as compared to a period of similar length before 2003.
6.6.1
Statistical analysis
First, we illustrate the price-band methodology, taking Germany as an example. This methodology is then applied to all Member States in order to compare the pre- and post-2003 periods. For monthly German data on the producer price for milk, the underlying trend is presented and a price band of ±10% relative to this trend evolution is drawn. The number of times price falls outside this band, relative to the total number of observations, is an indicator of the extent of ‘extreme’ price variation.
Figure 6.3 Price-band analysis for Germany
20
25
30
35
40
45
1
9
9
7
m
0
1
1
9
9
7
m
1
2
1
9
9
8
m
1
1
1
9
9
9
m
1
0
2
0
0
0
m
0
9
2
0
0
1
m
0
8
2
0
0
2
m
0
7
2
0
0
3
m
0
6
2
0
0
4
m
0
5
2
0
0
5
m
0
4
2
0
0
6
m
0
3
2
0
0
7
m
0
2
2
0
0
8
m
0
1
2
0
0
8
m
1
2
2
0
0
9
m
1
1
2
0
1
0
m
1
0
m
ilk
p
ri
c
e
c
e
n
t/
lit
re
de
Trend
Plus 10%
Minus 10%
Source: own calculations.Figure 6.4 Results of price-band analysis by sub period for all Member States
0 10 20 30 40 50 60 be cz dk de ee el es fr ie it cy lv lt lu hu nl at pl pt si sk fi se uk n u m b e r o f o b s e rv a ti o n s o u ts id e t h e p ri c e b a n d 97-03 04-10
Notes: 1) The width of the price-band around trend is ± 10%.
2) Data for EU-10 are available only for the second period. For Denmark, Greece and Spain, data were available for the first period but there were no values outside the bands, indicating price stability within the ±10% bounds in these countries in the earlier period.
3) Nominal prices are used (where necessary, conversion to euros used the contemporaneous exchange rate). Source: own calculations.
Figure 6.3 shows the estimated trend line for Germany for 1997-2010 (central solid line). The higher (dotted) line shows the long-run trend value plus 10%, and the lower (broken) line gives the long-run trend value minus 10%. There are 9 observations outside the ±10% band between 1997-2003, and 36 observations outside between 2004-2010, clearly illustrating a major increase in producer price volatility in Germany between the two sub-periods.
The results of applying this analysis to all Member States are presented in Figure 6.4. It is apparent that there has been wide variation between countries in terms of change in volatility between the two periods. A large majority of countries showed very substantial increases in volatility, e.g. Germany, Netherlands, Sweden; however, there were also exceptions, in particular, Belgium, Finland, Italy and the UK.
6.6.2
Coefficient of variation (CV) for producer milk prices
Figure 6.5 reports the coefficients of variation of monthly producer prices for milk at Member State level for four sub-periods.
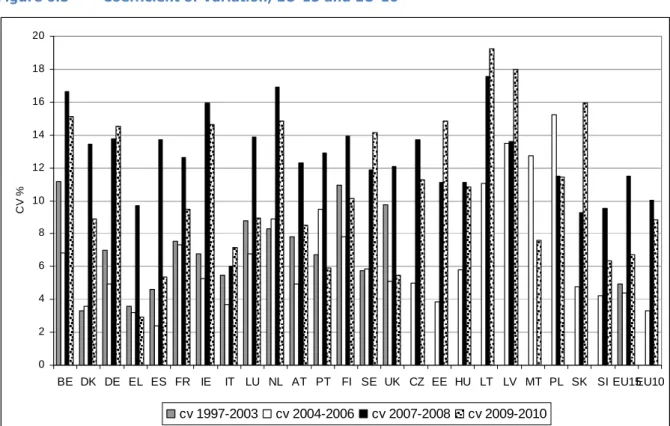
Figure 6.5 Coefficient of Variation, EU-15 and EU-10
0 2 4 6 8 10 12 14 16 18 20 BE DK DE EL ES FR IE IT LU NL AT PT FI SE UK CZ EE HU LT LV MT PL SK SI EU15EU10 C V % cv 1997-2003 cv 2004-2006 cv 2007-2008 cv 2009-2010
Source: own calculations.
For all EU-15 Member States except Sweden, the coefficient of variation is highest in the period 2007-2008. In Italy, volatility as measured by the CV is only 10% higher in 2007-2008 than in the period 1997-2003. By contrast, it is more than 4 times as high in Denmark. For the EU-15 average price, the CV is 130% higher in 2007-2008 than in 1997-2003, and 10% lower in 2004-2006. Eleven of the EU-15 Member States had lower volatility in 2004-2006 than in the previous seven-year period.
The pattern in the Member States of EU-10 is a little different, with four Member States having volatility as high or higher in the 2009-2010 period, than in the previous period. The coefficients of variation for Poland, Latvia and Lithuania are among the highest for one of the sub-periods after the reform, along with those for Belgium, Ireland and the Netherlands.
6.6.3
Annualised Standard Deviation
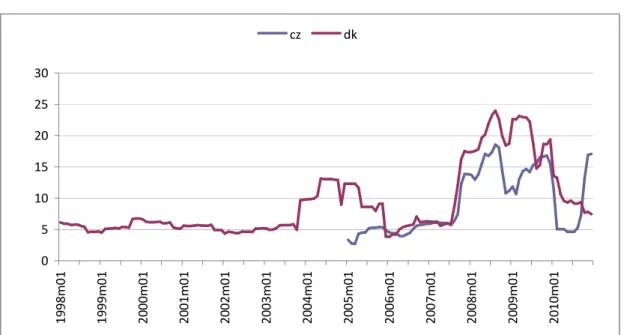
Figure 6.6 illustrates the annualised standard deviation methodology by applying it to price data for Denmark and the Czech Republic. These two Member States are chosen as typical examples. The
absence of data for the earlier period explains the truncated nature of the Czech series. There is clearly greater volatility in the later part of the second sub-period, although for Denmark an episode of less extreme volatility also occurs during 2004.
Figure 6.6 Annualised Standard Deviation (Denmark and Czech Republic)
0 5 10 15 20 25 30 1 9 9 8 m 0 1 1 9 9 9 m 0 1 2 0 0 0 m 0 1 2 0 0 1 m 0 1 2 0 0 2 m 0 1 2 0 0 3 m 0 1 2 0 0 4 m 0 1 2 0 0 5 m 0 1 2 0 0 6 m 0 1 2 0 0 7 m 0 1 2 0 0 8 m 0 1 2 0 0 9 m 0 1 2 0 1 0 m 0 1 cz dk
Source: own calculations.
Table 6.6 Mean Annualised Standard Deviation, countries of EU-25
1998-2004 2005-2010 % change Belgium 19.9 14.3 -28.2 Czech Republic 9.2 Denmark 6.4 12.4 93.9 Germany 10.1 12.1 20.2 Estonia 9.5 Greece 3.8 6.8 78.2 Spain 4.7 7.5 61.7 France 15.4 20.8 35.5 Ireland 12.9 17.1 32.5 Italy 3.1 6.3 105.3 Cyprus 7.8 Latvia 13.6 Lithuania 18.9 Luxembourg 17.1 14.3 -16.2 Hungary 15.2 Netherlands 17.1 29.1 70.6 Austria 8.8 11.8 33.6 Poland 12.4 Portugal 6.9 12.1 76.7 Slovenia 7.1 Slovakia 13.2 Finland 19.2 17.5 -8.8 Sweden 9.5 13.7 43.5 United Kingdom 19.2 15.1 -21.2
Source: own calculations.
Table 6.6 summarises the mean ASD in the two sub-periods for all Member States of EU-25. These results confirm that, for the Member States where the comparison can be made, prices in the second period have generally become more volatile over time, with four exceptions: Belgium, Finland, Luxembourg and the UK. Whereas the indicators detect increased price volatility, they do not identify the cause. An important issue is the relationship between the milk price volatility observed within the EU,
and the price volatility on global dairy markets in the same period. It raises the questions of whether EU dairy measures helped to hold domestic price volatility below that observed in world markets, and whether the relationship between volatility in the two markets shifted after 2003.
A comparison of the volatility in the WMPE and the PMPE between the two periods shows that the CV of the EU monthly price series increased by 404% in the second period, whereas that of the world market price equivalent increased by 126% (the ratio of the percentage changes is over 3:1). In the seven years before end-2003, the CV of the PMPE was only 31% that of the WMPE; however, after end-2003 it was 66% as high. When the average of the annualised standard deviations is compared between EU prices and world market equivalent prices, and between the two sub-periods, results of a similar order of magnitude are found: the mean ASD of the EU monthly price series increased by 202% between the two sub-periods, whereas that of the world market price equivalent increased by 42% (ratio of nearly 5:1). In the seven years before the start of the evaluation period, the CV of the PMPE was only 34% that of the WMPE; however, during the evaluation period, it was 76% as high.
The following conclusions can be drawn from these findings:
•
Milk price volatility increased in both markets between the two periods, but the increase was much greater within the EU than on the world market.•
Milk price volatility was nevertheless still less within the EU than that on the world market in the second sub-period.•
Given the two previous findings, the source of the milk price volatility observed within the EU during the evaluation period was clearly external (deriving from world market disturbances) but CAP policies after 2003 provided EU markets with less protection from these disruptions than was previously available. As long as the IMPE is greater than the WMPE, world market price volatility can be smoothed by the operation of export refunds and the intervention system. When WMPE rises above the IMPE, these instruments can no longer function in the usual way, and the protection is lost. Thus, there is a discontinuity at the point where WMPE=IMPE. The lower the intervention price, and the more susceptible world market prices are to prices surges, then the more likely such conditions are to arise.If there is good price transmission between processor and producer prices, then one might expect this switch in the relationship between the domestic and world market prices for basic products to hold for the milk price also. This is investigated in Figure 6.7.
Figure 6.7 Volatility of the WMPE, PMPE and the EU-15 producer milk price, 1997-2010
0 5 10 15 20 25 30 35 40 45 1 9 9 8 m 0 1 1 9 9 9 m 0 1 2 0 0 0 m 0 1 2 0 0 1 m 0 1 2 0 0 2 m 0 1 2 0 0 3 m 0 1 2 0 0 4 m 0 1 2 0 0 5 m 0 1 2 0 0 6 m 0 1 2 0 0 7 m 0 1 2 0 0 8 m 0 1 2 0 0 9 m 0 1 2 0 1 0 m 0 1 A S D
PMPE WMPE EU producer milk price Source: own calculations.
The annualised standard deviations of the PMPE, the WMPE and the monthly milk price received by producers in EU-15 are depicted. The latter price series was used because a monthly milk producer price series for EU-25 is available only from January 2003 onwards. It should be recalled that the WMPE and PMPE are based on the prices of butter and skim milk powder only, whereas the price received by producers for raw milk depends on the value of milk in all uses, to the extent that this is transmitted back up the chain to milk producers from the downstream segments.
This figure shows that for most of the period up to 2007, volatility in the producer milk price was higher than that of the PMPE, suggesting that only part of the stabilising effect of EU policies on the prices of intervention products was reflected in the producer milk price. Indeed, for most of the period from mid-2005 to end-2006, the volatility in the EU producer milk price is comparable to that of the WMPE. For most of the period after 2007, volatility in the producer milk price is significantly higher than in the previous period, but much less than that based on the milk price equivalents (EU and world market) for just butter and SMP. The period of about 12 months when the EU PMPE shows more volatility than the WMPE coincides with the period when world market prices exceeded EU intervention prices. making export refunds irrelevant. This is also the period of maximum volatility in the producer price for milk. In summary, the potentially lower protection against externally-generated volatility is due principally to the lower safety net provided by the intervention system. From 2004 onwards, the intervention prices for butter and SMP were gradually reduced by 25% and 15% respectively, and the ceiling for butter intervention was reduced from 70 thousand tonnes in 2004 to 30 thousand tonnes in 2008 and onwards (the ceiling for SMP remains unchanged at 109 thousand tonnes). In order to stabilise the milk price at the safety net level as implied by the effective intervention prices for butter and SMP, the Commission undertook special complementary measures, including an extension of the period and maximum duration for private storage aid for butter, an extension of the intervention period beyond the normal August closing date, and buying-in under tender (at prices close to the fixed buying-in price) of significant quantities in excess of the fixed-price ceiling.42
The public intervention mechanism has trigger prices that act as a threshold below which intervention purchasing can begin. This mechanism establishes a minimum price floor in the market. However, the instrument primarily protects against downward price volatility, not against upward price swings. When stocks have been accumulated in the past, the release of stocks can help to dampen price increases of dairy products, but this option ceases once stock holdings are exhausted. Therefore, a lower trigger price and a smaller ‘buffer’ intervention stock holding also reduces the possibility of smoothing sudden upward price movements. The down-scaling of private storage aids also weakened another potential mechanism for promoting stability that may have had a non-negligible consequence in a few Member States.
6.7
Conclusions
Prices paid to producers•
The shift of some income support out of price support (by reducing intervention prices beginning in 2004) and into a direct payment, produced a downward shift in the producer milk price for milk up to the start of 2007. However, during 2007-2008, a continuation of this impact was masked by the high prices transmitted to the EU milk market from the world commodity price boom.•
The average intervention milk price equivalent fell from about €283/t during 1997-2003 to approximately €256/t (-9%) in 2004-2006 and to €216.15/t by 2009 (-23.7% relative to 1997-2003). Thus, the greater reliance on direct payments and the reduction of the public intervention price to a lower safety net level meant a substantially lower support level for milk prices.•
The milk price equivalent for butter and SMP followed the IMPE downwards during 2004-2006, but became detached from it during the price boom of 2007-2008. During these years, it was42 An extra 13 thousand tonnes of butter were taken into private storage during the extended time period, whereas intervention buying-in of butter and SMP effectively stopped in early September and early October, despite the extended open period for intervention. However, during the preceding regular intervention period, an additional 53.222 thousand tonnes of butter was bought into intervention beyond the 30-thousand-tonne fixed-price ceiling, and an additional 178.587 thousand tonnes of SMP was bought in beyond the 109-thousand-tonne fixed-price ceiling. The total quantities of butter and SMP bought into intervention during 2009 represent 4.5% and 27.4%, respectively, of their 2009 production.
determined entirely by market forces and was on average 12% above its value in 1997-2003. During 2009 the milk price equivalent for butter and SMP again reached the intervention milk price equivalent.
•
Prices for butter and SMP were on average supported 90% above world market price levels during 1997-2003, and around 50% above in 2004-2006. In 2007 and 2008, as a result of very high world market and EU prices, the internal price support offered by EU policies was very low, but at the same time, EU milk producers received record high prices. In these extreme conditions, the EU dairy market showed a high degree of integration with the world market, unprecedented since the start of the CAP. In 2009, EU butter and SMP prices were supported at a level about one-third higher than the world market price.In conclusion, the changes to the market intervention measures (abolition of the target milk price, lower intervention prices and ceilings, scaling down or elimination of private storage aids and internal disposal aids, and relaxation of quota ceilings) enshrined in the 2003 reform or subsequent modifications increased the convergence of internal and world market prices. When world market prices rose above the internal supported price levels in 2007-8, EU market prices followed world market prices closely and the two markets were quite strongly integrated.
Payment System
•
The case study surveys show that the changes in CAP dairy measures did not influence the method for calculating payments to milk producers. Processor respondents claimed that the payment system is more or less independent of policy changes, and milk producers reported that their production decisions are not affected by those particular features of the payment system that might depend on policy changes. It is concluded that the policy changes under evaluation did not affect the performance of the milk producing sector via an impact on the payment system.Price stability
•
Volatility increased in both the EU milk price and the world market milk price equivalent after 2003 relative to the preceding period, but the increase was much greater within the EU than on the world market. Nonetheless, milk price volatility within the EU was still less than that of the world market equivalent price, even during the world market commodity boom of 2007-8. The experience of milk price volatility in individual Member States varies considerably. Among the reasons for this are differences in the product portfolios of Member States (consumer products versus basic commodities with related differences in price variations), different fat and protein production patterns and the valuations of these components between countries, heterogeneous milk payments systems, exchange rate movements (between Members States within and outside the euro zone) and different milk price setting strategies used by dairies and related organisations in different countries.•
Raw milk prices reached very high levels in 2007-2008, but fell sharply in 2009. Average milk pricesin 2009-2010 relative to 2007-2008 were about 16% lower for EU-15 and 19% lower for EU-10.
•
During 2003-2007, CAP measures (export refunds and intervention) provided greater protectionagainst world market price instability to the price of milk destined for butter and SMP than was afforded to the producer price for milk averaged over all uses. The source of the milk price volatility observed within the EU during 2007-9 was external (deriving from world market disturbances and not internally generated). During the period of high world market prices (2007-2008), although volatility in the EU producer price for milk was considerably higher than at any time since 1997, it was less volatile than the EU milk price equivalent based on the prices of butter and SMP. More details on this issue can be found in the analysis relating to evaluation question 5.
•
During 2009, following the 2007-8 price spike, the monthly producer price for milk fell very rapidly to a level (in nominal terms) that was at least €1.50/100kg lower than any price observed since 1996. In 2009, the intervention system was complemented by additional measures with the intention of providing a safety net for producers. However, although the EU milk price was successfully stabilised at a considerably higher level than the world milk price equivalent of butter and SMP, the need for adjustments and complementary measures suggest that the normal safety-net system may not always provide a fully effective reaction to extreme events. Furthermore, given the parallelincrease in production costs, the sharp decline in milk price placed considerable pressure on producers’ margins. This episode showed that setting the parameters of the intervention system (trigger and buying-in prices, quantity ceilings) for the longer term in a multi-annual perspective makes it less responsive to unforeseen short-term ‘crises’ where a more effective safety net might be expected.
In conclusion, the policy measures that have been used in the past to stabilise internal milk prices (public intervention and export refunds) were unable to perform this role during the demand-led commodity price boom of 2007-2008 and the price slump that followed in 2009. Their inability to perform this role has two aspects: as the price gap between internal and world market prices becomes narrower, the probability that a price surge on the world market will cause world market prices to rise above internal intervention price levels increases. As long as world market prices are above intervention price levels, both intervention and flexible export refunds – which essentially are designed to provide a minimum safety net price – are ineffective for dampening a price boom, and were not designed to perform this role The second aspect is that, with the intervention system reduced to a lower ‘safety net’ level, a larger internal price fall is needed than in the past before this stabilisation measure is triggered. Moreover, with lower intervention ceilings, the effectiveness of intervention as a stabilising measure is more limited when it has been triggered.
Summary of findings for each indicator, EQ2
Indicator Expected result Evidence found
Price support
Producer price for milk A fall, starting in 2004 and continuing until 2006-7, was expected.
The expected changes were found for the milk price equivalent based on intervention prices, and for the actual milk price equivalent based on the prices producers received for butter and SMP. For 2007-8, the latter increased again due to the dominance of world prices.
Price support Price support was expected to fall with the same timing as the fall in the producer price for milk, but less clear-cut/more erratic, because price support also depends on world market prices.
Price support fell after 2003, and by more than the fall in internal prices because world market prices were also rising. Thus, the price gap was squeezed from both sides.
Payment system Milk producers’ and processors’ perceptions of the impact of policy changes on the payment system
Evidence was sought without any a priori expectation of what might be found.
No change was perceived or signalled by market participants.
Evidence on price
transmission at first link in the dairy supply chain
There was no a priori expectation about whether/how the degree of price transmission might change as a response to the policy changes.
The evidence on price transmission is not unanimous (it depends on the period studied, the product, and the Member State). However, available evidence shows transmission tends to be weak at the first link in the chain. Table continues on the next page
Price stability
Comparison of measured price volatility for the period before and after 2003, based on:
• price band indicators (graphical analysis of variability)
• coefficient of variation • annualised standard
deviation
It was expected that price volatility on domestic markets would increase because of the greater scope after 2003 for market orientation and the weakening of the intervention system.
Contrary to expectations, volatility in the EU prices for butter and SMP fell during 2003-2006, whereas volatility of the milk price reflecting all uses of raw milk remained constant up to end-2006. However, when world market prices for butter and SMP rose above internal intervention prices (an exogenous development that was not expected ex ante), internal prices became more volatile, with the volatility in EU prices for butter and SMP matching that of the world market prices. CAP stabilisation measures became inoperational.