On Scalable Data Mining Techniques for Earth Science
Markus G¨
otz
1,2, Matthias Richerzhagen
1, Christian Bodenstein
1,2, Gabriele
Cavallaro
2, Philipp Glock
1, Morris Riedel
1,2, and J´
on Atli Benediktsson
2 1 J¨ulich Supercomputing Center (JSC), Forschungszentrum J¨ulich, J¨ulich, Germany {m.goetz, m.richerzhagen, c.bodenstein, p.glock, m.riedel}@fz-juelich.de2 School of Engineering and Natural Sciences, University of Iceland, Reykjavik, Iceland {cavallaro, benedikt}@hi.is
Abstract
One of the observations made in earth data science is the massive increase of data volume (e.g, higher resolution measurements) and dimensionality (e.g. hyper-spectral bands). Traditional data mining tools (Matlab, R, etc.) are becoming redundant in the analysis of these datasets, as they are unable to process or even load the data. Parallel and scalable techniques, though, bear the potential to overcome these limitations. In this contribution we therefore evaluate said techniques in a High Performance Computing (HPC) environment on the basis of two earth science case studies: (a) Density-based Spatial Clustering of Applications with Noise (DBSCAN) for automated outlier detection and noise reduction in a 3D point cloud and (b) land cover type classification using class Support Vector Machines (SVMs) in multi-spectral satellite images. The paper compares implementations of the algorithms in traditional data mining tools with HPC realizations and’big data’ technology stacks. Our analysis reveals that a wide variety of them are not yet suited to deal with the coming challenges of data mining tasks in earth sciences.
Keywords: Data Mining, Machine Learning, HPC, DBSCAN, SVM, MPI
1
Introduction
The enormous increase in variety, velocity, and volume of spatio-temporal earth science datasets raises data management concerns for organizations storing and preserving the data. There are a number of concrete examples in view of earth science data repositories. One of them is the PANGAEA earth science data collection [7] that has reached, at the time of writing, approx-imately nine billion data items within around 350,000 datasets. These consist of increasingly large and complex data which often represent long lasting time series of measurement devices from a multitude of different sensors. Another example are the large data collection of remote sensing images [2], taken by airborne sensors or satellites observing, measuring, and recording the radiation reflected or emitted by the Earth and its environment. The’big data’ challenges in this case concern the improvements of remote sensing capabilities and the availability of
Volume 51, 2015, Pages 2188–2197
ICCS 2015 International Conference On Computational Science
2188 Selection and peer-review under responsibility of the Scientific Programme Committee of ICCS 2015 c
remotely sensed images with high geometrical resolution (e.g. WorldView-2 0.5m) or more de-tailed spectral information in terms of precision, frequency, or complexity (e.g. AVIRIS 224 spectral channels).
Researchers, however, do not only face issues with the management of the data, but also when attempting to analyze, interpret, or understand them. Due to their’big data’ properties, they are difficult to process, making it a problem worth investigating. One of the known quotes in that context is: ’Big data is data that becomes large enough that it cannot be processed using conventional methods [19]. While this definition seems vague, we would like to take the viewpoint in this contribution that these conventional methods span the wide variety of serial tools existing to analyze earth science datasets (e.g. R, Matlab, Weka, etc.). While trying to use some of the already mentioned databases, we have been unable to fully analyze or even just load them into these systems because of memory restriction or highly inefficient implementation.
Handling processing intensive, large datasets, though, is not an entirely new problem, es-pecially when considering computation environments driven by High Performance Computing (HPC). We would like to find out what benefits of these environments are applicable to the analysis of large quantities of earth science datasets. In the foreseeable future, and in order to better understand many of the climate issues we face today, we even require a systematic approach of combining and studying earth science datasets derived both from observations and model simulations often running in HPC environments. Therefore, this contribution aims to provide a deeper understanding about two concrete case studies that are able to take advan-tage of parallel and scalable data mining techniques of large quantities of earth science data. Throughout the paper, and as part of these studies, we provide pieces of information about strengths and weaknesses of various’big data’ technologies and comparing approaches to HPC environments and their strong capabilities that are also applicable to statistical earth science data mining tasks.
The first case study covers the known territory of finding outliers in data using clustering algorithms. While many different clustering algorithms are potentially applicable [16], we focus here on the Density-based Spatial Clustering of Applications with Noise [8] known as DBSCAN. One example of a relevant data source is a marine observatory (i.e. Koljoefjord observatory) that delivers continuous measurements over a long period of time. We study the use of DBSCAN in order to find out if we are able to detect events or outliers that can also support the data quality management. A scalable and robust automated outlier detection system that is able to cope with large volumes of data within PANGAEA is therefore required. During our study we were unable to find a suitable implementation of the algorithm allowing us to perform the described analysis. For this reason we had to develop our own scalable solution of a parallel DBSCAN delaying the actual analysis of the PANGAEA Koljoefjord observations. We will demonstrate the capabilities of the software on the basis of a simpler, but visually tangible, earth science outlier use case, the denoising of a 3D point cloud.
Our second case study deals with land cover mass classification in remote sensing image datasets. The classification problem aims to categorize all pixels in a digital image into mean-ingful classes of land cover types in a particular scene. In order to obtain a satisfactory level of detection accuracy, we perform a detailed physical analysis by exploiting the availability of high spatial resolution images. Hence, we consider attribute filters, flexible operators that can transform an image according to many different attributes (e.g. geometrical, textural, and spectral) as further optimization technique [3]. One often used classification technique in the field of remote sensing are Support Vector Machines (SVMs) [6] and their kernel methods (e.g. radial basis function). The contribution of this paper in the context of classification is the exploration of according SVM frameworks.
This paper is structured as follows. After the introduction into the problem domain in Section 1, key requirements for evaluating parallel and scalable tools for the analysis of scientific and engineering problems are given in Section 2. Section 3 offers a thorough survey of related work in the field of parallel and scalable data mining tools with a particular focus on parallel DBSCAN and SVM implementations. Section 4 highlights selected technical details on two parallel implementations we use to process the aforementioned earth science datasets. The paper ends with some concluding remarks.
2
Requirements
Technical and algorithmic solutions for the aforementioned case studies need to satisfy a number of key requirements listed in this section. Satisfying those requirements and overcoming scal-ability constraints given by the available datasets thus represent one of our major motivation. There is a wide variety of traditional tools available and an increasing number of more recent
’big data stacks’ that claim to support parallel and scalable data mining in one way or the other. We picked the following (without considering commercial tools) for our deeper analysis: (i) Weka, (ii) R, (iii) Matlab, (iv) Octave, (v) Apache Mahout, (vi) MLlib/Apache Spark, (vii) scikit-learn, and individual implementations for the specific algorithm in question. Those tools are analysed in terms of three different criteria’(a) open and free availablility’, ’(b) technical feasibility’, and’(c) suitability of algorithms’ in the light of the motivating case studies. Despite the fact that there is an ever increasing number of rather new’big data stacks’, our work is also motivated by exploring whether traditional HPC environments play a role in mining’big data’. Although the HPC environments are typically driven by demands of the ’simulation sciences’, based on efficient numerical methods and known physical laws, some computational science applications raise similar requirements to the processing environments as it is the case for data mining tasks. In this contribution we therefore focus on comparing solutions based on the following five key capabilities we consider important when analyzing technical solutions:
R1 Parallel file systems and large storage capacity
R2 Scalable standard data formats that take advantage of parallel I/O R3 Standard communication protocols
R4 Fair scheduling tools and policies to enable the work on clusters for several users at a time R5 Open source tools and open referencable data to enable reproducability of findings
3
Related Work
This section is structured along the key requirements and framework collection introduced in section 2.
3.1
Survey of DBSCAN Clustering Tools
Clustering is an established data mining method that can be best explained by dividing data into subgroups of similar items, whereby each member within such a found group is similar to all the others and different from the members of other groups. The similarity is defined by a problem-specific metric like for instance the euclidean distance between data items. Cluster
analysis belongs to the so-called unsupervised learning methods since the input data items Xi=< x1, . . . , xd >∈Rd with i= 1. . . N are given, but no desired results or ground truth to
be learned from1.
In this survey we focus driven by our outlier use case on the DBSCAN clustering algorithm. The literature offers several publications describing parallelization approaches, e.g. based on the map-reduce paradigm [12], using distribute dR-Trees [5], or more traditional variants in the context of databases [13]. However, except of one, none of these offer concrete implementations or point to respective source code repositories. We could therefore only include PDSDBSCAN-D [15] in our survey despite the list of frameworks introduced in the method section.
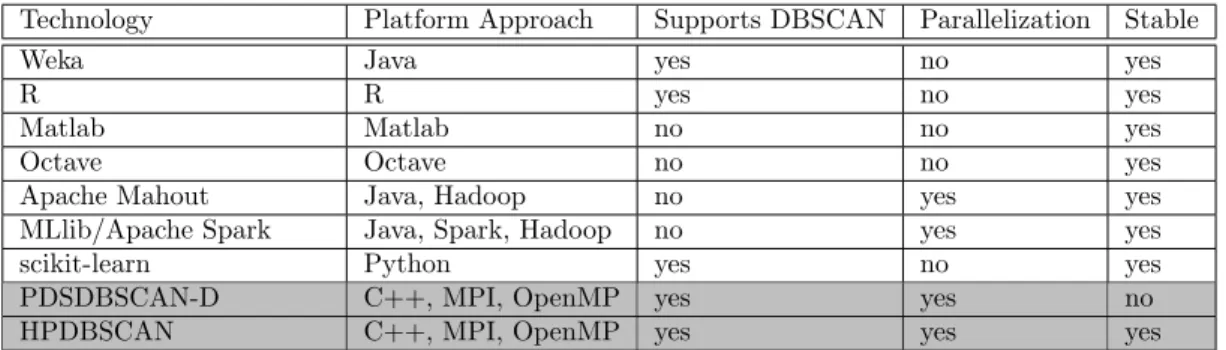
Technology Platform Approach Supports DBSCAN Parallelization Stable
Weka Java yes no yes
R R yes no yes
Matlab Matlab no no yes
Octave Octave no no yes
Apache Mahout Java, Hadoop no yes yes MLlib/Apache Spark Java, Spark, Hadoop no yes yes
scikit-learn Python yes no yes
PDSDBSCAN-D C++, MPI, OpenMP yes yes no HPDBSCAN C++, MPI, OpenMP yes yes yes
Table 1: Overview of open and freely available DBSCAN clustering tools
Table 1 shows the results of our survey. The new ’big data’ technology stacks Apache Mahout and Spark do not offer an implementation of DBSCAN to begin with. Interestingly enough the same is true for the well-known data mining tools Matlab and Octave that do not support this kind of analysis. In contrast to that Weka, R and scikit-learn have packages that allow to cluster data using DBSCAN. However, all of them are not parallelized and therefore do not have the ability to scale to modern HPC systems. Only the one remaining implementation satisfies the’(a) open and free availability’ criteria as well as the’(c) suitability of algorithms’
criteria – PDSDBSCAN-D. A deeper analysis of the C++ code based on MPI or OpenMP reveals drawbacks in terms of ’(b) technical feasibility’ in terms of scalability and speedup while performing tests with real world data [9]. In order to satisfy our demanding earth science outlier case study we have implemented a more efficient parallel version of DBSCAN that we named HPDBSCAN. Our approach differs from the PDSDBSCAN-D implementation in several ways such as a smart preprocessing into spatial cells as well as density-based chunking to load balance the local computation.
3.2
Survey of SVM Classification Tools
Classification is the problem of identifying the membership of data items into a set of subgroups called classes. In contrast to clustering, the statistical model for this is learned from known observations or samples of class memberships. Classification therefore belongs to the supervised learning methods since input data items Xi =< x1, . . . , xd >∈Rd with i = 1. . . N are given
in combination’with supervising output’ datayi. In our survey we focus on the support vector machine (SVM) classification algorithm, including its kernel methods allowing to classify non-linearly seperable data.
Technology Platform Approach Multiclass Supported Kernels Parallelization Stable
Weka Java yes linear, rbf, polynomial, sigmoid no yes
R (kernlab) R yes linear, rbf, polynomial, sigmoid no yes
Matlab Matlab yes linear, rbf, polynomial, sigmoid no yes
Octave Octave yes linear, rbf, polynomial, sigmoid no yes
Apache Mahout Java, Hadoop - - -
-MLlib/Apache Spark Java, Spark, Hadoop no linear yes yes
scikit-learn Python yes linear, rbf, polynomial, sigmoid no yes
libSVM C, Java yes linear, rbf, polynomial, sigmoid no yes
Twister/ParallelSVM Java, Twister, Hadoop no linear, rbf, polynomial, sigmoid yes no
pSVM C, MPI no linear, rbf, polynomial yes no
GPU LibSVM CUDA yes linear, rbf, polynomial, sigmoid yes (rbf) yes
πSVM C, MPI yes linear, rbf, polynomial, sigmoid yes yes
Table 2: Overview of open and freely available SVM classification tools
As shown in Table 2, there is a wide variety of candidate solutions tools available that vary in terms of their platform approach. In terms of’(c) suitability of algorithms’, we have found only four of the different implementations to be useful. The reasoning is as follows. Weka, R, Matlab, Octave and scikit-learn, as high-level languages also attractive to non technically savy scientists, wrap libSVM as a base implementation. Due to the lack of parallelization of the latter, however, it is not suitable for our earth science data mining problem. MLlib of Apache Spark seemingly overcomes this by reimplementing SVMs using the scalable and parallel Spark core, but a deeper analysis show that it only supports linear SVMs. Again, this is not applicable for our earth science data mining use case as we have non linearly separable classes. The remaining four satisfy basically the’(c) suitability of algorithms’ requirement, but a deeper analysis reveals further drawbacks in terms of (b) technical feasibility. The implementation of pSVM [20] as well as Twister [18] are unstable beta releases that are not meant to be used in production yet. While using Twister for example we found dependencies to messaging systems, scheduling issues, and other problems related to the lack of features that have made an analysis of our data challenging. Finally, there are only two parallel implementations left. The GPU LibSVM bears lots of potential for future use, but due to its dependencies to the proprietary Compute Unified Device Architecture [14] technology stack, we have concerns regarding our’(a) openly and free available’ criteria. For this reason, we have decided to testπSVM 1.2 (and indirectly the recentπSVM1.3) with our data. Overall the performance has been acceptable, but some scalability issues, have lead us to optimize it further, which we will present in section 4.2.
4
Parallel and Scalable Methods
This section gives insights about our parallel and scalable methods and their optimization structured alongside the approaches raised from the two scientific case studies introduced in Section 1. Beside technical details, we also discuss in this section the HPC environment benefits that satisfy the majority of our key requirements defined in Section 2 (i.e. R1-R5).
4.1
Parallel and Scalable Clustering with HPDBSCAN
DBSCANis a density-based clustering algorithm and its principal idea is to find cluster cores in a data set and subsequently expand these recursively. Thereby, a cluster core is defined as region that contains at least a parametric number minPoints of neighboring point within a given search radius epsilon (ε) and with respect to a distance function dist. For each of
these neighboring points the same criterion is reapplied in order to extend the found cluster. Highly parallelizableDBSCAN(HPDBSCAN) is our parallel implementation of DBSCAN. It overcomes the inherent sequential processing step of the recursive expansion through the following three major techniques.
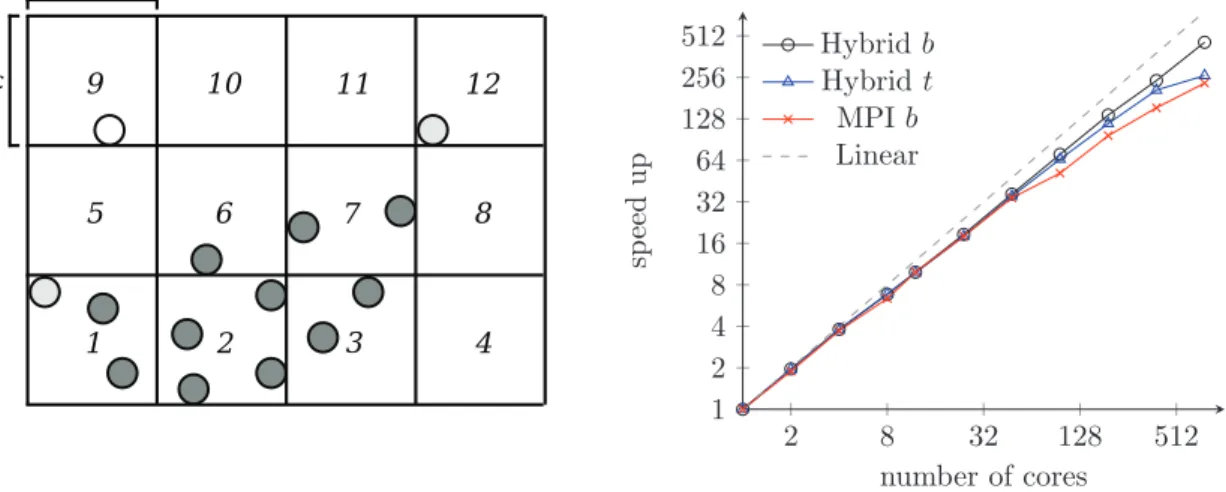
Spatial Indexing Structure Common techniques for indexing data points are dR- or kd-trees [17] as they have been used in other parallel DBSCAN research work. These significantly speeds up region queries, especially also for dynamic search radius. In DBSCAN, however, we have a constant search radius equaling to epsilon. Based on this fact, we have chosen a different spatial indexing approach forHPDBSCAN, which uses a sorted, regular n-dimensional hypergrid indexed by hash tables that overlays the n-dimensional data space (cf. Figure 1). Similarily to the’big data’array databases rasdaman or SciDB [1], we can answer queries based on this approach faster, in armortizedO(1) complexity and can cash and preload queries. Quadratic Split Heuristic Instead of distributing the data items in equal-sized chunks to all processor, like introduced in previous DBSCAN research works, we use a heuristic to achieve better load balancing, especially for spatially skewed data. Since the computation time of DBSCAN scales in a quadratic manner with respect to the point density, we calculate a score value for each cell of the hypergrid, which take advantage of this scaling behavior. The scores allows us to find exact splittings of the hypergrid, such that no communication is required during the parallel computation step. At the same time, we able to balance the workload evenly among processors.
Differential Merging Scheme HPDBSCANis able to combine the sub-results of the par-allel clustering into one common view. Therefore, it exchanges the direct bordering region halos of the hypergrid splits, finds deviating cluster labels, and rewrites them accordingly. In the merging step, we store conflicting labels in dictionaries, so that we can apply relabeling of points in parallel afterwards. In contrast, to other parallelDBSCANimplementations such as
PDSDBSCAN-D[15] there is no additional communication or clustering needed during the re-labeling, which increases the computational performance tremendously.
We have realizedHPDBSCAN as a MPI and OpenMP hybrid in C++ that is usable as a standalone command line interface (CLI) tool as well as a shared library that can be wrapped or linked to bigger applications if needed. In case of the CLI program, data points are provided in form of Hierarchical Data Format (HDF5) files [11], in which the clustering results are also written back. These clustering results per point are either the identity of a specific cluster or an outlier mark that in particular is useful for our earth science case study.
In order to demonstrate its scalability and its outlier detection potential with large volumes of data, we are filtering a 3D point cloud of the old town of Bremen for outliers, such as false readings or points which capture the inside of a building. The points cloud contains over 81 million individual points [10], clustering these sequentially would require days. Using
HPDBSCANand the supercomputer JUDGE at the research center Jlich, we can cut this time down to minutes. Figure 2 shows an example of the point cloud in a version that has been clustered usingHPDBSCANwith the noise points still in, but colored in red. These can be automatically removed, allowing us to start our next analysis steps. Our implementation takes advantage of (R1) parallel file systems and large storage capacity existing in many HPC environments. We a are able to fully exploit (R2) scalable standard data formats that take advantage of parallel/IO due to the adoption of HDF5. The code is us sing (R3) standard
1 2 3 4 5 6 7 8 9 10 11 12 2 8 32 128 512 1 2 4 8 16 32 64 128 256 512 number of cores sp eed up Hybridb Hybridt MPIb Linear
Figure 1: Left: Schematic illustration of the HPDBSCAN overlayed hypergrid in a two di-mensional problem. The points are indexed by hash table pointing to each grid cell that has a side length ofε; Right: Speed-up and scaling of HPDBSCAN.
Figure 2: Left: Result ts of HPDBSCAN including noise reduction; Right: Identified clusters that are illustrated using different colors.
communication protocols and enables the use of (R4) fair and stable scheduling tools and policies to enable the work on clusters for several users at the same time. Given that HPDBSCAN is open source [9] it belongs to the (R5) open source tools and open referencable data in PANGAEA [7] and Bremen [10], respectively, enables reproducibility of findings.
4.2
Parallel and Scalable Classification with
π
SVM
In this section we present our earth science classification use case in remote sensing preceded by some technical details of the used SVM software stack. As introduced in section 3.2 we have based our parallel SVM implementation onπSVM version 1.2. As of late 2014 version 1.2 is outdated, though, as its successor version 1.3 has been released. For time reasons we were unable to port our changes to the new version, but our outlined performance advancements are still valid, due to the fact thatπSVM 1.3 does not optimized the parallel code sections.
1 2 4 8 16 32 64 128 200
400 600
memory access fault
number of cores execution time in s optimizedπSVM πSVM 1 2 4 8 16 32 64 128 2 8 32 128
memory access fault
number of cores sp eedup optimizedπSVM πSVM Linear
Figure 3: Comparison between the originalπSVM version and its optimized version (including memory access fault). Left: Execution time as a function of doubling processing cores count. Right: Speedup values of constant-sized problem.
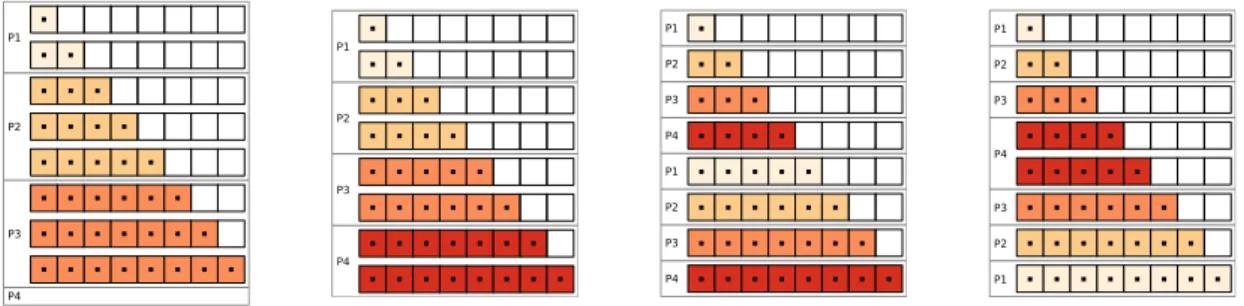
P1 P2 P3 P4 P1 P2 P3 P4 P1 P2 P3 P4 P1 P2 P3 P4 P1 P2 P3 P4 P1 P2 P3
Figure 4: Parallel memory access patterns in a triangular matrix using four processing cores. From left to right: initially implemented in πSVM, naive equal chunking, implemented in our optimizedπSVM tool, theoretically ideal pattern.
problems compared to the original πSVM implementation. While we still work on achieving better scalability (e.g. consideration of a hybrid implementation using OpenMP), the code has proven to work with our earth science classification case study. One of the major performance gains has been achieved through the usage of more suitable MPI collective operations. For example, in some source code sections a simple for loop was used to perform an MPI Bcast() numerous times to inform other processors about training updates. Instead we replaced them with singularMPI Allgather()calls reducing it from linear to constant time and memory com-plexity. A couple of other optimization strategies have been implemented. One of them is an improved matrix distribution pattern during the SVM training stage to balance the computa-tional load, schematically illustrated in figure 4. The unoptimizedπSVM code distributes them as depicted in the left picture, leaving processing cores idle. We have improved this distribu-tion pattern step-wise from a naive equal-sized chunking, to an skip-row approach and finally to a theoretically ideal on the right. In tests, however, we have found that the skip-row ap-proach outperforms all other patterns, due its simple implementation using one MPI collective operation, in contrast to the complex pattern required for the theoretically best.
studies in the field of remote sensing, e.g. on remote sensing image classification of the city Rome that we published at a remote sensing domain-specific conference IGARSS 2014 [4]. Since then we have shown of the scalability of the code by investigating more complex problems, such asthe Indian Pines dataset with over 50 classes. The dataset is openly available through EUDATs B2SHARE services [4] which enables reproducibility of the papers findings.
Our optimizedπSVM implementation takes advantage of (R1) parallel file systems and large storage capacity existing in many HPC environments and is based on MPI thus using (R3) standard communication protocols. The code can be used with typical HPC batch schedulers enabling the use of (R4) fair and stable scheduling tools and policies to enable the work on clusters for several users at the same time. Given that πSVM is open source as well as our optimized version the (R5) open source tools and open referencable data enables reproducibility of findings. Potential for future work is to enable the use of parallel I/O that is currently not supported (cf. R2).
5
Conclusion
One of the major findings of this paper is the need for parallel and scalable data mining tools in earth sciences, as has been demonstrated by the means of the two case studies. While we face these challenges in machine learning already now, the expected increase of ’big data’ in science in the coming years, will amplify this need even more. With our two parallel data mining tools, HPDBSCAN andπSVM, we start to tackle this problem, as both of them show significant improvements compared to their serial counterparts. However, they still only utilize a moderate number (several dozens to hundreds) of cores and do not yet fully exploit the capabilities of a large HPC supercomputer.
Given the page restriction, our study also did not describe all potential parallel optimization points entirely in detail. One straightforward example is the use of cross-validation for model selection as it is implemented inπSVM. Another example is the so-called grid search technique, which is a highly computational intensive, and that typically aims to explore the right combina-tion of machine learning algorithm parameters (i.e. here for the SVM and its rbf kernel). Hence, easy to implement parallelizations of this processes should enable additional massive speedups compared to serial implementations making thus the use of parallel and scalable methods even more feasible.
Future work beyond using the ever increasing amounts of datasets faced in earth sciences, is the exploration of in situ analytics towards exascale computing. In other words the exascale simulation (e.g. of a climate model) is running while another part of the machine (e.g. using GPGPUs or accelerators) is performing analytics in situ in order to validate the simulation with real measurement data and to perform statistics on the fly on the created simulated data. This bears the potential to abort costly computation runs early based on the statistical data mining that will take place concurrently to the particular numerical simulation.
Acknowledgments
We would like to express our thanks to the EUDAT European data infrastructure in general and the B2SHARE service support team in particular for providing us with storage space and handles to properly link research data.
References
[1] Peter et al. Baumann. The array database that is not a database: file based array query answering in rasdaman. InAdvances in Spatial and Temporal Databases, pages 478–483. Springer, 2013. [2] James B Campbell. Introduction to remote sensing. CRC Press, 2002.
[3] Gabriele et al. Cavallaro. A comparison of self-dual attribute profiles based on different filter rules for classification. In Geoscience and Remote Sensing Symposium (IGARSS), 2014 IEEE International, pages 1265–1268. IEEE, 2014.
[4] Gabriele et al. Cavallaro. Smart data analytics methods for remote sensing applications. In Geoscience and Remote Sensing Symposium (IGARSS), 2014 IEEE International, pages 1405– 1408. IEEE, 2014.
[5] Min et al. Chen. Parallel dbscan with priority r-tree. InInformation Management and Engineering (ICIME), 2010 The 2nd IEEE International Conference on, pages 508–511. IEEE, 2010.
[6] Corinna et al. Cortes. Support-vector networks. Machine learning, 20(3):273–297, 1995.
[7] Michael et al. Diepenbroek. PANGAEAan information system for environmental sciences. Com-puters & Geosciences, 28(10):1201–1210, 2002.
[8] Martin et al. Ester. A density-based algorithm for discovering clusters in large spatial databases with noise. InKdd, number 34 in 96, pages 226–231, 1996.
[9] Markus G¨otz. Clustering - HPDBSCAN. http://www.fz-juelich.de/ias/jsc/EN/Research/ DistributedComputing/DataAnalytics/Clustering/Clustering_node.html, 2015. [Online; ac-cessed Feburary, 10th 2015; 11:14 CET].
[10] Markus et al. G¨otz. HPDBSCAN Benchmark test files.URL:https://b2share.eudat.eu/record/ 178, 2015. [Online; Accessed Febuary, 9th 2015; 12:09 CET].
[11] HDF Group. Hierarchical data format version 5.http://www.hdfgroup.org/HDF5, 2015. [Online; Accessed Febuary, 10th 2015; 14:17 CET].
[12] Yaobin et al. He. MR-DBSCAN: an efficient parallel density-based clustering algorithm using mapreduce. InParallel and Distributed Systems (ICPADS), 2011 IEEE 17th International Con-ference on, pages 473–480. IEEE, 2011.
[13] Eshref et al. Januzaj. Scalable density-based distributed clustering. In Knowledge Discovery in Databases: PKDD 2004, pages 231–244. Springer, 2004.
[14] CUDA Nvidia. Compute unified device architecture programming guide. 2007.
[15] Md Mostofa Ali et al. Patwary. A new scalable parallel DBSCAN algorithm using the disjoint-set data structure. InHigh Performance Computing, Networking, Storage and Analysis (SC), 2012 International Conference for, pages 1–11. IEEE, 2012.
[16] Sangeeta et al. Rani. Recent techniques of clustering of time series data: A Survey.Int. J. Comput. Appl, 52(15):1–9, 2012.
[17] Hanan Samet. The design and analysis of spatial data structures, volume 85. Addison-Wesley Reading, MA, 1990.
[18] Zhanquan Sun and Geoffrey Fox. Study on parallel SVM based on MapReduce. InInternational Conference on Parallel and Distributed Processing Techniques and Applications, pages 16–19. Cite-seer, 2012.
[19] O Team. Big Data Now: Current Perspectives from OReilly Radar, 2011.
[20] Edward Y Changf Kaihua et al. Zhu. PSVM: Parallelizing Support Vector Machines on Distributed Computers.