Using Multiscale Visual Words for Lung Texture
Classification and Retrieval
Antonio Foncubierta-Rodr´ıguez?1, Adrien Depeursinge1,2, and Henning M¨uller1,2
1
University of Applied Sciences Western Switzerland (HES–SO), Sierre, Switzerland
2 University and University Hospitals of Geneva (HUG), Switzerland
Abstract. Interstitial lung diseases (ILDs) are regrouping over 150 het-erogeneous disorders of the lung parenchyma. High–Resolution Com-puted Tomography (HRCT) plays an important role in diagnosis, as stan-dard chest x–rays are often non–specific for ILDs. Assessment of ILDs is considerd hard for clinicians because the diseases are rare, patterns of-ten look visually similar and various clinical data need to be integrated. An image retrieval system to support interpretation of HRCT images by retrieving similar images is presented in this paper. The system uses a wavelet transform based on Difference of Gaussians (DoG) in order to extract texture descriptors from a set of 90 image series containing 1679 manually annotated regions corresponding to various ILDs. Visual words are used for feature aggregation and to describe tissue patterns. The optimal scale–progression scheme, number of visual words, as well as distance measure for clustering to generate visual words are investigated. A sufficiently high number of visual words is required to accurately de-scribe patterns with high intra–class variations such as healthy tissue. Scale progression has less influence and the Euclidean distance performs better than other distances. The results show that the system is able to learn the wide intra–class variations of healthy tissue and the character-istics of abnormal lung tissue to provide reliable assistance to clinicians. Keywords: Chest, CT, Computer–aided diagnosis
1
Introduction
The use of images in medicine to support diagnosis has followed an exponential growth over the past 20 years [16]. New imaging techniques provide useful in-formation to radiologists and other clinicians leading to an accurate diagnosis without a need for invasive techniques such as biopsies [20]. As a consequence, radiologists face changing problems: several studies have shown a high inter– and intra–observer variability in image–based diagnosis but a reduced variabil-ity for experienced observers [2, 11]. Quick access to similar cases of the past with accurate diagnosis and further case information appears as useful to less experienced radiologists in order to make decisions consistent [1]. This leads to
?
the second problem: the ever–increasing amount of images available makes it difficult to find relevant similar cases that can improve diagnosis. Without us-ing efficient computerized image search, this task becomes time–consumus-ing and observer–dependent such as searching cases in text books. Content–based image retrieval (CBIR) systems provide an objective, consistent similarity measure for visual retrieval and provide results to radiologists quickly, often allowing for in-teractive retrieval. CBIR provides radiologists with useful, related information of similar cases helping them make decisions based on the synthesis of similar cases and their own knowledge. Many CBIR systems focus on medical data to make relevant information accessible for clinicians [15, 1, 14].
Interstitial lung diseases (ILDs) group over 150 lung disorders characterized by gradual alteration of lung parenchyma leading to breathing dysfunction. The diagnosis is based on a combination of patient history, physical examination, pulmonary function testing and other analyses such as blood tests. When the synthesis of this suggests an ILD, high–resolution computer tomography (HRCT) plays an important role in establishing a differential diagnosis. HRCT gives ra-diologists the opportunity to visualize and identify the abnormalities occurring in the lung parenchyma based on textures of the lung tissue [18, 9]. Pattern recognition and classification of abnormalities are essential skills for identifying ILDs [2]. In this paper, lung image retrieval is presented that is capable of en-abling quick access to similar cases based on the texture of lung regions. The technique presented in this article uses distributions of multi–scale visual words to characterize the specific texture signatures of six lung tissue types commonly found in ILDs. It differs from previous efforts with similar techniques [10] in the size of the database, the classification of a higher number of tissue types and the inclusion of multi–scale information for the visual words. The optimal number of visual words is investigated. The size of the visual vocabulary is known to be a trade–off between discriminativity and generalizability [19]. A similar chal-lenge occurs for the scale progression, which may have an impact on the texture description [6]. The main contribution of this paper is a systematic analysis of visual vocabularies of varying size within a wavelet–based framework. The opti-mal number of visual words, scale progression as well as distance measures used for the clustering to generate the vocabulary are investigated. Although the ap-plication domain of this paper are ILDs, it can be extended to other image types with texture-based information, such as liver tissue in CT images.
2
Methods
2.1 Database
This work is based on a multimedia database of ILD cases created at the Geneva University Hospitals within the context of the Talisman 3 project [7]. A set of 90 thoracic HRCT scans of 85 patients (slice thickness 1mm, inter–slice distance 3 Talisman: Texture Analysis of Lung ImageS for Medical diagnostic AssistaNce,
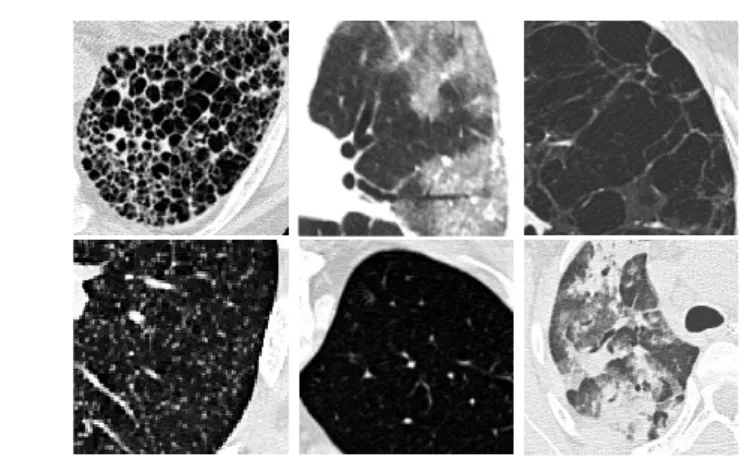
10mm) having 1679 annotated image regions is used. This represents the most frequent disease patterns. Healthy and five pathological lung tissue types com-monly used to characterize frequent ILDs in HRCT are used as texture classes (i.e. consolidation, emphysema, fibrosis, ground glass, healthy and micronodules, see Figure 2).
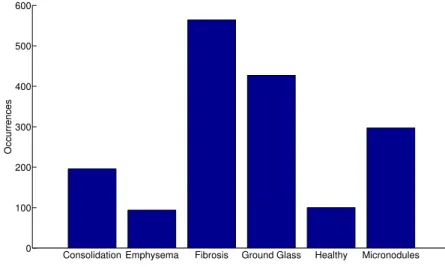
Consolidation Emphysema Fibrosis Ground Glass Healthy Micronodules 0 100 200 300 400 500 600 Occurrences
Fig. 1.Uneven distribution of disease patterns in the database.
The image database contains hand–drawn regions annotated in a collabo-rative fashion by two radiologists with 15 and 20 years of experience. These annotations are used as ground truth for performance evaluation. The diagnosis of each case was confirmed either by pathology (biopsy, bronchoalveolar washing) or by a laboratory/specific test. Among the annotated regions in the database, six tissue patterns are sufficiently frequently found for an automated analysis but the frequencies are not evenly distributed. Healthy tissue was obtained for most patients but as many are elder persons there often is very little healthy tissue. Figure 2 shows examples of patterns observed in the lung tissue and their distribution in the dataset. (see Figure 1).
2.2 Techniques Applied
The proposed CBIR system is based on two main ideas: a wavelet transform is used to provide multi–scale representations of the lung texture; visual words are computed from the wavelet coefficients to reduce dimensionality and to build texture descriptors based on patterns actually occurring in the data.
The wavelet–based analysis is performed with focus on the scale parameters, since previous efforts have shown the influence of scale progression in image
Fig. 2.Examples for texture in lung tissue showing (from top left to bottom right): fibrosis, ground glass, emphysema, micronodules, healthy and consolidation tissue.
retrieval [6]. Systematic scale progression variations allow obtaining reliable in-formation on the trade–off between inin-formation redundancy and retrieval per-formance. For the wavelet analysis, mother and father wavelets are Gaussian. This multi–scale analysis yields high–dimensional feature spaces, with 5 to 14 subbands based on the scale progression chosen. In order to reduce dimension-ality and to describe the information contained in a region of interest rather than the texture information of a pixel neighborhood, clustering of the wavelet coefficients is performed. Each cluster centroid then corresponds to a so–called visual word. To characterize local texture properties, each pixel of the annotated region is described by the closest centroid. This allows to characterize an entire region by a histogram of the visual words of its pixels.
Wavelet Analysis. Wavelet theory consists of a framework allowing for multi– resolution and multi–scale analysis of images by convolution with scaled and translated versions of a bandpass function, the mother wavelet ψ (see Equa-tion 1). This scaling in the spatial domain corresponds to another scaling in the frequency domain, as shown in Equation 2, whereΨ(ω) denotes the Fourier transform ofψ(t). ψs,τ(t) = 1 √ sψ t−τ s . (1) Ψs,τ(ω) = 1 √ s|s|Ψ(sω)e −jωτ. (2)
From Equation 2 it can be seen that for each value ofs, a bandpass filter of bandwidthB/scan be obtained, beingB the bandwidth of the mother wavelet. A common formulation for the scale definition is based on the minimum num-ber of scales that guarantee an invertible transform. Scaless change according to a dyadic scheme, wheres= 2j defines the scale at iterationj. This leads to
a division of the frequency domain in octaves. However, texture analysis may require intermediate scales as they can improve retrieval performance [6]. To define intermediate scales, a varying number of voicesv per octave can be used to define the scale parameter s= 2j/v.
To reduce the number of scales needed for analyzing the whole frequency spectrum, the wavelet theory defines the concept of father wavelet, also known as scaling function, which consists of the lowpass filter corresponding to a certain scale.
In this text, several scale progressions were tested by using different values for the number of voicesv. Only one subband of the scaling function per pro-gression scheme is used, and both the mother and father wavelets are derived from Gaussians. The scaled bandpass filters (i.e., wavelets) are expected to have their maximum response for different lung texture types. A fully isotropic scaling function is used to extract the low pass information of the texture. For this pur-pose, a 2D Gaussian filter is chosen. Mexican Hat wavelets are used to provide band–limited isotropic texture analysis. This work uses a precise approximation of the Mexican Hat wavelet that also satisfies the wavelet admissibility condition while being easier to compute, the Difference of Gaussians (DoG).
Visual Words. The term texture often has a fuzzy definition and refers to the characteristics of the pixel values within a certain region and their relationships. Since the wavelet transform can describe the transient of the values in the voxel surroundings, a way of aggregating this information for a region of interest is needed. Visual words [17] have been widely used in image retrieval and classifica-tion for describing images (or regions of interest) similarly to the bag–of–words approach used for text retrieval. For each voxel, this technique maps a set of con-tinuous low–level features, e.g. gray values or wavelet coefficients, into a compact discrete representation consisting in visual words. Every voxel is now described by a single word instead of a set of features. The aggregation of visual words for describing a region in an image is carried out by calculating the histogram of the words that appear within it, providing high–level features. The Multi–Scale visual–words (MSVW) aim at characterizing the organization of the voxel val-ues within a region. Whereas in text retrieval a document is described as the histogram of word occurrences, a given vocabulary in CBIR systems has to be created automatically from image data based on clustering of visual properties. Several techniques have been proposed in the literature to quantize descrip-tors into visual words [3, 17]. There are various clustering approaches depending on the desired characteristics for the clusters. In this paper, the well–knownk– means clustering is used. K–means aims at finding clusters iteratively, assuming a (hyper–) spherical cluster model and that all clusters are approximately of the same size. For this reason the cluster assignment is done by selecting the nearest cluster centroid in terms of Euclidean distance. Adding a feature with a large variability such as the original gray level value can make data too sparse and therefore difficult to cluster. Other distance measures are explored for re-moving inter–feature correlation, such as the Mahalanobis distance [13] or by normalizing the maximum value of features prior to clustering.
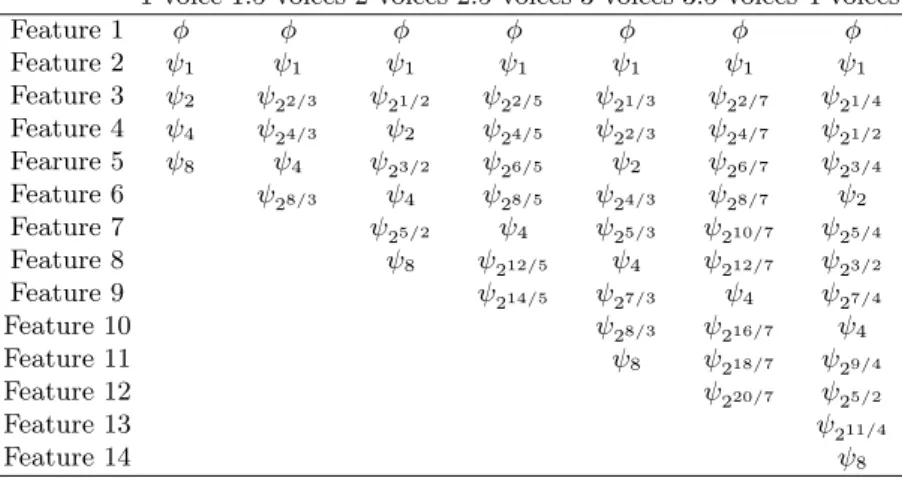
Table 1. Features for every scale progression.φ corresponds to the scaling function values, whereasψscorresponds to the wavelet values for scales
1 voice 1.5 voices 2 voices 2.5 voices 3 voices 3.5 voices 4 voices
Feature 1 φ φ φ φ φ φ φ Feature 2 ψ1 ψ1 ψ1 ψ1 ψ1 ψ1 ψ1 Feature 3 ψ2 ψ22/3 ψ21/2 ψ22/5 ψ21/3 ψ22/7 ψ21/4 Feature 4 ψ4 ψ24/3 ψ2 ψ24/5 ψ22/3 ψ24/7 ψ21/2 Fearure 5 ψ8 ψ4 ψ23/2 ψ26/5 ψ2 ψ26/7 ψ23/4 Feature 6 ψ28/3 ψ4 ψ28/5 ψ24/3 ψ28/7 ψ2 Feature 7 ψ25/2 ψ4 ψ25/3 ψ210/7 ψ25/4 Feature 8 ψ8 ψ212/5 ψ4 ψ212/7 ψ23/2 Feature 9 ψ214/5 ψ27/3 ψ4 ψ27/4 Feature 10 ψ28/3 ψ216/7 ψ4 Feature 11 ψ8 ψ218/7 ψ29/4 Feature 12 ψ220/7 ψ25/2 Feature 13 ψ211/4 Feature 14 ψ8
Once visual features are clustered, annotated regions can be described by the bag of visual words contained in the region: these are the words corresponding to the feature vector for every pixel in the form of a histogram. Since regions are now described in terms of the histogram of visual words, maximum dimensionality is the number of visual words. The dimensionality of the feature space is reduced, as annotated regions are described by a single vector whereas they were sometimes described by thousands of features.
3
Results
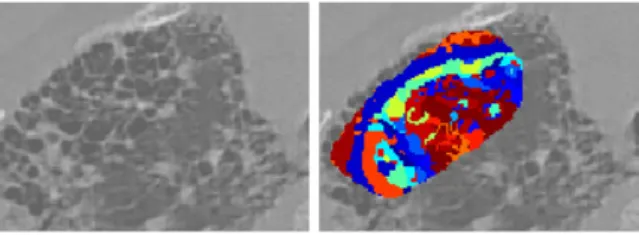
In this section, the techniques described in Section 2 are applied to the data set. First, the entire database is analyzed and visual features are extracted with seven scale progression schemes, using a number of voices per octave ranging from 1 to 4 in steps of 0.5 voices, with scale values 1≤s≤8. For each scale progression, a wavelet transform is computed on the complete image and only values for pixels contained in annotated regions of interest are included in the feature space. This produces a set of 7 feature spaces with a number of features ranging from 5 to 14 features, as shown in Table 1. Then, each of the feature spaces is clustered using k–means with 5 different numbers of clusters, varying from 5 to 25. This is done three times, using Euclidean distance, Euclidean distance in normalized feature space and Mahalanobis distance. Once the feature spaces are clustered, the images are analyzed again to assign visual words to each pixel of the annotated regions (see Figure 3) This provides a set of 105 feature sets as a result of using 7 scale progressions, 5 vocabulary sizes for each progression, and 3 distance measures for each vocabulary.
Fig. 3.Cropped example of a region described by visual words (in color).
For performance evaluation, early precision (P1, precision of the first image) is calculated using a leave–one–patient–out cross–validation in order to avoid that tissue of a patient influences classification of other tissue types of the same patient, which can create a bias. Results show that the Euclidean distance in the original feature space outperforms the other two distance measures and that 25 visual words perform better than a smaller number of visual words. Figure 4(a) shows the results for class–specific P1 for various scale progressions, which is equivalent to a kNN classification withk = 1. No clear trend can be extracted from the disease–wise performance, whereas in terms of geometric and arithmetic means the only trend is a slight decay with an increasing number of voices.
It was initially thought that a relatively small number of words would be best for classifying the few classes. The trend for all scale progressions and distance measures shows that performance improves with a larger number of visual words. The experiment was then extended increasing the size of the visual vocabulary. The results are calculated for Euclidean distance and 1 voice scale progression, since both are simpler and perform better than other configurations. Figure 4(b) shows P1 for visual words varying from 5 to 500 for every tissue type in the database together with the geometric mean. P5 and P10, as well as precision at the number of relevant regions in the database were also calculated for the best performing configurations, showing a similar decrease in performance for all measures, without any remarkable difference (see Table 2).
P1 (%) P5 (%) P10 (%) PNr (%)
125 visual words 61.5 59.18 57.4 41.3
150 visual words 61.3 59 56.6 41.1
Table 2.Early and late precision percentage values for 125 and 150 visual words.
4
Discussion
Results in Section 3 show that the scale progression does not have a strong impact on the system performance; there is a slowly decaying trend that might
1 1.5 2 2.5 3 3.5 4 30 35 40 45 50 55 60 65 70 75 80 Number of Voices P@1 (%) Consolidation Emphysema Fibrosis Ground Glass Healthy Micronodules Geometric Mean Arithmetic Mean
(a)Varying number of voices, 25 visual words .
0 50 100 150 200 250 300 350 400 450 500 20 30 40 50 60 70 80
Number of Visual Words
P@1 (%) Consolidation Emphysema Fibrosis Ground Glass Healthy Micronodules Geometric mean
(b) Varying vocabulary size, 1 voice.
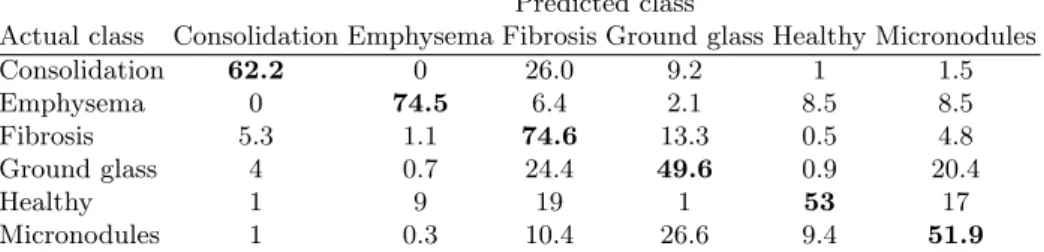
Predicted class
Actual class Consolidation Emphysema Fibrosis Ground glass Healthy Micronodules
Consolidation 62.2 0 26.0 9.2 1 1.5 Emphysema 0 74.5 6.4 2.1 8.5 8.5 Fibrosis 5.3 1.1 74.6 13.3 0.5 4.8 Ground glass 4 0.7 24.4 49.6 0.9 20.4 Healthy 1 9 19 1 53 17 Micronodules 1 0.3 10.4 26.6 9.4 51.9
Table 3.Confusion matrix of the first retrieved regions for dyadic scale progression and 125 visual words using Euclidean distance.
be due to the fact that 1 voice (dyadic scale) already has enough information for representing the texture patterns. Therefore, a larger number of voices may add noise rather than valuable band–pass information (see Figure 4(a)).
By extending the experiment, the optimal number of visual words is found to be between 100 and 300, where performance remains fairly stable. This can be explained by the fact that some of the 6 tissue classes may contain several visually distinct patterns that can better be described with a larger number of clusters. The slow decrease when creating even more visual words may be due to splitting useful clusters and thus removing important class information. Figure 4(b) shows that the increase in overall performance is mostly due to an improvement in precision for healthy tissue. This confirms the hypothesis that for an accurate description of strongly varying patterns such as healthy tissue a sufficiently high number of visual words is required.
The system presented in this work performs well in a harder scenario com-pared to past work using similar visual features on basically the same database [5] Whereas previous work included 99 clinical parameters in the classification, the work presented in this paper uses only visual information. The inclusion of the clinical context in retrieval can increase performance in the order of 8% [4]. Whereas leave–one–ROI–out assures that the retrieved cases do not contain the query item itself, the cross–validation scheme used for this work assures that the retrieved cases do not contain any result from the same patient. This is clearly a more realistic, yet more difficult, scenario that is unfortunately often neglected in the literature [8, 12]. Particularly with a k–NN classifier, tissue samples of the same patient can often lead to seemingly better results as tissue of the same patient and with the same abnormalities is clearly much more visually similar than that of other patients.
Another common mistake is to not include healthy tissue into the retrieval database, which is the first question of a clinician in any case. Healthy tissue has a very large variety between patients, whereas pathologic tissue usually has much clearer class boundaries. In this work, healthy tissue is included as a class to be regarded, providing a more useful tool that can not only classify abnormal patterns, but detect these abnormalities from healthy parts. In Table 3 it can be
seen that considering only a 2–class database (healthy and non–healthy tissue) the system would have P1 of 94.5%, with less than 3% false negatives.
5
Conclusions and Future Work
In this paper, a content–based image retrieval system using multi–scale visual words to describe lung texture associated with ILDs is proposed. The database used for evaluation is taken from clinical routine and annotated by two emer-gency radiologists. Results show a good performance of the system when the correct parameters are chosen for scale progression, distance metric used and particularly the number of visual words. The system is valuable for supplying clinicians with visually similar regions of interest and also visually similar cases with proven pathologies that can support diagnosis. The implemented techniques can be seen as useful in other clinical areas where texture analysis is required for diagnosis such as for analyzing liver images. The results show a limited impact of the number of bandpass wavelet filters but highlight the importance of a suffi-ciently high number of visual words to describe tissue types with high intra–class variations such as healthy tissue.
Further work is foreseen that may improve the system performance. Using the full 3D data for the generation of the visual words is foreseen as some tissue types can profit from available 3D information, for example to disambiguate between vessels in the lung and nodules that look very similar in 2D slices. This requires a clinical protocol with small inter slice distance, though. The current system only concentrates on visual analysis whereas the inclusion of clinical data such as age and smoking history has shown to increase classification performance in the past [4].
Acknowledgments This work was supported by the Swiss National Science Foundation (FNS) in the MANY project (grant 205321–130046) as well as the EU 7th Framework Program in the context of the Khresmoi project (FP7– 257528).
References
1. Aisen, A.M., Broderick, L.S., Winer-Muram, H., Brodley, C.E., Kak, A.C., Pavlopoulou, C., Dy, J., Shyu, C.R., Marchiori, A.: Automated storage and re-trieval of thin–section CT images to assist diagnosis: System description and pre-liminary assessment. RAD 228(1), 265–270 (Jul 2003)
2. Aziz, Z.A., Wells, A.U., Hansell, D.M., Bain, G.A., Copley, S.J., Desai, S.R., Ellis, S.M., Gleeson, F.V., Grubnic, S., Nicholson, A.G., Padley, S.P., Pointon, K.S., Reynolds, J.H., Robertson, R.J., Rubens, M.B.: HRCT diagnosis of diffuse parenchymal lung disease: inter–observer variation. Thorax 59(6), 506–511 (Jun 2004)
3. Dance, C., Willamowski, J., Fan, L., Bray, C., Csurka, G.: Visual categorization with bags of keypoints. In: ECCV International Workshop on Statistical Learning in Computer Vision (2004)
4. Depeursinge, A., Iavindrasana, J., Cohen, G., Platon, A., Poletti, P.A., M¨uller, H.: Lung tissue classification in HRCT data integrating the clinical context. In: 21th IEEE Symposium on Computer-Based Medical Systems (CBMS). pp. 542–547. Jyv¨askyl¨a, Finland (June 2008)
5. Depeursinge, A., Sage, D., Hidki, A., Platon, A., Poletti, P.A., Unser, M., M¨uller, H.: Lung tissue classification using Wavelet frames. In: Engineering in Medicine and Biology Society, 2007. EMBS 2007. 29th Annual International Conference of the IEEE. pp. 6259–6262. IEEE Computer Society, Lyon, France (Aug 2007) 6. Depeursinge, A., Van De Ville, D., Unser, M., M¨uller, H.: Lung tissue analysis
using isotropic polyharmonic B–spline wavelets. In: MICCAI 2008 Workshop on Pulmonary Image Analysis. pp. 125–134. New York, USA (Sep 2008)
7. Depeursinge, A., Vargas, A., Platon, A., Geissbuhler, A., Poletti, P.A., M¨uller, H.: Building a reference multimedia database for interstitial lung diseases. Computer-ized Medical Imaging and Graphics (submitted)
8. Dy, J., Brodley, C., Kak, A., Broderick, L., Aisen, A.: Unsupervised feature se-lection applied to content-based retrieval of lung images. Pattern Analysis and Machine Intelligence, IEEE Transactions on 25(3), 373 – 378 (2003)
9. Fetita, C., Chang-Chien, K.C., Brillet, P.Y., Prˆeteux, F., Grenier, P.: Diffuse parenchymal lung diseases: 3D automated detection in MDCT. In: LNCS, S. (ed.) Proceedings of MICCAI 2007. vol. 4791, pp. 825–833 (Nov 2007)
10. Gangeh, M., Sørensen, L., Shaker, S., Kamel, M., De Bruijne, M., Loog, M.: A texton–based approach for the classification of lung parenchyma in ct images. In: Jiang, T., Navab, N., Pluim, J., Viergever, M. (eds.) Medical Image Computing and Computer-Assisted Intervention MICCAI 2010. Lecture Notes in Computer Science, vol. 6363, pp. 595–602. Springer Berlin / Heidelberg (September 2010) 11. Korfiatis, P.D., Karahaliou, A.N., Kazantzi, A.D., Kalogeropoulou, C., Costaridou,
L.I.: Texture-based identification and characterization of interstitial pneumonia patterns in lung multidetector ct. IEEE Transactions on Information Technology in Biomedicine 14(3), 675–680 (2010)
12. Liu, C.T., Tai, P.L., Chen, A.Y.J., Peng, C.H., Wang, J.S.: A content–based medi-cal teaching file assistant for CT lung image retrieval. In: Proceedings of the IEEE International Conference on Electronics, Circuits, Systems (ICECS2000). pp. 361– 365. Jouneih–Kaslik, Lebanon (Dec 2000)
13. Mahalanobis, P.: On the generalised distance in statistics. In: Proceedings of the National Institute of Science, India. vol. 2, pp. 49–55 (1936)
14. M¨uller, H., Michoux, N., Bandon, D., Geissbuhler, A.: A review of content-based image retrieval systems in medicine–clinical benefits and future directions. Inter-nation Journal of Medical Informatics 73(1), 1–23 (Feb 2004)
15. Shyu, C.R., Brodley, C.E., Kak, A.C., Kosaka, A., Aisen, A.M., Broderick, L.S.: ASSERT: A physician–in–the–loop content–based retrieval system for HRCT im-age databases. Computer Vision and Imim-age Understanding 75(1/2), 111–132 (1999) 16. Simel, D., Drummond, R.: The rational clinical examination: evidence–based
clin-ical diagnosis. McGraw–Hill (Aug 2008)
17. Sivic, J., Zisserman, A.: Video google: A text retrieval approach to object matching in videos. Computer Vision, IEEE International Conference on 2, 1470 (2003) 18. Uppaluri, R., Hoffman, E.A., Sonka, M., Hartley, P.G., Hunninghake, G.W.,
McLennan, G.: Computer recognition of regional lung disease patterns. American Journal of Respiratory and Critical Care Medicine 160(2), 648–654 (Aug 1999) 19. Yang, J., Jiang, Y.G., Hauptmann, A.G., Ngo, C.W.: Evaluating
workshop on Workshop on multimedia information retrieval. pp. 197–206. MIR ’07, ACM, New York, NY, USA (2007)
20. Zheng, Y., Greenleaf, J., Gisvold, J.: Reduction of breast biopsies with a modified self-organizing map. Neural Networks, IEEE Transactions on 8(6), 1386 –1396 (Nov 1997)