Computer-Based Classification of Dermoscopy
Images of Melanocytic Lesions on Acral Volar Skin
Hitoshi Iyatomi
1, Hiroshi Oka
2, M Emre Celebi
3, Koichi Ogawa
1, Giuseppe Argenziano
4, H Peter Soyer
5,
Hiroshi Koga
6, Toshiaki Saida
6, Kuniaki Ohara
7and Masaru Tanaka
8We describe a fully automated system for the classification of acral volar melanomas. We used a total of 213 acral dermoscopy images (176 nevi and 37 melanomas). Our automatic tumor area extraction algorithm successfully extracted the tumor in 199 cases (169 nevi and 30 melanomas), and we developed a diagnostic classifier using these images. Our linear classifier achieved a sensitivity (SE) of 100%, a specificity (SP) of 95.9%, and an area under the receiver operating characteristic curve (AUC) of 0.993 using a leave-one-out cross-validation strategy (81.1% SE, 92.1% SP; considering 14 unsuccessful extraction cases as false classification). In addition, we developed three pattern detectors for typical dermoscopic structures such as parallel ridge, parallel furrow, and fibrillar patterns. These also achieved good detection accuracy as indicated by their AUC values: 0.985, 0.931, and 0.890, respectively. The features used in the melanoma–nevus classifier and the parallel ridge detector have significant overlap.
Journal of Investigative Dermatology(2008)128,2049–2054; doi:10.1038/jid.2008.28; published online 6 March 2008
INTRODUCTION
In non-white populations, almost half of the melanomas are found in acral volar areas and nearly 30% of melanomas affect the sole of the foot (Saida et al., 2002). Melanocytic nevi are also frequently found in their acral skin and approximately 8% of Japanese have melanocytic nevi on their soles (Saida et al., 2004). The authors reported that about 90% of melanomas have the parallel ridge pattern and 70% of melanocytic nevi have the parallel furrow pattern. They concluded that the parallel ridge pattern is the most typical characteristic of acral volar melanomas.
Despite the use of dermoscopy, diagnosis is subjective and the accuracy of expert dermatologists in diagnosing melano-ma is still estimelano-mated to be 75–84% (Argenzianoet al., 2003). For the reasons cited above, several groups have developed automated analysis procedures to overcome these problems
and reported high levels of diagnostic accuracy (Ercal et al., 1994; Seidenari et al., 1998; Elbaum et al., 2001; Ganster et al., 2001; Rubegniet al., 2002; Hoffmann et al., 2003; Blum et al., 2004; Burroni et al., 2005; Celebi et al., 2007). However, automatic detection of the parallel ridge and parallel furrow patterns is often difficult because of the wide variety of dermoscopy images, and there is no published method on computerized classification of this diagnostic category.
We developed a new diagnostic classifier for acral volar lesions and for our web-based melanoma diagnostic system (Oka et al., 2004). Our method parameterizes the lesions objectively and evaluates them instead of detecting the ridges or furrows in the images directly.
RESULTS
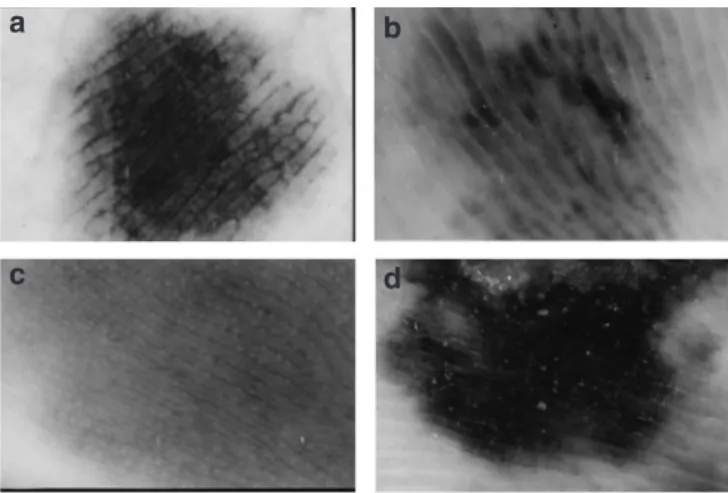
Tumor area extraction and observed dermoscopic patterns Our computer-based fully automated tumor area extraction method (Iyatomi et al., 2006) successfully extracted tumor area in 199 out of 213 cases (Table 1). Samples of dermo-scopy images are shown in Figure 1.
Out of 169 nevi, parallel ridge, parallel furrow, and fibrillar patterns were found in 5, 133, and 49 cases, respec-tively. A total of 11 cases of nevi had no specific patterns and 28 nevi had both parallel furrow and fibrillar patterns. One nevus had both parallel ridge and fibrillar pattern. In 30 melanomas, parallel ridge, parallel furrow, and fibrillar patterns were found in 24, 2, and 1 cases, respectively. Five melanomas had no specific patterns and one melanoma had all three patterns.
Classifier and the performance
Using principal component analysis (PCA), a total of 428 image parameters were transformed into 198 orthogonal Received 20 August 2007; revised 20 November 2007; accepted 22
December 2007; published online 6 March 2008
1Department of Electronic Informatics, Hosei University Faculty of Engineering, Koganei, Tokyo, Japan;2Section of Cosmetic Surgery, Shiromoto Clinic, Shinjuku, Tokyo, Japan;3Department of Computer Science, Louisiana State University, Shreveport, Louisiana, USA;4Department of Dermatology, Second University of Naples, Naples, Italy;5Queensland Institute of Dermatology, University of Queensland, Brisbane, Queensland, Australia; 6Department of Dermatology, Shinshu University School of Medicine, Matsumoto, Nagano, Japan;7Department of Dermatology, Toranomon Hospital, Minano, Tokyo, Japan and8Department of Dermatology, Tokyo Women’s Medical University Medical Center East, Arakawa, Tokyo, Japan Correspondence: Dr Hitoshi Iyatomi, Department of Electronic Informatics, Faculty of Engineering, Hosei University, 3-7-2 Kajino-cho, Koganei, Tokyo 184-8584, Japan. E-mail: [email protected]
Abbreviations: AUC, area under the receiver operating characteristic curve; PC, principal component; PCA, principal component analysis; ROC, receiver operating characteristic; SE, sensitivity; SP, specificity
principal components (PCs) without information loss. From these PCs, we selected the effective ones for each classifier. Table 2 summarizes the number of selected PCs for each classification model, the determination coefficient R2, the standard deviation of mean estimated errorE, and the order number of the first 10 PCs lined by the selected sequence by stepwise input selection method.
In the melanoma–nevus classifier, many significant (small numbered) PCs were found in the first 10 selected features.
The parallel ridge and parallel furrow detectors were also composed of significant PCs. On the other hand, the fibrillar pattern detector showed a different trend.
The leave-one-out cross-validation results for these four models are shown in Table 3.
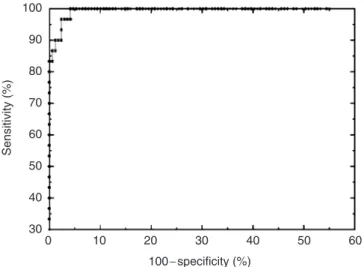
The sensitivity (SE) and specificity (SP) values shown are those that have the maximum product. The positive predictive value and negative predictive value shown are at the same diagnosis threshold. The numbers in parentheses represent the performance when 14 unsuccessful extraction cases are considered as false classification. The correspond-ing receiver operatcorrespond-ing characteristic (ROC) curve is shown in Figure 2.
On the other hand, the identification performance for melanoma and three typical structures using a 10-fold cross-validation was 0.991, 0.982, 0.921, and 0.883 in area under the ROC curve (AUC), respectively, and the perfor-mance by a half-and-half test was 0.991, 0.971, 0.889, and 0.839 in AUC, respectively.
Table 4 summarizes the major constituting image features (top five in magnitudes: note that each feature was normal-ized to N(0, 1)) of typical significant PCs, their linguistic expression, their contribution ratio (ratio of the corresponding eigenvalue to the total eigenvalues: li/Sli), and their classification performance using a linear model. (y¼axþb; Table 1. Dermoscopy images used in this experiment
Lesion type
No. of images correctly extracted1(in Japanese)
No. of patients correctly extracted2(in Japanese) Nevus 169/176 (144/151) 166/170 (141/145) Melanoma 30/37 (29/36) 18/20 (17/19) Total 199/213 (174/188) 184/189 (159/164)
1The number of images that were used to correctly extract their tumor
areas by computer-based tumor area extraction algorithm (Iyatomiet al., 2006). Numbers in parenthesis represent those of Japanese.
2The number of patients whose images were used to correctly extract their
tumor areas by extraction algorithm.
a b
c d
Figure 1.Samples of acral volar dermoscopy images.(a) Nevus, (b) melanoma, (c) nevus (could not be extracted by our tumor extraction algorithm), (d) melanoma (could not be extracted by our tumor extraction algorithm).
Table 2. Modeling performance of developed classifiers and their constituting PCs
Classifier type No. of inputs R2 E Selected PCs (first 10)1
Melanoma 45 0.807 0.315 2,9,6,1,3, 15, 91, 40, 20, 98
Parallel ridge pattern 40 0.736 0.363 2,9,1,6,3, 59, 20, 88, 77, 33 Parallel furrow pattern 35 0.571 0.614 6,2, 145, 15,3, 98, 70, 24, 59, 179 Fibrillar pattern 24 0.434 0.654 106, 66, 56, 145, 137, 94, 111, 169, 131, 5 PC, principal component.
R2is the determination coefficient adjusted by degree of freedom between average of physician and the computer-based results.
Eis the standard deviation of the average estimated error between the training signal and the computer-based results.
1The first 10 selected PCs by incremental stepwise method in selected sequence. The number represents the order of PCs. The smaller values indicate the
more significant component.
Table 3. Identification performance of acral volar melanoma and three typical structures using leave-one-out cross-validation strategy
Classifier type SE (%)1 SP (%)1 PPV (%)1 NPV (%)1 AUC Melanoma 100 (81.12) 95.9 (92.12) 81.1 95.9 0.993 Parallel ridge pattern 93.1 97.7 87.1 98.8 0.985 Parallel furrow pattern 90.4 85.9 93.1 80.9 0.931 Fibrillar pattern 88.0 77.9 57.1 95.1 0.890 AUC, area under the receiver operating characteristic curve; NPV, negative predictive value; PPV, positive predictive value; SE, sensitivity; SP, specificity.
1At which SESP is maximum value.
y is target value, x is the corresponding PC, a is the coefficient, andbis the constant bias value.)
Note that in Table 4 the image features are abbreviated. For example, ‘‘diffX_T80’’ represents the difference of center of mass in thexdirection (diffX) between the original tumor area and the area with intensity lower than a threshold of 80 (T80). Similarly, ‘‘corr90_d1/2’’ represents the texture correlation (corr) in the tumor area in the vertical direction (90 degree) as measured by a co-occurrence matrix with distance parameter d, the half of the major axis length of the tumor object. R, G, and B indicate red, green, and blue channel values, respec-tively. H, S, and V represent the hue, saturation, and intensity in the HSV color space, respectively.
DISCUSSION
Automatic tumor area extraction
In 14 cases (7 nevi and 7 melanomas), our automated tumor area extraction algorithm failed. This was due to the size of
the tumor being larger than about 70% of the dermoscope field. Our algorithm is mainly for early melanomas that usually fit in the frame. As larger lesions are relatively easy to diagnose, we deem that computer-based screening is not necessary. The false extraction rate for melanomas was higher (19%) than that of nevi (4%). However, our algorithm successfully extracted 93.4% of the tumor areas.
Analyzing results for each dermoscopic pattern
Our method achieved high detection rate for melanoma and parallel ridge pattern. Almost equivalent results were obtained using leave-one-out validation, 10-fold cross-validation, and half-and-half test, and therefore the results can be considered as reasonable. We think that the accurate recognition of parallel ridge pattern is important for the accurate detection of melanoma.
The melanoma classifier and the parallel ridge detector have many common PCs. In particular, the top five PCs for the two were completely the same. Note that parameters chosen early in the stepwise feature selection were thought to be more important for the classification because the statis-tically most significant parameters were selected in each step. Important features
The common PCs are mainly related to asymmetry and structural properties rather than color (Table 4).
The linear classifier using only these five components achieved 0.933 AUC, 93.3% SE, and 91.1% SP using a leave-one-out cross-validation strategy. Dermatologists evaluate parallel patterns using the intensity distribution of the images, and they consider the peripheral area of the lesion as important.
We confirmed that our computer-based results, like those of the dermatologists, also focus on similar characteristics.
From Table 4, the linear classifier using only one PC could discriminate between melanomas and nevi with a high accu-racy. Global texture properties used in the 2nd component 100 90 80 70 60 50 40 30 0 10 20 Sensitivity (%) 30 40 100−specificity (%) 50 60
Figure 2.ROC curve for classification of acral volar melanomas.
Table 4. Interpretation of typical PCs and their diagnostic performance
Numerical expression by top five constituting image features
PC Interpretation ki/Rki(%)1 SE (%)2 SP (%)2 AUC
2nd D0.32 diffX_T80+0.15 corr90_d1/20.14 corr135_d1/2.8–0.14sX_180–0.13 circ_T180
Asymmetry+global texture 12.8 93.3 65.1 0.833
9th D0.21 diffX_80+0.14 skewX_30–0.14 Brate_L1/40–0.14 Brate_L1/35–0.13 corr135_d1/4
Peripheral+asymmetry+border 4.3 80.0 65.7 0.763
6th D0.25 skewS_tumor-norm+0.24 aveR_peri-norm+0.20 maxV_peri–0.20 maxR_tumor+0.15sS_tumor-peri
Color (difference between tumor and skin) 7.0 66.7 70.4 0.711
1st D0.23 maxV_peri0.19 corr90_d1/4+0.19 maxR_peri+0.19 minR_peri+0.18sH_peri
Peripheral+color 33.8 53.3 78.1 0.581
3rd D0.18 minH_peri+0.17 circ_T180–0.15sY_T230+0.14sY_T155 –0.13 ratio_T80
Asymmetry+peripheral 10.5 66.7 65.1 0.645
AUC, area under the receiver operating characteristic curve; PC, principal component; SE, sensitivity; SP, specificity.
1Contribution ratio of the PC: ratio of eigenvaluel
ito the total eigenvaluesSli.
illustrate the periodicity of the structures present in the image. This meets our intuition, and it is considered that they contributed to discriminate effectively between ridges and furrows.
On the other hand, for the fibrillar pattern detector, most of the selected components were not significant; that is, they were low ranked (Table 2). Global texture features often used as a component of the parallel ridge detector were hardly selected by the fibrillar pattern detector, which seems not to extract the parallel patterns observed in ridges or furrows.
These results confirm that the features selected by acral volar classifiers showed a different trend. Our previous linear classifier, which was built on 1,258 non-acral dermoscopy images (1,050 melanocytic nevi and 198 melanomas) using the same method, achieved 0.914 AUC, 83.3% SE, and 85.8% SP using leave-one-out cross-validation. On the other hand, it achieved only 0.766 AUC, 70.0% SE, and 63.9% SP on the set of 199 acral volar images. We confirmed again from this experiment that discriminating acral volar melano-mas by computer-based methods requires a specifically designed classifier that focuses more on asymmetry and textural properties of the image rather than only color. Classification model
In this study, we used orthogonalized image features calcu-lated by PCA. Because features extracted from the images are potentially correlated, PCA might reveal composite features that are more effective than their individual constituents.
In addition, it is well known that building a classifier with highly correlated parameters might result in poor classifica-tion accuracy for unseen data. On the other hand, we used linear models to classify acral melanomas and to identify specific dermoscopic structures. Although various sophisti-cated classifiers, such as artificial neural networks, logistic regression models, support vector machine classifiers, and so on, have been successfully used in the literature, using a linear model enables us to examine the relationship between input parameters and each class more clearly. From this point of view, the architecture of the classifier should be simple, taking into account the system generality, and we should focus more on finding effective input features rather than searching for the optimal classification model. The developed linear models achieved sufficiently high accuracy, and we consider that the extracted features were appropriate for classification.
Other issues
In this study, some images were from the same patients; however, as each image was from a different lesion and several evaluation methods provide almost equivalent results, we can ignore intrasubject correlation. On the other hand, our melanoma source was heavily concentrated in the Japanese population. Our classifier identified both Japanese and other cases accurately without significant difference, and therefore we can conclude that the diagnostic results did not depend on the source of images.
The presented system would classify the benign lesions with parallel ridge pattern such as Peutz-Jeghers syndrome as
malignant. However, we do not consider this to be a critical issue, as this system would be used primarily for screening.
On the other hand, we have to be careful not to miss melanomas that do not contain the parallel ridge pattern. Also, subcorneal hematoma and the like sometimes exhibit a similar appearance as the parallel ridge pattern. If clinical history is taken into account, the system could be made more accurate.
Our acral volar classifier successfully diagnosed 11 nevi and 5 melanomas that have no parallel pattern. We plan to investigate the issue of whether or not these lesions should be handled by an acral volar classifier. We will also continue collecting acral volar lesions to improve the generalization capability of the classifier.
The classifier described here will be available on our web-based screening system in the near future.
MATERIALS AND METHODS Materials
Digital dermoscopy images of pigmented skin lesions (PSLs) were collected from four Japanese hospitals (Keio University Hospital, Tokyo; Toranomon Hospital, Tokyo; Shinshu University Hospital, Matsumoto; Inagi Hospital, Tokyo) and two European university hospitals (University of Naples, Italy; University of Graz, Austria) as part of the EDRA-CDROM (Argenzianoet al., 2000).
These were 24-bit color RGB images in JPEG (Joint Photographic Experts Group) format. A total of 213 acral volar dermoscopy images, 176 clinically equivocal nevi and 37 melanomas from 189 patients (75 male patients, 105 female patients, and 9 unknown), average and standard deviation of age of the patients 28.6±22.2 years (max¼87, min¼0), were prepared. Note that the age information of 26 patients and 27 images was lost and these were not included in the above statistics. This experiment does not require intuitional approval or patient consent.
In this study, we used those images on which our tumor area extraction algorithm (Iyatomi et al., 2006) was successful (169 benign nevi and 30 melanomas from 184 patients) (Table 1).
All cases were histopathologically or clinically diagnosed materials, and these results were used as the gold standard (training data) for building the classifier. We used all acral volar materials with established diagnosis stored in the above Japanese hospitals and CD resources (European cases).
Classification of acral lesions
We developed acral melanoma–nevus classifier and three detectors for typical patterns of acral volar lesions: parallel ridge pattern, parallel furrow pattern, and fibrillar pattern.
For melanoma–nevus classifier, the training signal of 1 or1 was assigned to each melanoma and nevus case, respectively. Similarly, a training signal of 1 (positive) or1 (negative) was assigned to each dermoscopic pattern.
The dermoscopic patterns were identified by three experienced dermatologists, and only those patterns on which at least two dermatologists agreed were considered.
Note that dermoscopic patterns were assessed independently of each other, and therefore some cases received multiple or no assignments.
We extracted tumor area with our tumor extraction algorithm and rotated the tumor object to align its major axis with the Cartesianxaxis.
Then, we calculated a total of 428 image-related objective features. They can be roughly categorized into color, symmetry, border, and texture properties.
As color-related features, a total of 140 parameters were calcu-lated: minimum (min), average (ave), maximum (max), standard deviation (s), and skewness (skew) values in the RGB and HSV color space, respectively (subtotal 30), for the whole tumor area (tumor), periphery of the tumor area (peri), differences between the tumor area and the surrounding skin (tumorskin), and differences between peripheral and surrounding skin (periskin).
In addition, a total of 20 color-related features were calculated: the number of colors (#color) in the tumor area and peripheral tumor area in the RGB and HSV color spaces quantized to 83(¼512) and 163(¼4,096) colors, respectively (subtotal 8), the average color of surrounding skin (R, G, B, H, S, V: subtotal 6), and average color differences between the peripheral tumor area and the inside of the tumor area (R, G, B, H, S, V: subtotal 6). Note that the peripheral part of the tumor is defined as the region inside the border that has an area equal to 30% of the tumor area.
In the symmetry category, a total of 80 features were calculated. We designed 10 intensity threshold values (T) from 5 to 230 with a step size of 25. In the extracted tumor area, thresholding was performed and the areas whose intensity was lower than the threshold were determined.
From each such area, we calculated eight features as follows: area ratio to original tumor size (ratio), circularity, differences of the center of gravity between original tumor (diffX, diffY), standard deviation of the distribution (sx,sy), and skewness of the distribution (skewX, skewY).
To quantify the border structure, a total of 32 features were calculated. The tumor areas are divided into eight equiangular regions. In each region, we defined a window whose size is SS and center is on the border of the tumor. In each window, a ratio of color intensity between the inside and outside of the tumor and a gradient of color intensity were calculated in the blue and luminance channels (Bratio, Vratio, Bgrad, Vgrad), respectively. These were averaged over eight equiangular regions. We calculated four features for each of the eight window sizes (L): 1/5, 1/10, 1/15, 1/20, 1/25, 1/30, 1/35, and 1/40 of the length of the major axis of the dermoscopy image.
As for the texture features, a total of 176 parameters were calculated. We prepared 11 different-sized co-occurrence matrices with distance valuedranging from 1/2 to 1/64 of the length of the major axis of the dermoscopy image. On the basis of each co-occurrence, the matrix, energy, moment, entropy, and correlation (corr) were calculated in four directions (0, 45, 90, and 135 degrees). These 428 image features were transformed into N(0,1) (zero mean and unit variance) and then orthogonalized using PCA.
Feature selection
From these orthogonalized features (¼PCs), the parameters used in each classifier and detector were selected by an incremental stepwise method with a hypothesis test of Wilk’s lambda (Everitt and Dunn, 1991). This method searches appropriate input parameters one after the other according to the statistical rule. In each step, a statistical F-test is performed and the parameter with the highest partial correlation efficient under Po0.05 is selected. During this selection step, inefficient (statistically negligible;
P40.10) parameters are rejected from already selected parameters, if they exist. For each classifier and detector, this process was repeated until no further input satisfied the above-mentioned criteria.
Evaluation criteria
For melanoma–nevus classifier and three pattern detectors, the following evaluation criteria were used.
First, we calculated the standard deviation of mean estimated error (E) and a determination coefficient adjusted by degree of freedom (R2) between the training signal and the developed linear
model to evaluate the fitness of the developed classifier. Next, we evaluated the performance of the built classifiers using leave-one-out cross-validation, 10-fold cross-validation, and half-and-half tests, which split all data into training and evaluation in halves, and the performance was evaluated by averaging both combinations. Note that feature selection was performed using only the training set in each combination.
We used SE and SP measures and also plotted the ROC curve. In addition, positive predictive value and negative predictive value measures were also calculated. On the basis of the ROC curve, AUC was calculated. The AUC ranges from 0 to 1 and the greater its value the higher is the classification accuracy.
Analysis and evaluation tools
The PCA and evaluation of linear classifiers were performed using Matlab 13 with statistical toolbox software (MathWorks Inc., Natick, MA). The incremental stepwise input selection was performed using SPSS 14 software (SPSS Inc., Chicago, IL).
CONFLICT OF INTEREST
The authors state no conflict of interest.
ACKNOWLEDGMENTS
We appreciate Dr Toru Wakahara at Hosei University, who advises us on image processing. This research was supported in part by the Ministry of Education, Science, Sports and Culture, Grant-in-Aid for Young Scientists (B), 17790788, 2005–2006.
REFERENCES
Argenziano G, Soyer HP, Chimenti S, Talamini R, Corona R, Sera Fet al. (2003) Dermoscopy of pigmented skin lesions: results of a consensus meeting via the internet.J Am Acad Dermatol48:679–93
Argenziano G, Soyer HP, De Giorgi V, Piccolo D, Carli P, Delfino Met al. (2000) Interactive atlas of dermoscopy CD. Milan: EDRA Medical Publishing and New Media
Blum A, Luedtke H, Ellwanger U, Schwabe R, Rassner G, Garbe C (2004) Digital image analysis for diagnosis of cutaneous melanoma. Develop-ment of a highly effective computer algorithm based on analysis of 837 melanocytic lesions.Br J Dermatol151:1029–38
Burroni M, Sbano P, Cevenini G, Risulo M, Dell’Eva G, Barbini Pet al.(2005) Dysplastic naevus vs.in situmelanoma: digital dermoscopy analyses. Br J Dermatol152:679–84
Celebi ME, Kingravi HA, Uddin B, Iyatomi H, Aslandogan YA, Stoecker WV et al. (2007) A methodological approach to the classification of dermoscopy images.Comput Med Imaging Graph31:362–73 Elbaum M, Kopf AW, Rabinovitz HS, Langley RG, Kamino H, Mihm MC Jr
et al.(2001) Automatic differentiation of melanoma from melanocytic nevi with multispectral digital dermoscopy: a feasibility study.J Am Acad Dermatol44:207–18
Ercal F, Chawla A, Stoecker WV, Lee HC, Moss RH (1994) Neural network diagnosis of malignant melanoma from color images.IEEE Trans Biomed Eng41:837–45
Everitt BS, Dunn G (1991)Applied multivariate data analysis. London: Edward Arnold, 219–20
Ganster H, Pinz A, Roehrer R, Wilding E, Binder M, Kitter H (2001) Automated melanoma recognition.IEEE Trans Med Imaging20:233–9 Hoffmann K, Gambichler T, Rick A, Kreutz M, Anschuetz M, Grunendick T
et al.(2003) Diagnostic and neural analysis of skin cancer (DANAOS). A multicentre study for collection and computer-aided analysis of data from pigmented skin lesions using digital dermoscopy.Br J Dermatol 149:801–9
Iyatomi H, Oka H, Masataka S, Miyake A, Kimoto M, Yamagami Jet al.(2006) Quantitative assessment of tumour area extraction from dermoscopy
images and evaluation of the computer-based methods for automatic melanoma diagnostic system.Melanoma Res16:183–90
Oka H, Hashimoto M, Iyatomi H, Tanaka M (2004) Internet-based program for automatic discrimination of dermoscopic images between melanoma and Clark nevi.Br J Dermatol150:1041
Rubegni P, Cevenini G, Burroni M, Perotti R, Dell0Eva G, Sbano Pet al.(2002)
Automated diagnosis of pigmented skin lesions.Int J Cancer101:576–80 Saida T, Miyazaki A, Oguchi S, Ishihara Y, Yamazaki Y, Murase Set al.(2004) Significance of dermoscopic patterns in detecting malignant melanoma on acral volar skin.Arch Dermatol140:1233–8
Saida T, Oguchi S, Miyazaki A (2002) Dermoscopy for acral pigmented skin lesions.Clin Dermatol20:279–85
Seidenari S, Pellacani G, Pepe P (1998) Digital videomicroscopy improves diagnostic accuracy for melanoma.J Am Acad Dermatol39:175–81