ISSN 1607148-4 9 7 7 1 6 0 7 1 4 8 0 0 6
O C C A S I O N A L PA P E R S E R I E S
N O 6 9 / A U G U S T 2 0 0 7
FISCAL POLICY
IN MEDITERRANEAN
COUNTRIES
DEVELOPMENTS,
STRUCTURES AND
IMPLICATIONS FOR
MONETARY POLICY
by Michael Sturm and
François Gurtner
O C C A S I O N A L PA P E R S E R I E S
N O 6 9 / A U G U S T 2 0 0 7
This paper can be downloaded without charge from http://www.ecb.int or from the Social Science Research Network electronic library at http://ssrn.com/abstract_id=977360.
FISCAL POLICY IN
MEDITERRANEAN COUNTRIES
DEVELOPMENTS, STRUCTURES
AND IMPLICATIONS
FOR MONETARY POLICY
1
by Michael Sturm and
François Gurtner
In 2007 all ECB publications feature a motif taken from the €20 banknote.
1 The paper was prepared for the High-Level Eurosystem Seminar with Mediterranean countries’ central banks held on 28 March 2007 in Valencia. It has benefited from comments by an anonymous referee as well as from participants at the workshop of Eurosystem and
© European Central Bank, 2007 Address Kaiserstrasse 29 60311 Frankfurt am Main Germany Postal address Postfach 16 03 19 60066 Frankfurt am Main Germany Telephone +49 69 1344 0 Website http://www.ecb.int Fax +49 69 1344 6000 Telex 411 144 ecb d
All rights reserved. Any reproduction, publication or reprint in the form of a different publication, whether printed or produced electronically, in whole or in part, is permitted only with the explicit written authorisation of the ECB or the author(s).
The views expressed in this paper do not necessarily reflect those of the European Central Bank.
ISSN 1607-1484 (print) ISSN 1725-6534 (online)
CONTENTS
C O N T E N T S ABSTRACT 4
1 INTRODUCTION 5
2 DEVELOPMENT OF KEY FISCAL INDICATORS:
A LONG-TERM VIEW 6
2.1 General government
balance-to-GDP ratio 6
2.2 Public debt-to-GDP ratio 7 2.3 Public expenditure-to-GDP ratio 9 2.4 Public revenue-to-GDP ratio 10 2.5 Fiscal transparency and data
quality 13
3 CURRENT BUDGETARY STRUCTURES OF MEDITERRANEAN COUNTRIES 14 3.1 Revenue structure 14 3.2 Expenditure structure 20 3.3 Challenges concerning the
structure of budgets 23
4 KEY FISCAL POLICY CHALLENGES IN MEDITERRANEAN COUNTRIES AND
IMPLICATIONS FOR MONETARY POLICY 25 4.1 Fiscal policy and macroeconomic
stability 25 4.1.1Non-oil-producing countries:
vulnerabilities resulting from high deficits and debt 25 4.1.2 Oil-producing countries:
vulnerabilities resulting from dependence on
hydrocarbon revenue 31 4.2 Implications of specific revenue
and expenditure features for
monetary policy 32 4.3 The role of fiscal rules 33
5 CONCLUSIONS 36
ANNEX
Summary of key fiscal characteristics and challenges in Mediterranean
countries – A country-by-country view 38
BIBLIOGRAPHY 41
BOXES:
Box 1: Fiscal policy challenges in oil-producing countries 17 Box 2: West Bank and Gaza budget
structure 21
Box 3: The structure of public debt in Mediterranean countries 26 Box 4: Fiscal dominance of monetary
policy: the case of Turkey 30
EUROPEAN CENTRAL BANK
ABSTRACT
Southern and eastern Mediterranean countries have many fiscal challenges in common with other emerging market and mature economies concerning deficit and debt reduction and the maintenance of fiscal discipline. However, most countries in the region also face some specific fiscal issues, such as relatively high public debt, dependence on some form or another of donor dependence or concessional financing, high budgetary exposure to fluctuations in hydrocarbon prices, high defence expenditure and weak tax bases. Against this background, this paper reviews fiscal developments and fiscal policy issues in the ten countries that are participants or observers in the EU’s Barcelona process. The main focus is on the implications of these developments and issues for macroeconomic stability, given that countries in the region have made considerable progress in terms of macroeconomic stabilisation over the last two decades, which is reflected in particular in lower inflation rates. The analysis distinguishes between non-oil-producing and oil-producing countries in the region, as they exhibit different fiscal features and are confronted with different challenges. In the case of non-oil-producing countries, the key challenges stem from high deficits and debt levels, including implicit and contingent liabilities, notwithstanding some progress in fiscal consolidation in most of these countries over the last years. In the case of oil-producing countries, whose fiscal situation has significantly improved in recent years in the wake of high oil prices, the key challenges for fiscal management stem from the heavy reliance on an exhaustible source of revenues and a large exposure to fluctuations in international hydrocarbon prices. A shock originating from – or being transmitted via and exacerbated by – the fiscal sector appears to be the single most important macroeconomic risk in many countries.
1 I N T R O D U C T I O N I INTRODUCTION
This paper reviews fiscal developments and fiscal policy issues in Mediterranean countries.1
Fiscal policy is a crucial factor in determining a country’s overall economic performance via its effects on allocation, stabilisation and distribution, and constitutes a key component of macroeconomic policies alongside monetary and exchange rate policy. There are at least two reasons why fiscal developments are of great relevance for central banks: (i) governments may resort to the central bank for the financing of public deficits rather than borrowing in capital markets. This is more likely the less developed the domestic capital markets, the more severe the impediments and disruptions in accessing international capital markets and the less independent central banks are, and thus appears particularly relevant for developing and emerging market economies; (ii) even in the absence of monetary financing, fiscal policy can have a large impact on the economy via its effects on interest rates, the exchange rate and aggregate demand, as well as on expectations, in particular as regards the sustainability of public debt. Perceptions of the sustainability of fiscal policy can have an impact on financial markets and, if they are negative, can interfere with the objectives of monetary and exchange rate policy, such as achieving and preserving price stability, financial stability or maintaining an exchange rate peg. In the extreme case, fiscal dominance of monetary policy can lead to a situation in which the central bank is no longer able to effectively use its instruments in order to achieve its objectives.
As a result, central banks in advanced and emerging market economies closely monitor fiscal developments. In many cases, they also publicly voice their opinion on fiscal policy issues even if these issues are not directly in the realm of central banking activities. Mediterranean economies have many features in common with other emerging market economies, such as a high exposure to real economy and financial shocks and susceptibility to financing constraints, but also exhibit a
1 Algeria, Egypt, Israel, Jordan, Lebanon, Libya, Morocco, Syria, Tunisia, and the West Bank and Gaza. These are the participants or observers (Libya) in the EU’s Barcelona process.
number of specific fiscal issues and challenges. Although Mediterranean economies appear largely heterogeneous, including on fiscal issues, some challenges are common to most of the countries in this region. These include relatively high public debt, dependence on some form or another of donor support or concessional financing, high defence expenditure and weak tax bases. In addition, in most countries there is room to improve public finance management in order to achieve better fiscal outcomes. Notwithstanding progress in many countries, fiscal vulnerabilities appear as key risks to maintaining macroeconomic and financial stability in the region, and create a challenging environment for central banks. Against this background, the role of fiscal policy in Mediterranean countries’ macroeconomic frameworks was discussed at the fourth High-Level Eurosystem Seminar with Mediterranean countries’ central banks on 28 March 2007 in Valencia, Spain, for which an earlier version of this paper was prepared.
The paper is structured as follows: Section 2 reviews developments in key fiscal indicators in Mediterranean countries from a long-term perspective. Section 3 examines the structure of the budget on the revenue and the expenditure side and identifies the main features. Section 4 highlights important fiscal policy issues and their implications for monetary and exchange rate policy. Section 5 concludes. While the paper takes a horizontal view of fiscal issues across the region, a summary of key fiscal characteristics and challenges on a country-by-country basis is given in the Annex.
2 DEVELOPMENT OF KEY FISCAL INDICATORS: A LONG-TERM VIEW
In order to assess Mediterranean countries’ current fiscal policy issues and challenges, it is useful to look at the longer-term developments in key fiscal indicators, so as to put them into perspective. To this end, this section reviews the development of government balances, debt, expenditure and revenue (all as a percentage of GDP) over the past two decades. It compares developments in Mediterranean countries with those in ten new EU Member States,2 in EU
candidate and potential candidate countries3
and in developing countries.4 While any
benchmark is to some extent imperfect and subject to many caveats, comparing Mediterranean countries with new EU Member States and EU candidate and potential candidate countries is relevant as these countries are geographically close to the euro area and are often seen as competing for financial flows and FDI from the euro area. In addition, like the new EU Member States and EU candidate and potential candidate countries, Mediterranean countries have a history of state intervention in the economy.5 Developing countries as a whole
constitute a broader benchmark, and comprise many economies with income levels comparable to Mediterranean countries.
The review of fiscal developments in this section distinguishes between oil-producing countries in the Mediterranean region – Algeria, Libya and to a lesser extent Syria – and non-oil-producing countries – the other seven countries under review –, given that hydrocarbon (oil and gas) revenue is an important feature of fiscal developments.6
2.1 GENERAL GOVERNMENT BALANCE-TO-GDP RATIO
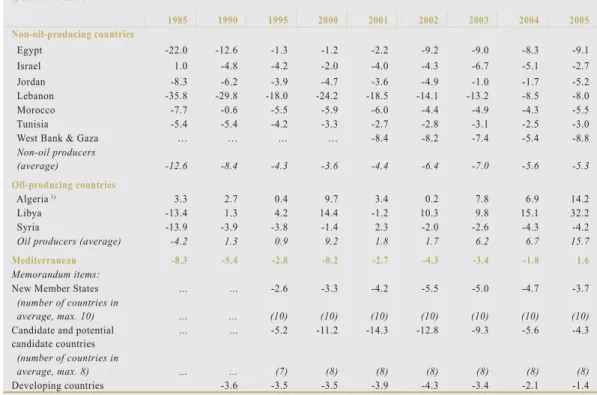
The general government balance-to-GDP ratio of Mediterranean countries has on average improved from a long-term perspective (see Chart 1), although many countries continue to exhibit large deficits, in particular the non-oil-producing countries of the region (see Table 1).
The budget balance of the oil-producing countries has generally been in surplus since the beginning of this decade, with the exception of Syria. Deficits in the region were even more sizeable up to the early 1990s, when several countries embarked on a path of macroeconomic stabilisation, reducing both inflation and budget deficits, which often were at the root of inflationary pressures. The reduction of budget deficits was supported by higher real GDP growth in many countries in the first half of the 1990s as compared with the late 1980s.7
The shift of the early 1990s is also reflected in improving primary balances. Most Mediterranean countries have run primary surpluses in most of the years since the early 1990s, in contrast to new EU Member States for example. After the deterioration observed in 2001 and 2002 – mainly reflecting a worsening of budget balances in oil-producing countries in view of lower oil prices and the recession in Israel in the context of the second intifada – overall deficits tended to decline.
The recent improvement is mainly explained by positive developments in the region’s
oil-2 Countries which joined the EU in oil-2004: Cyprus, Czech Republic, Estonia, Hungary, Latvia, Lithuania, Malta, Poland, Slovakia and Slovenia. As most of these countries are transition economies, a comparison of data is only meaningful after the beginning of transition, i.e. from the early 1990s onwards. 3 Albania, Bosnia-Herzegovina, Bulgaria, Croatia, FYR
Macedonia, Romania, Serbia-Montenegro and Turkey (Bulgaria and Romania joined the EU in 2007). As with the new EU Member States, a meaningful comparison of data is only possible for the period after 1990. Due to the small size of most countries, the weighted average of this group is heavily influenced by fiscal developments in Turkey.
4 This group comprises “Other emerging market and developing countries” as classified in the IMF World Economic Outlook (WEO). These comprise 146 countries, i.e. all IMF members except those 29 countries classified as advanced economies. Data for this group as a whole can only be traced back to 1990, and data on public debt are not available.
5 While none of the Mediterranean countries was a fully-fledged centrally planned economy, many were characterised by a high degree of state intervention, public ownership of enterprises, underdeveloped private sectors and little reliance on market mechanisms.
6 Egypt also produces oil and gas and has relied on hydrocarbon revenues, but the importance of hydrocarbons for the budget, exports and GDP is comparatively smaller. Thus, it is grouped in this paper as a non-oil-producing country.
7 Average real GDP growth for nine of the ten countries under review (excluding the West Bank and Gaza) was 1.9% on average p.a. in the years 1986-90, while it stood at 3.9% in the period 1991-95.
producing countries, most notably in Algeria and Libya, which have accumulated large fiscal surpluses in the wake of higher oil prices.8 This
also explains why the fiscal balance for Mediterranean countries as a group currently looks more favourable than the one of new EU Member States, EU candidate and potential candidate countries and developing countries. Some non-oil-producing Mediterranean countries were also able to reduce deficits through consolidation efforts, supported by relatively strong global and regional growth. Nevertheless, in many countries fiscal deficits remain persistently high, in particular in Egypt and Lebanon, pointing to the pressing need for more active fiscal consolidation efforts. Furthermore, the official deficit figures include foreign grants and the budgetary situation of several Eastern Mediterranean countries would be even more precarious without the different forms of donor support. In some cases, donor support has amounted to around 10% of GDP over the last years.
Overall, cyclical developments – in terms of real GDP growth and in the case of oil producers oil prices – have played a prominent role in Mediterranean countries’ fiscal balances. However, the fact that substantial overall
deficits persist in many countries even in view of relatively robust global and regional growth of recent years points to underlying fiscal problems. Thus fiscal imbalances do not seem to be just a symptom of broader economic problems, e.g. a weakness of economic growth, even though the growth performance of Mediterranean countries over the past decades is inferior to that of other emerging market economies, for example in Asia.
2.2 PUBLIC DEBT-TO-GDP RATIO
While public debt-to-GDP ratios have somewhat declined, on average, since 19909 (see Chart 2),
many countries remain highly indebted, which creates significant vulnerabilities (see Table 2). Public debt continuously declined in oil-producing countries over the last years;
8 Notwithstanding significant fiscal surpluses, Algeria and Libya exhibit large non-oil deficit/non-oil GDP ratios, which are a better indicator of the fiscal stance in oil-producing countries than the overall budget balance-to-GDP ratio (see also Sub-section 4.3). Algeria’s non-oil deficit/non-oil GDP ratio increased from 27.7% in 2003 to 35.3% in 2005, while that of Libya rose from 80.3% to 118.4% over the same period, pointing to expansionary fiscal policies in the two countries over recent years. The comparable ratio in Syria is lower at 15.3% (2005) and has declined since 2003. (Data from IMF Article IV reports.)
9 For earlier years, sufficient country data are not available. Chart 1 General government balance
(percent of GDP)
Source: IMF and ECB calculations.
Note: Number of countries included in the average may vary according to data availability.
Chart 2 General government gross debt
(percent of GDP)
Source: IMF and ECB calculations.
Note: Number of countries included in the average may vary according to data availability.
-16 -14 -12 -10 -8 -6 -4 -2 0 2 4 -16 -14 -12 -10 -8 -6 -4 -2 0 2 4 Mediterranean
new Member States
candidate and potential candidate countries developing countries 1985 1986 1987 1988 1989 1990 1991 1992 1993 1994 1995 1996 1997 1998 1999 2000 2001 2002 2003 2004 2005 0 20 40 60 80 100 120 0 20 40 60 80 100 120 Mediterranean
new Member States
candidate and potential candidate countries
1990 1991 1992 1993 1994 1995 1996 1997 1998 1999 2000 2001 2002 2003 2004 2005
2 DEVELOPMENT OF KEY FISCAL
INDICATORS: A LONG-TERM VIEW
however, on average it remains close to 100% of GDP in non-oil-producing countries. The public debt of Mediterranean countries is higher than in new EU Member States and EU candidate and potential candidate countries, reflecting fiscal profligacy over an extended period of time as well as external shocks. The decline of public debt in several countries, in particular in the early 1990s, is the result of both debt rescheduling (inter alia in the framework of the Paris Club) and macroeconomic stabilisation programmes. At present, three countries – Egypt, Israel and Lebanon – have debt-to-GDP ratios above or around 100%, while Jordan and Morocco also have debt levels well above 60% of GDP. Lebanon faces a particularly challenging situation, as public debt is not only very high at 175% of GDP, but has also steadily increased in recent years. By contrast, the region’s major oil-producing countries, Algeria and Libya,
Table 1 General government balance (percent of GDP) 1985 1990 1995 2000 2001 2002 2003 2004 2005 Non-oil-producing countries Egypt -22.0 -12.6 -1.3 -1.2 -2.2 -9.2 -9.0 -8.3 -9.1 Israel 1.0 -4.8 -4.2 -2.0 -4.0 -4.3 -6.7 -5.1 -2.7 Jordan -8.3 -6.2 -3.9 -4.7 -3.6 -4.9 -1.0 -1.7 -5.2 Lebanon -35.8 -29.8 -18.0 -24.2 -18.5 -14.1 -13.2 -8.5 -8.0 Morocco -7.7 -0.6 -5.5 -5.9 -6.0 -4.4 -4.9 -4.3 -5.5 Tunisia -5.4 -5.4 -4.2 -3.3 -2.7 -2.8 -3.1 -2.5 -3.0
West Bank & Gaza … … … … -8.4 -8.2 -7.4 -5.4 -8.8
Non-oil producers (average) -12.6 -8.4 -4.3 -3.6 -4.4 -6.4 -7.0 -5.6 -5.3 Oil-producing countries Algeria 1) 3.3 2.7 0.4 9.7 3.4 0.2 7.8 6.9 14.2 Libya -13.4 1.3 4.2 14.4 -1.2 10.3 9.8 15.1 32.2 Syria -13.9 -3.9 -3.8 -1.4 2.3 -2.0 -2.6 -4.3 -4.2
Oil producers (average) -4.2 1.3 0.9 9.2 1.8 1.7 6.2 6.7 15.7
Mediterranean -8.3 -5.4 -2.8 -0.2 -2.7 -4.3 -3.4 -1.8 1.6
Memorandum items:
New Member States ... ... -2.6 -3.3 -4.2 -5.5 -5.0 -4.7 -3.7
(number of countries in
average, max. 10) ... ... (10) (10) (10) (10) (10) (10) (10)
Candidate and potential candidate countries ... ... -5.2 -11.2 -14.3 -12.8 -9.3 -5.6 -4.3 (number of countries in average, max. 8) ... ... (7) (8) (8) (8) (8) (8) (8) Developing countries -3.6 -3.5 -3.5 -3.9 -4.3 -3.4 -2.1 -1.4 Source: IMF.
Notes: Averages weighted by nominal GDP in US dollars; due to data comparability problems, West Bank & Gaza is not included in the average.
1) Central government.
have used part of the windfall profits resulting from high oil prices to repay public debt, which now appears very low. They are the only countries of the region for which public indebtedness is no longer a major issue.
The structure of public debt differs among Mediterranean countries. The vulnerability resulting from high debt, for example in Egypt and Israel, is somewhat mitigated by the fact that a large part of debt is domestic, long-term and partially non-tradable, while some countries have a significant external debt or debt with shorter maturities.10 As a result of relatively
high public debt, interest expenditure is a significant burden for most Mediterranean countries’ budgets. Interest expenditure makes up around 4% of GDP on average, down from
Table 2 General government gross debt (percent of GDP) 1990 1995 2000 2001 2002 2003 2004 2005 Non-oil-producing countries Egypt 100.0 60.3 75.4 83.2 97.7 111.4 109.9 112.5 Israel 134.7 104.5 87.0 92.1 99.8 102.3 100.9 97.0 Jordan 1) 212.2 114.9 90.9 94.9 97.0 97.7 88.5 82.3 Lebanon 98.4 78.5 151.1 165.9 166.4 167.8 164.7 174.6 Morocco 89.1 90.6 80.8 74.7 71.3 68.9 65.8 70.5 Tunisia … 58.5 60.7 62.7 61.5 61.0 57.6 56.9
West Bank & Gaza … … … …
Non-oil producers (average) 111.8 85.8 84.4 89.6 97.0 100.6 97.5 98.0 Oil-producing countries Algeria 2) … 116.2 69.4 63.0 53.5 43.8 36.6 28.5 Libya 77.8 79.4 48.0 46.2 33.7 27.4 1.6 1.2 Syria 73.7 71.1 59.3 60.2 60.1 61.9 57.0 60.2
Oil producers (average) 76.6 95.1 60.6 57.4 51.1 43.9 32.6 26.9
Mediterranean 105.2 88.5 78.1 81.1 85.0 84.9 77.5 74.5
Memorandum items:
New Member States ... 42.7 35.5 36.2 38.8 41.8 41.5 41.8
(number of countries in
average, max. 10) ... (7) (9) (9) (9) (9) (9) (9)
Candidate and potential candidate countries
... 43.5 60.7 81.7 73.8 66.5 62.2 57.4
(number of countries in
average, max. 8) ... (3) (6) (6) (6) (6) (6) (6)
Source: IMF.
Note: Averages weighted by nominal GDP in US dollars. 1) Net debt.
2) Central government.
above 6% before 1990. However, in highly indebted Lebanon, it still accounts for 10% of GDP despite the relief brought about by several rounds of international donor assistance.
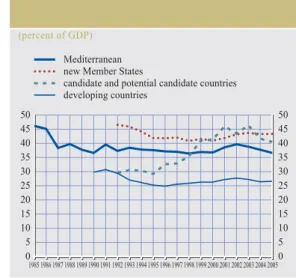
2.3 PUBLIC EXPENDITURE-TO-GDP RATIO
Public expenditure is relatively high in Mediterranean countries, although somewhat lower than in the late 1980s (see Chart 3). At 36-40% of GDP in the aggregate over the last years, the level of expenditure seems comparable to those of new EU Member States and EU candidate and potential candidate countries. The latter have relatively high public spending reflecting the legacy of the socialist past, for example in the form of a large public service. Public expenditure in non-oil-producing countries of the region, at around 40% of GDP, is significantly higher than in oil-producing countries (around 30% of GDP). The average
figures are driven up by two outliers, Israel and Libya, where public expenditure stands at around 50% and 40% of GDP, respectively (see Table 3). In most other countries, public expenditure accounts for 30% to 35% of GDP. However, even this level is well above the average for developing countries, where public expenditure accounts for slightly more than 25% of GDP.
Factors contributing to high expenditure levels are inter alia defence outlays (in Eastern Mediterranean countries) reflecting political tensions in the region, interest expenditure stemming from high debt (which partly explains the higher level of expenditure in non-producing countries compared with oil-producing countries), energy subsidies, and expenditure on wages and salaries, partly attributable to attempts by governments to address high unemployment by job creation in
2 DEVELOPMENT OF KEY FISCAL
INDICATORS: A LONG-TERM VIEW
the public sector.11 The large government
sectors in Mediterranean (and other Middle Eastern) countries have repeatedly been identified as one of the factors explaining the disappointing growth performance of the region as compared with other emerging market economies.12
2.4 PUBLIC REVENUE-TO-GDP RATIO
Public revenue as a percentage of GDP has been broadly stable at around 35% over the last decades. The most recent increase to close to 40% mainly reflects higher hydrocarbon revenue in oil-producing countries (Algeria and Libya and to a lesser extent Syria). For these
Table 3 General government expenditure (percent of GDP) 1985 1990 1995 2000 2001 2002 2003 2004 2005 Non-oil-producing countries Egypt 56.8 32.9 28.6 29.9 30.4 34.6 35.2 33.8 33.9 Israel 67.7 57.5 54.4 50.2 52.7 54.1 53.0 51.2 49.1 Jordan 37.3 42.9 38.3 34.7 33.9 34.5 35.8 38.4 38.2 Lebanon 53.9 39.4 35.2 43.5 36.7 35.1 35.2 31.3 30.2 Morocco 30.3 27.5 29.5 32.1 31.1 29.4 29.6 29.9 33.1 Tunisia 38.8 36.8 34.4 32.7 32.5 33.1 32.8 32.5 32.9
West Bank & Gaza … … … … 29.9 32.4 35.6 37.4 42.4
Non-oil producers (average) 54.0 39.9 40.7 39.5 40.1 41.4 41.1 39.9 39.5 Oil-producing countries Algeria 1) 34.0 26.2 29.5 28.6 31.3 35.0 29.2 29.3 26.9 Libya 47.5 35.1 30.2 31.3 44.3 41.2 44.6 44.0 41.6 Syria 41.2 28.3 29.8 27.4 28.0 28.5 31.4 31.9 30.7
Oil producers (average) 38.8 29.4 29.8 29.3 34.5 34.8 32.8 32.9 31.1
Mediterranean 46.1 36.6 37.6 36.7 38.6 39.7 38.8 37.7 36.6
Memorandum items:
New Member States ... ... 41.9 40.9 41.9 43.2 43.7 43.3 43.3
(number of countries in
average, max. 10) ... ... (10) (10) (10) (10) (10) (10) (10)
Candidate and potential candidate countries ... ... 29.2 41.4 46.0 43.4 46.3 41.6 40.5 (number of countries in average, max. 8) ... ... (7) (7) (7) (7) (7) (7) (7) Developing countries ... 29.8 25.2 26.3 27.2 27.7 27.2 26.4 26.6 Source: IMF.
Notes: Averages weighted by nominal GDP in US dollars; due to data comparability problems, West Bank & Gaza is not included in the average. Includes net lending (lending minus repayment for purposes of public policy).
1) Central government.
11 See Section 3 for a more detailed analysis of public expenditure and revenue.
12 See for example Abed and Davoodi (2003) and Hakura (2004). Chart 3 General government expenditure
(percent of GDP)
Source: IMF and ECB calculations.
Notes: Number of countries included in the average may vary according to data availability. Includes net lending (lending minus repayment for purposes of public policy).
0 5 10 15 20 25 30 35 40 45 50 0 5 10 15 20 25 30 35 40 45 50 Mediterranean
new Member States
candidate and potential candidate countries developing countries
Table 4 General government revenue (percent of GDP) 1985 1990 1995 2000 2001 2002 2003 2004 2005 Non-oil-producing countries Egypt 34.8 20.3 27.3 28.7 28.2 25.4 26.2 25.6 24.8 Israel 68.7 52.7 50.2 48.3 48.8 49.8 46.3 46.1 46.4 Jordan 29.0 36.7 34.4 30.0 30.3 29.6 34.7 36.7 33.0 Lebanon 18.1 9.7 17.2 19.3 18.2 21.0 22.0 22.8 22.3 Morocco 22.6 26.9 24.0 26.2 25.1 25.0 24.7 25.6 27.6 Tunisia 33.4 31.4 30.2 29.4 29.8 30.3 29.7 30.0 29.9
West Bank & Gaza … … … … 7.3 9.4 21.0 23.4 25.7
Non-oil producers (average) 41.4 31.1 33.2 33.4 33.2 32.3 31.9 31.9 31.6
Oil-producing countries
Algeria 1) 37.2 28.9 30.0 38.3 34.7 35.3 37.0 36.2 41.1
Libya 34.0 36.5 34.4 45.7 43.1 51.4 54.4 59.1 73.9
Syria 27.3 24.3 25.9 26.0 30.3 26.5 28.8 27.6 26.5
Oil producers (average) 34.5 29.9 30.3 37.8 36.0 37.6 39.8 40.3 46.6
Mediterranean 37.9 31.2 34.8 36.6 35.8 35.4 35.5 35.9 38.3
Memorandum items:
New Member States ... ... 39.3 37.7 37.7 37.7 38.7 38.5 39.7
(number of countries in
average, max. 10) ... ... (10) (10) (10) (10) (10) (10) (10)
Candidate and potential candidate countries ... ... 24.1 29.8 31.1 30.2 36.7 35.8 36.0 (number of countries in average, max. 8) ... ... (7) (7) (7) (7) (7) (7) (7) Developing countries ... 26.2 21.7 22.8 23.3 23.4 23.8 24.3 25.2 Source: IMF.
Notes: Averages weighted by nominal GDP in US dollars; due to data comparability problems, West Bank & Gaza is not included in the average. Includes grants from abroad.
1) Central government.
countries hydrocarbon revenues are by far the most important source of income, which distinguishes their budgetary structure and fiscal developments from other Mediterranean countries (Section 3). In non-oil-producing countries, public revenue as a percentage of GDP is lower and relatively stable at 31-34%. The level of total revenue broadly mirrors public expenditure, and is thus similar to levels prevailing in new EU Member States and EU candidate and potential candidate countries, but higher than in developing countries (see Chart 4). As with expenditure, Israel and Libya appear as outliers, with 46% and 70% revenue-to-GDP ratios respectively. This reflects high public expenditure and the existence of a developed tax system in Israel and high oil revenues in a non-diversified economy in the case of Libya. For most other countries the
Chart 4 General government revenue
(percent of GDP)
Source: IMF and ECB calculations.
Notes: Number of countries included in the average may vary according to data availability. Includes grants from abroad.
Mediterranean new Member States
candidate and potential candidate countries developing countries 1985 1986 1987 1988 1989 1990 1991 1992 1993 1994 1995 1996 1997 1998 1999 2000 2001 2002 2003 2004 2005 0 5 10 15 20 25 30 35 40 45 0 5 10 15 20 25 30 35 40 45 2 DEVELOPMENT OF KEY FISCAL INDICATORS: A LONG-TERM VIEW
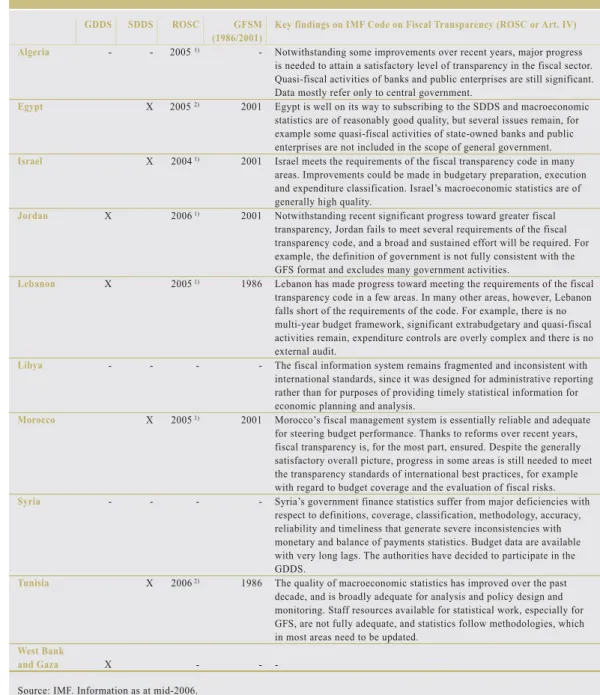
Table 5 Compliance with fiscal standards and data transparency
GDDS SDDS ROSC GFSM
(1986/2001)
Key findings on IMF Code on Fiscal Transparency (ROSC or Art. IV) Algeria - - 2005 1) - Notwithstanding some improvements over recent years, major progress
is needed to attain a satisfactory level of transparency in the fiscal sector. Quasi-fiscal activities of banks and public enterprises are still significant. Data mostly refer only to central government.
Egypt X 2005 2) 2001 Egypt is well on its way to subscribing to the SDDS and macroeconomic statistics are of reasonably good quality, but several issues remain, for example some quasi-fiscal activities of state-owned banks and public enterprises are not included in the scope of general government. Israel X 2004 1) 2001 Israel meets the requirements of the fiscal transparency code in many
areas. Improvements could be made in budgetary preparation, execution and expenditure classification. Israel’s macroeconomic statistics are of generally high quality.
Jordan X 2006 1) 2001 Notwithstanding recent significant progress toward greater fiscal transparency, Jordan fails to meet several requirements of the fiscal transparency code, and a broad and sustained effort will be required. For example, the definition of government is not fully consistent with the GFS format and excludes many government activities.
Lebanon X 2005 1) 1986 Lebanon has made progress toward meeting the requirements of the fiscal transparency code in a few areas. In many other areas, however, Lebanon falls short of the requirements of the code. For example, there is no multi-year budget framework, significant extrabudgetary and quasi-fiscal activities remain, expenditure controls are overly complex and there is no external audit.
Libya - - - - The fiscal information system remains fragmented and inconsistent with international standards, since it was designed for administrative reporting rather than for purposes of providing timely statistical information for economic planning and analysis.
Morocco X 2005 1) 2001 Morocco’s fiscal management system is essentially reliable and adequate for steering budget performance. Thanks to reforms over recent years, fiscal transparency is, for the most part, ensured. Despite the generally satisfactory overall picture, progress in some areas is still needed to meet the transparency standards of international best practices, for example with regard to budget coverage and the evaluation of fiscal risks. Syria - - - - Syria’s government finance statistics suffer from major deficiencies with
respect to definitions, coverage, classification, methodology, accuracy, reliability and timeliness that generate severe inconsistencies with monetary and balance of payments statistics. Budget data are available with very long lags. The authorities have decided to participate in the GDDS.
Tunisia X 2006 2) 1986 The quality of macroeconomic statistics has improved over the past decade, and is broadly adequate for analysis and policy design and monitoring. Staff resources available for statistical work, especially for GFS, are not fully adequate, and statistics follow methodologies, which in most areas need to be updated.
West Bank
and Gaza X - -
-Source: IMF. Information as at mid-2006.
GDDS: General Data Dissemination System; SDDS: Special Data Dissemination Standard; ROSC: Report on the Observance of Standards and Codes.
GFSM 1986: A Manual on Government Finance Statistics 1986; GFSM 2001: Government Finance Statistics Manual 2001; GFS: Government Finance Statistics.
1) ROSC Fiscal Transparency Module. 2) ROSC Data Module.
public revenue-to-GDP ratio stands at around 25-30% (see Table 4). Lebanon stands out as the country with the lowest revenue in the region, pointing to difficulties in generating
sufficient revenue to cover public expenditure, which is one of the reasons for the country’s high deficits over the last years and the accumulation of public debt.
2.5 FISCAL TRANSPARENCY AND DATA QUALITY A key issue to be taken into account when looking at fiscal data in the Mediterranean region is the relatively low compliance with fiscal standards and the unsatisfactory level of transparency (see Table 5). Notwithstanding improvements over recent years, in many countries the quality of fiscal (and other economic) statistics is not in line with international standards and does not allow for in-depth macroeconomic and fiscal analysis. For example, cyclically adjusted budget deficits to analyse the underlying fiscal stance are not available. In some countries, transparency is in particular hampered by limited statistical coverage of government activities, and thus implies the existence of significant quasi-fiscal activities and contingent liabilities. In general, the non-oil-producing countries in the region have better fiscal statistics than the oil producers. Only six countries, all of them non-oil-producing, comply with the IMF fiscal reporting framework – the Government Finance Statistics Manual (GFSM).13 Only four countries
comply with the Special Data Dissemination Standard (SDDS) and three with the (less demanding) General Data Dissemination System (GDDS). The contrast between oil- and non-oil-producing countries is again observable as Algeria, Libya and Syria comply neither with the SDDS nor with the GDDS. As regards fiscal transparency, most countries agreed that the IMF conducts a Report on the Observance of Standards and Codes (ROSC), which contains a fiscal module.
13 There are two versions of GFSM (1986 and 2001). The major difference is that reporting according to GFSM 1986 is cash-based, while GFSM 2001 shifts the emphasis to accrual accounting.
2 DEVELOPMENT OF KEY FISCAL
INDICATORS: A LONG-TERM VIEW
3 CURRENT BUDGETARY STRUCTURES OF MEDITERRANEAN COUNTRIES
As already apparent from the previous section, Mediterranean countries are heterogeneous as regards key fiscal indicators. An important distinguishing feature is hydrocarbon revenue, grouping the region into oil-producing countries, particularly Algeria and Libya and to a lesser extent Syria, and non-oil-producing countries. Among non-oil-producing countries, Israel and especially the West Bank and Gaza appear as outliers with specific fiscal features: the former because of its higher GDP per capita, the latter because it is not a sovereign state (see Box 2).
Against this background, this section provides a closer look at the structures both on the revenue and the expenditure side of Mediterranean countries’ budgets, and identifies
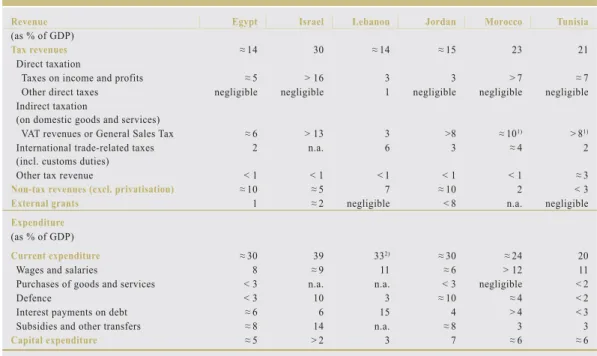
Table 6 Budgetary structure of non-oil-producing Mediterranean countries
Revenue Egypt Israel Lebanon Jordan Morocco Tunisia
(as % of GDP)
Tax revenues ≈ 14 30 ≈ 14 ≈ 15 23 21
Direct taxation
Taxes on income and profits ≈ 5 > 16 3 3 > 7 ≈ 7
Other direct taxes negligible negligible 1 negligible negligible negligible
Indirect taxation
(on domestic goodsand services)
VAT revenues or General Sales Tax ≈ 6 > 13 3 >8 ≈ 101) > 81)
International trade-related taxes (incl. customs duties)
2 n.a. 6 3 ≈4 2
Other tax revenue < 1 < 1 < 1 < 1 < 1 ≈ 3
Non-tax revenues (excl. privatisation) ≈ 10 ≈5 7 ≈ 10 2 < 3
External grants 1 ≈ 2 negligible < 8 n.a. negligible
Expenditure (as % of GDP)
Current expenditure ≈ 30 39 332) ≈ 30 ≈ 24 20
Wages and salaries 8 ≈9 11 ≈ 6 > 12 11
Purchases of goods and services < 3 n.a. n.a. < 3 negligible < 2
Defence < 3 10 3 ≈ 10 ≈4 < 2
Interest payments on debt ≈ 6 6 15 4 > 4 < 3
Subsidies and other transfers ≈ 8 14 n.a. ≈8 3 3
Capital expenditure ≈5 > 2 3 7 ≈6 ≈ 6
Sources: IMF and ECB staff calculations.
Notes: Data are averages for 2000-2004 or 2000-2005 (if 2005 included: preliminary estimate). Data for Egypt and Jordan refer to general government, for Israel, Lebanon, Morocco and Tunisia to central government. No data for West Bank and Gaza (see Box 2). 1) For Morocco and Tunisia the item VAT or General Sales Tax includes revenues from excise duties.
2) For Lebanon, data for subsidies and other transfers and purchases of goods and services are not available; they appear to be summarised in IMF data in the category “other current expenditure”, which makes up around 4% of GDP.
some key features and issues. A broad overview of budgetary structures in both non-oil-producing countries and oil-non-oil-producing countries as regards the key revenue and expenditure items as a share of GDP is provided in Tables 6 and 7.
3.1 REVENUE STRUCTURE
The revenue structure of oil-producing versus non-oil-producing countries differs significantly due to the importance of oil-related revenue in the budget of oil-producing countries. Starting the analysis with non-oil-producing countries, these are characterised in general by higher tax revenues than oil producers. Tax revenue as a share of total revenue is the highest in Morocco and Tunisia (90% for both) and the lowest in Jordan (less than 50%) due notably to Jordan’s heavy dependence on foreign grants (see Table 8). The contribution of direct taxation (on
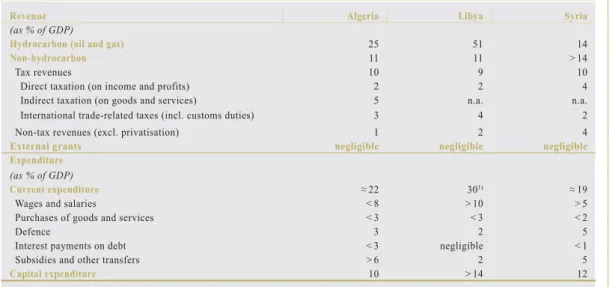
Table 7 Budgetary structure of oil-producing Mediterranean countries
Revenue Algeria Libya Syria
(as % of GDP)
Hydrocarbon (oil and gas) 25 51 14
Non-hydrocarbon 11 11 > 14
Tax revenues 10 9 10
Direct taxation (on income and profits) 2 2 4
Indirect taxation (on goods and services) 5 n.a. n.a.
International trade-related taxes (incl. customs duties) 3 4 2
Non-tax revenues (excl. privatisation) 1 2 4
External grants negligible negligible negligible
Expenditure (as % of GDP)
Current expenditure ≈ 22 301) ≈ 19
Wages and salaries < 8 > 10 > 5
Purchases of goods and services < 3 < 3 < 2
Defence 3 2 5
Interest payments on debt < 3 negligible < 1
Subsidies and other transfers > 6 2 5
Capital expenditure 10 > 14 12
Sources: IMF and ECB staff calculations.
Notes: Data are averages for 2000-2004 or 2000-2005 (if 2005 included: preliminary estimate). Data for Libya and Syria refer to general government, for Algeria to central government.
1) There is considerable uncertainty as regards the classification of current expenditure for Libya. Current expenditure is around 30% of GDP according to IMF data. The sum of the sub-items of current expenditure, however, is only around 17%, i.e. current expenditure of around 13% of GDP, classified as “administrative expenditure”, cannot be assigned to more detailed spending categories. Therefore, spending on wages and salaries, defence, and subsidies and transfers can be expected to be higher than shown in this table.
Table 8 Revenue structure of non-oil-producing countries (% of total revenue)
Egypt Israel Jordan Lebanon Morocco Tunisia
Tax 57 81 48 65 90 89 Direct 24 42 8 19 33 32 Indirect 24 36 28 26 40 40 Trade 6 n.a. 9 17 12 6 Other negligible 2 3 3 5 11 Non-tax 41 13 22 34 10 11
Grants 2 6 30 1 negligible negligible
Total 100 100 100 100 100 100
Source: IMF (2005 data, for Jordan 2004).
income and profit) to total revenue appears highly heterogeneous. It is highest in Israel (42%), which appears as an outlier in the region, and lowest in Jordan (8%). In general, the contribution of direct taxes to budgetary income is relatively low, reflecting inter alia problems with tax compliance and weaknesses in tax administration, as levying direct taxes tends to require more administrative capacity than
raising indirect taxes.14 14 See Crandall and Bodin (2005) on reforms of revenue administration in Middle Eastern countries.
Indirect taxes are a more important source of revenue than direct taxes (except for Israel), and the contribution of indirect taxation (VAT and excise duties) to total revenues is higher than in oil-producing countries. In particular VAT, which has been introduced in all Mediterranean countries except Libya and Syria
3 CURRENT BUDGETARY STRUCTURES OF MEDITERRANEAN COUNTRIES
Table 9 VAT revenue productivity in selected countries (2003) Standard rate (%) (1) VAT revenue (% of GDP) (2) Revenue productivity (3) = (2)/(1) Mediterranean countries 1) Algeria 2) 17 3.1 0.18 Egypt 10 2.5 0.25 Israel 2) 17 8.5 0.50 Jordan 16 8.5 0.53 Lebanon 10 3.8 0.38 Morocco 20 6.1 0.31 Tunisia 18 6.3 0.35
Selected euro area countries
France 19.6 7.0 0.36
Germany 16 6.3 0.39
Italy 20 7.5 0.38
Selected OECD countries
Australia 10 4.1 0.41
Canada 7 3.5 0.50
New Zealand 12.5 9.2 0.74
Sources: IMF, national sources and ECB staff calculations.
1) Libya and Syria do not have a VAT. West Bank and Gaza has a VAT but due to the specific features of collection it is not listed here (see Box 2).
2) Data refer to 2004.
over the past two decades, has become a relatively efficient revenue-raising instrument and a stable source of budgetary income. Nevertheless, the revenue-generating potential of VAT differs among countries, depending on specific VAT features. Revenue productivity, which can be measured by relating the standard VAT rate to revenue, tends to be higher in those countries in which VAT is relatively broad based with as few exemptions and reduced rates as possible (see Table 9).
The relative weight of taxes on foreign trade in total revenue also appears heterogeneous. It is highest at 17% in Lebanon, which seems to point to the country’s limited progress regarding trade liberalisation. Foreign trade taxes continue to provide a non-negligible share of revenue to the budget also in the other Mediterranean countries, in particular Morocco and Jordan. The share of this formerly important source of revenue is however declining in most countries in line with trade liberalisation, for example in the context of Association Agreements with the EU.
The share of non-tax revenues appears significant in several countries, in particular in Egypt and Lebanon. In Lebanon non-tax
revenue stems mainly from entrepreneurial and property income, while in Egypt its main components are transfers from the petroleum authority, the Suez Canal Authority and the central bank.
The budget of several countries, in particular in the Eastern Mediterranean, continues to be dependent on foreign grants or other forms of donor assistance and concessional financing. In Jordan, grants have in recent years accounted for around 10% of GDP and 30% of total revenues. Although they decreased sharply in 2005 (after the end of the scheme for subsidised oil from Saudi Arabia), they still account for nearly 5% of GDP and 15% of total revenues. Israel is the other country for which grants are significant and which in addition benefits from US loan guarantees for part of its debt. While grants are low in Lebanon, the country benefits from the arrangements in the Paris II agreement, mainly from a significant reduction of interest expenditure.15
15 In January 2007 further international assistance (“Paris III”) was pledged to Lebanon in order to alleviate the aggravated economic and fiscal situation in the aftermath of the military conflict of summer 2006. The new assistance package includes a substantial share of direct budget support.
Table 10 Revenue structure of oil-producing countries
(% of total revenue)
Algeria Libya Syria
Hydrocarbon 71 93 33
Non-hydrocarbon 29 7 67
Tax 26 4 40
Direct 7 1 14
Indirect 12 n.a. n.a.
Trade 7 1 7
Other - 2 19
Non-tax 3 2 27
Total 100 100 100
Source: IMF (2005 data).
Privatisation has provided important revenues in most countries of the region, although proceeds differ from country to country, appear relatively volatile, and do not constitute a permanent source of income for funding current expenditure. Proceeds from privatisation have been high in Israel and Jordan, and in some cases have been boosted by the privatisation of the telecommunication sector. This was the case for example for Morocco in 2001 and Tunisia in 2006. Privatisation revenue is expected to provide an important source of income in those countries where the involvement of the state in the productive sectors of the economy remains significant and where the reform process is now accelerating (notably Algeria and Egypt).
In the oil-producing countries, hydrocarbon revenues constitute by far the largest source of budgetary income (see Table 10). In addition, the positive terms-of-trade shock experienced in the past several years has further increased the weight of hydrocarbon revenue in the budgets of these countries. In the case of Algeria and Libya, dependence on oil and gas is particularly high, as the revenues derived from these sources account for about 70% of total revenue in Algeria and more than 90% in Libya. As for Syria, reliance on oil revenues still remains at a significant level, at one-third of total revenue, although it is expected to decline in the coming years due to the depletion of oil reserves. The need to compensate for shrinking oil revenue with an alternative source of income will thus be an important challenge for the Syrian authorities (see also Sub-section 4.1.2).
The share of non-hydrocarbon – and in particular tax – revenues in the budgets of Mediterranean
oil-producing countries is comparatively low. Only in the Syrian budget do non-hydrocarbon revenues represent more than half of budgetary income, with a significant share of non-tax revenues (transfers of profits from state-owned enterprises).
The low revenue-to-GDP ratio outside the hydrocarbon sector reflects the difficulty of raising taxes with existing underdeveloped tax and customs systems and the (perceived) lack of a need for higher tax revenues in view of hydrocarbon wealth. Except for Algeria, the oil-producing countries in the region do not levy VAT. Even in Algeria, the revenue generated from this otherwise important source of budgetary income in the region is relatively low. In addition, taxes on foreign trade account for a sizeable share of tax revenue, which – like in non-oil-producing countries – can be expected to decline, for example in Libya (due to the import tariff reform of August 2005) and in Algeria (which is negotiating WTO entry).
Box 1
FISCAL POLICY CHALLENGES IN OIL-PRODUCING COUNTRIES
Fiscal policy in oil-producing countries faces specific challenges related to the fact that oil revenues are exhaustible, volatile, unpredictable and largely originate from abroad. These features of oil revenues pose challenges in both the long and the short term.1 Their relevance
1 See Barnett and Ossowski (2002).
3 CURRENT BUDGETARY STRUCTURES OF MEDITERRANEAN COUNTRIES
depends on the share of hydrocarbon (oil and gas) revenues in the government’s overall revenues and in total exports and the weight of the hydrocarbon sector in the economy. In the Mediterranean region, these shares are relatively high in Algeria, Libya and Syria (see table above).
Long-term challenges
In the long term, the challenge derives from the exhaustibility of oil reserves and concerns the issues of budgetary sustainability and intergenerational resource allocation. To avoid a sharp adjustment of fiscal policy once oil reserves are exhausted and to secure the participation of future generations in this source of national wealth, oil-producing countries have to accumulate financial assets during the period in which they produce oil, in particular when prices are high. After the end of oil production, the revenues from these assets can be used to replace oil income and to maintain levels of expenditure. Oil wealth is thus gradually transformed into financial wealth, leaving the country’s overall wealth unchanged and preserving it for future generations. Intuitively, this reasoning is straightforward and makes a strong case for persistent overall fiscal surpluses to accumulate assets. However, deriving concrete policy conclusions and making them operational is challenging. For example, estimating the oil wealth of a country, defined as the discounted present value of future oil revenues, is surrounded by significant uncertainty regarding the underlying assumptions, e.g. about the future path of oil prices, about oil reserves, and about the costs of extracting them, which supports a generally cautious approach to fiscal policy. Uncertainty also prevails regarding the role of government capital expenditure in preserving overall wealth. In principle, capital expenditure and the accumulation of real assets could represent an alternative to the accumulation of financial assets, thereby reducing the need for persistent fiscal surpluses. However, the uncertainties surrounding the effects of public capital expenditure on productivity, future output and government revenues, and the difficulties in distinguishing between capital expenditure and current expenditure, warrant caution in this regard. Indeed, due to governance and institutional deficiencies, which can be observed in some oil-producing countries, the ex-post real return of public investment may be lower than the return on financial assets offered by mature economies.
Short-term challenges
The main short-term challenge for fiscal policy in oil-producing countries stems from the unpredictability of oil prices. Public finances are highly dependent on a volatile variable that is largely beyond the authorities’ control. This poses a problem with regard to both macroeconomic management and fiscal planning. The volatility of oil prices, and hence government revenues, tends to contribute to a pro-cyclical pattern and abrupt changes in government spending, as experienced in many countries during the 1970s and 1980s, which may translate into macroeconomic volatility and reduced growth prospects. Thus, there is a case for smoothing public expenditure in oil-producing countries, which is further reinforced
Hydrocarbon dependency of Mediterranean countries (2005)
Hydrocarbon share (%) Algeria Libya Syria
Government revenue 71 93 33
Overall exports 98 97 66
GDP 45 73 28
by the other potential fiscal costs of volatile expenditure policies. These may include a reduction in the quality and efficiency of spending due to constraints in the administrative capacity or the realisation of projects with little marginal value added during periods of high oil prices, and difficulties in containing and streamlining expenditure following an expansion. The planning of a fiscal stance by targeting a particular level of the overall budget balance is rendered difficult by oil price volatility. Therefore, other indicators are needed to guide fiscal policy and to assess the underlying fiscal stance, such as the non-oil balance/non-oil GDP ratio, an indicator which isolates the budget balance from oil price developments. This is all the more needed if the depletion of oil reserves is no longer a distant prospect (see also Sub-section 4.3).
Stabilisation and savings funds2
Several countries deriving substantial export and fiscal revenue from oil (or other non-renewable resources) have set up stabilisation and savings funds to deal with both the long-term and short-term challenges for fiscal policy. The savings function of such funds is meant to address the long-term issue of intergenerational equity and fiscal sustainability by accumulating assets, while the stabilisation function addresses the short-term issues of fiscal planning and macroeconomic stability by absorbing and injecting revenue from/into the budget. However, such funds pose a number of problems in themselves, for example as regards governance, transparency and accountability. They are not a substitute for explicit fiscal policy decisions or (numerical or procedural) fiscal rules and political commitment both to smoothing expenditure and to ensuring long-term fiscal sustainability. Furthermore, their contribution to sound fiscal policies depends on the general quality of institutions and public financial management.
Oil-producing countries could in principle also deal with the unpredictability of oil prices and revenues by using market instruments to hedge oil market risks. However, financial derivatives are sparsely used by oil-producing countries. This may be due to, among other things, so far underdeveloped markets for such products and to political economy and institutional constraints.3
In the Mediterranean region, both Algeria and Libya have established oil funds. In 2000, Algeria established an off-budget hydrocarbon stabilisation fund (Fonds de régulation des recettes) in order to: (i) reconstitute the cushion of external reserves that had previously declined; (ii) service the stock of public debt; and (iii) smooth the longer-term profile of expenditures. The fund does not have an intergenerational transfer purpose. Hydrocarbon revenues in excess of those budgeted (usually on very conservative oil price assumptions) are deposited in the fund. The operational features of the fund leave significant room for discretion. Libya has an oil reserve fund (ORF) since 1995, which is a government account managed by the central bank. It accumulates oil revenue in excess of the level determined by a budgetary oil price. Withdrawals from the ORF, mostly for current expenditure, take place on a discretionary basis. The ORF is not integrated into the budget, and its operations are considered as not being transparent.
2 See Davis, Ossowski, Daniel and Barnett (2001). Stabilisation and savings funds are also referred to as sovereign wealth funds. 3 For a discussion of hedging against oil price volatility, see IMF (2007) and Daniel (2001).
3 CURRENT BUDGETARY STRUCTURES OF MEDITERRANEAN COUNTRIES
3.2 EXPENDITURE STRUCTURE
While differences between oil-producing and non-oil-producing countries are also observable on the expenditure side of the budget, they are less pronounced than on the revenue side. The major differences refer to the relative weight of capital expenditure (higher in oil-producing countries) and interest expenditure (higher in non-oil-producing countries).
In non-oil-producing countries, the relative weight of current expenditure is much higher, accounting for at least three-quarters of total expenditure in all countries and more than 90% in Lebanon and Israel (see Table 11). In the latter two cases, the comparatively high weight of current expenditure is largely explained either by high interest payments on debt (Lebanon) or the importance of defence expenditure (Israel). Capital spending is thus comparatively low in both countries, standing at less than 10% of total expenditure.
Current expenditure can be split into key items: wages and salaries, transfers and subsidies, interest payments and also defence expenditure as it appears significant for several Eastern Mediterranean countries.
Tunisia and Morocco are characterised by the very high share of the wage bill, which absorbs more than 40% of total expenditure, although in Morocco the recent voluntary retirement programme is expected to better contain the
Table 11 Expenditure structure of non-oil-producing countries (% of total expenditure)
Egypt Israel Jordan Lebanon Morocco Tunisia
Current 86 91 75 93 78 76
Wages & salaries 24 20 14 23 42 45
Transfers & subsidies 24 32 27 29 6 14
Interest payments 18 16 7 34 13 11
Defence expenditure n.a. 21 21 n.a. 15 n.a.
Other expenditure 20 2 6 6 2 6
Capital 14 9 25 7 22 24
Total 100 100 100 100 100 100
Source: IMF (2005 data, for Jordan 2004).
wage bill in the medium term. By contrast, the share of the wage bill is very low in Jordan.
Although the share of transfers and subsidies is surprisingly low in Morocco (given the prevalence of poverty), it is generally much higher than in oil-producing countries (excluding Algeria). In Israel transfers and subsidies stand at one-third of total expenditure, but in contrast with other countries in the region most expenditures covered under this item are transfers (not subsidies), reflecting the features of the social system which are similar to European countries. In the other Mediterranean countries, explicit and implicit subsidies are prevalent as a key instrument of social policies, in particular for petroleum products and food items.
The weight of interest payments appears heterogeneous but it is far higher than in oil-producing countries. In all countries except Jordan, interest payments account for more than 10% of total expenditure. In Lebanon interest payments constitute one-third of total expenditure and absorb nearly half of total revenue.
A key feature on the expenditure side in particular in Eastern Mediterranean countries is high defence outlays, which for instance account for more than 20% of total expenditure in both Israel and Jordan.
In the oil-producing countries, the relative weight of capital expenditure is comparatively high (see Table 12). This is most strikingly the
Box 2
WEST BANK AND GAZA BUDGET STRUCTURE1
The budgetary structure of the West Bank and Gaza exhibits some very special features which make it different from other countries in the region. These concern most specifically the way trade-related taxes are collected (by another country), the weight of the wage bill in total expenditure and the reliance on external budget support from foreign donors, the latter two of which are even higher than in other countries of the region.
Revenue and expenditure
The Palestinian Authority (PA) has three main sources of revenue (see table below): first, the so-called “clearance revenues” (the Israeli authorities collect and remit to the PA taxes levied in Israel on merchandise destined for the West Bank and Gaza), which represent about one-third of total revenue; second, the revenue from other taxes raised domestically; and third, foreign donor assistance, which is very high (representing more than half of total revenue, although it
Table 12 Expenditure structure of oil-producing countries
(% of total expenditure)
Algeria Libya1) Syria
Current 66 46 62
Wages & salaries 24 24 20
Transfers & subsidies 34 6 18
Interest payments 5 - 4
Defence expenditure n.a. 5 16
Capital 34 54 38
Total 100 100 100
Source: IMF (2005 data).
1) See footnote 2 in Table 7 on the uncertainty as regards the classification of current expenditure in Libya.
case for Libya where capital expenditure appears to even exceed current expenditure (although the current expenditure-to-GDP ratio is very high at around 30%). The high level of capital expenditure is largely due to the implementation of a number of extraordinary projects, notably the gas pipeline connecting Italy to Libya (half of which was financed by Libya). As for Algeria and Syria, the relative share of capital expenditure is lower, accounting for about one-third of total expenditure. The high hydrocarbon prices of recent years have
not led to spending booms so far. However, capital expenditure is expected to further increase in the coming years, in particular in Algeria, as the government plans to develop physical infrastructure and to address the population’s housing needs. It is also expected to remain at a high level in Libya as basic infrastructure deteriorated significantly under the international sanctions imposed on the country until recently.
Concerning current expenditure items, the share of wages and salaries is at similar levels in all countries. However, it is expected to rise in Algeria and Libya following recent significant increases in public sector wages. As for subsidies and transfers, they are notoriously high in Algeria, accounting for more than one-third of total expenditure. In all countries interest payments on public debt stand at a low level. They are expected to decrease in Algeria following recent early debt repayments to foreign creditors. As for Libya, the budget no longer includes any interest payment since public debt has been entirely repaid. Finally, defence expenditure accounts for a significant share of total spending in Syria.
1 The information contained in this box is drawn from various World Bank and IMF documents and covers only the period until end-2005. The situation changed dramatically in the course of 2006.
3 CURRENT BUDGETARY STRUCTURES OF MEDITERRANEAN COUNTRIES
is technically treated as a financing item in the official PA budget). On the expenditure side, the budget structure of the PA is characterised by the predominant weight of the wage bill, absorbing nearly all domestically raised revenue.
External financing
The PA has been able to maintain delivery of core services thanks to extensive foreign assistance in the form of direct budget support. The main budget support instrument is the multi-donor trust fund administered by the World Bank (12 donors had contributed to this trust fund by end-2005). The PA and the World Bank agree every six months on a set of specific reform benchmarks that, upon fulfilment, trigger disbursements. Other donors, mostly from the Gulf countries, provide budgetary assistance on a bilateral basis.
Budget deficit
The budget deficit reached USD 777 million in 2005 (17% of estimated GDP), up from USD 576 million in 2004 (14% of estimated GDP). This was due to higher spending (+30%) stemming from large increases in public sector wages (breaching in the second half of 2005 the Wage Bill Containment Plan agreed with the World Bank) and net lending (to the Gaza Electricity Distribution Company and municipalities in the West Bank for the payment of utilities). Only USD 349 million were received in budget support, roughly half the USD 654 million that had been foreseen in the budget. The resulting gap was financed mainly by borrowing from domestic banks. Although the PA budget does not foresee any borrowing from domestic banks (as shown in the table above), the effective budget gap has consistently led to the necessity to increase indebtedness vis-à-vis the domestic banking sector (funded with a relatively stable deposit base).
Budget management, transparency and accountability
Considerable progress has been made in budget management, transparency and accountability in the period 2002-05. All PA revenues are now paid into a single Treasury account (eliminating previous non-transparent and discretionary spending from various off-budget accounts); an orderly system of budget appropriation is now in place; the budget and monthly budget execution reports are posted on the website of the Ministry of Finance (MOF); the annual budget is approved by the Palestinian Legislative Council (PLC); internal and external audit functions have been strengthened; public sector salaries are deposited in individual bank accounts and no longer paid in cash; the establishment of a Palestinian Investment Fund (PIF) has brought all PA equity holdings under MOF oversight; and the management of the PA’s petroleum monopoly has been taken over directly by the MOF.
Sources of revenues in the PA budget (% of total revenue)
2003 Budget 2004 Budget 2005 Budget
Clearance revenue 25 30 30
Other domestic taxes 16 17 18
External financing 58 53 53
Overall assessment
The PA budget is following a path that is clearly unsustainable in the medium term as the wage bill is increasing rapidly and donor support falls far short of commitments (even before the 2006 events). Thus, the deficit is financed by additional borrowing from domestic banks, liquidation of PIF assets, and accumulation of arrears including towards the pension fund and private suppliers. Given the share of the wage bill in the PA budget, restoring fiscal sustainability implies first of all strict containment of hiring and salary adjustments (in particular in the security forces). It also necessitates a reduction in net lending through higher compliance in the payment of utility bills at the municipal level. Finally, it hinges on both the regular transfer by Israel of clearance revenue to the PA and high foreign assistance by the donor community.
3.3 CHALLENGES CONCERNING THE STRUCTURE OF BUDGETS
The review of the revenue and expenditure structure reveals some key features and challenges in Mediterranean countries’ budget structure.
On the revenue side, a key feature appears to be the low weight of tax revenue, as witnessed by a relatively low ratio of tax to GDP. For example, direct tax revenues account for only 7% of GDP in Morocco and Tunisia, for around or less than 5% in Egypt, Jordan, Lebanon and Syria, and for 2% in Algeria and Libya. This compares with 11-14% in euro area countries like Germany, France and Italy, and with around 8% in Turkey, which may be a more appropriate benchmark. While indirect taxes provide more revenue than direct taxes in most Mediterranean countries, with a share of around or below 10% of GDP, indirect tax revenues lag for example those of Turkey (around 15% of GDP). In addition, the part of the indirect tax revenue in the form of international trade-related taxes has already declined – and will likely further drop – in the wake of ongoing trade liberalisation.
Thus, one challenge for the authorities of most Mediterranean countries is to guarantee the sustainability of public finances by generating sufficient tax revenue to cover essential public expenses, while trying to minimise at the same time the disincentives to work, save and invest. To achieve this goal, increases of tax rates are
usually counterproductive as they tend to increase distortions in the economy and incentives for tax evasion. A broadening of the tax base by limiting or even eliminating exemptions seems to be a more promising way to increase revenue, while keeping rates at relatively lower levels. Increasing tax revenue also requires combating tax evasion through a further strengthening of tax administrations. Some Mediterranean countries have started to follow this route, for instance Egypt, where income tax rates have recently been cut in half while revenue administration has improved.
The degree of donor dependence is also high and appears as a key revenue component in the budget of several Eastern Mediterranean countries. Dependence on external aid makes a country vulnerable to the extent that foreign grants may be volatile and thus not easily predictable. Furthermore, they lessen the incentives to develop domestic sources of revenue or to cut unproductive expenditure. In the past, foreign grants to Mediterranean countries have been relatively stable, but in the most recent period they have decreased in some countries like Jordan, thereby raising fiscal pressure.
On the expenditure side, the budgetary cost of subsidies (mostly on energy and food items) is high in most Mediterranean countries. In addition to the enormous fiscal drain, subsidies are questionable both from a distributional and an allocation perspective. From a distributional
3 CURRENT BUDGETARY STRUCTURES OF MEDITERRANEAN COUNTRIES