Durham E-Theses
Automated retinal analysis
Lowell, James .
How to cite:
Lowell, James . (2006) Automated retinal analysis, Durham theses, Durham University. Available at Durham E-Theses Online: http://etheses.dur.ac.uk/2887/
Use policy
The full-text may be used and/or reproduced, and given to third parties in any format or medium, without prior permission or charge, for personal research or study, educational, or not-for-prot purposes provided that:
• a full bibliographic reference is made to the original source • alinkis made to the metadata record in Durham E-Theses • the full-text is not changed in any way
The full-text must not be sold in any format or medium without the formal permission of the copyright holders. Please consult thefull Durham E-Theses policyfor further details.
Academic Support Oce, Durham University, University Oce, Old Elvet, Durham DH1 3HP e-mail: [email protected] Tel: +44 0191 334 6107
AUTOMATED RETINAL ANALYSIS
by
James A. Lowell
The copyright of this thesis rests wHh the author or the university to which It was submitted. No quotation from It, or Information derived from It may be published without the prior written consent of the author or university, and any Information derived from It should be acknowledged.
Submitted in conformity with the requirements
for the degree of PhD
Department of Computer Science
University of Durham
Copyright© 2006 by James A. Lowell
Abstract
Automated Retinal Analysis James A. Lowell
Diabetes is a chronic disease affecting over 2% of the population in the UK
[1].
Long-term complications of diabetes can affect many different systems of the body including the retina of the eye. In the retina, diabetes can lead to a disease called diabetic retinopathy, one of the leading causes of blindness in the working population of industrialised countries.The risk of visual loss from diabetic retinopathy can be reduced if treatment is given at the onset of sight-threatening retinopathy. To detect early indicators of the disease, the UK National Screening Committee have recommended that diabetic patients should receive annual screening by digital colour fundal photography [2]. Manually grading retinal images is a subjective and costly process requiring highly skilled staff.
This thesis describes an automated diagnostic system based on image processing and neural network techniques, which analyses digital fundus images so that early signs of sight threatening retinopathy can be identified. Within retinal analysis this research has concentrated on the de-velopment of four algorithms: optic nerve head segmentation, lesion segmentation, image quality assessment and vessel width measurements. This research amalgamated these four algorithms with two existing techniques to form an integrated diagnostic system.
The diagnostic system when used as a 'pre-filtering' tool successfully reduced the number of images requiring human grading by 74.3%: this was achieved by identifying and excluding images without sight threatening maculopathy from manual screening.
Acknowledgements
First and foremost, a special thanks goes to my parents, Anthea and Peter, for their continual support and belief throughout my entire education.
Special thanks goes to Cat, for all her encouragement and total belief throughout my time studying for my PhD.
I would like to thank my academic mentor and principal supervisor Andrew Hunter, for all his patience, encouragement, and guidance. Without which, I may not have got this far.
I wish to thank David Steel, Maged Habib and Ansu Basu for their medical advice and hard work during this research.
Thanks also to Malcolm Munro and Nick Holliman for their thesis advice and proof reading.
Many thanks goes to Barbara (the co-inventor of extreme office ball), for keeping me smiling during the months leading up to submission.
Finally, I would like thank Diabetes UK for funding this research.
Copyright Notice
The copyright of this thesis rests with the author. No quotation from it should be published without their prior written consent and information derived from it should be acknowledged.
Declaration
The material contained within this thesis has not previously been submitted for a degree at the University of Durham or any other university. The research reported within this thesis has been conducted by the author unless indicated otherwise. This research has been documented, in part, within the following publications:
• A. Hunter, J. Lowell, J. Owens, and L. Kennedy, Quantification of Diabetic Retinopathy Using Neural Network and Sensitivity Analysis,Proceedings of Artificial Neural Networks in Medicine and Biology, 81-86, 2000.
• J. Lowell, A. Hunter, Automated Detection of Diabetic Retinopathy, Poster Session, House of Commons, 2001
• A. Hunter, J. Lowell, D. Steel, A. Basu and R. Ryder, Non-Linear Filtering for Vascular Segmentation and Detection of Venous Beading,Department of Computer Science, University of Durham, Technical Report, 08/02, 2002.
• J. Lowell, A. Basu, A. Hunter, D. Steel, L. Kennedy, R. Ryder, A Neural Network System for Diagnosis of Diabetic Retinopathy by White Lesion Detection and Classification, Diabetes UK, 2002.
• J. Lowell, A. Hunter, Automated Clas.~ification of Referable Diabetic Maculopathy from Fun-dus Images, Poster Session, Association for Research in Vision and Ophthalmology, (ARVO), Fort Lauderdale, 2003.
• J. Lowell, A. Hunter, D. Steel, A. Basu, R. Ryder, E. Fletcher, L. Kennedy, Optic nerve head segmentation, IEEE Transactions on Medical Imaging, February, 23(2), 256-64, 2004.
v
• J. Lowell, A. Hunter, D. Steel, A. Basu, R. Ryder, L. Kennedy, Measurement of Ret-inal Vessel Widths Prom Fundus Images Based on 2-D Modeling, IEEE 'fransactions on Medical Imaging, October, 23(10), 1196- 1204, 2004.
• M. Habib, J.Lowell, A. Hunter, D. Steel, Automated classification of refemble diabetic macu-lopathy from digital fundus images, North of England Ophthalmological Society. Manchester, March, 2005.
Contents
1 Introduction 1.1 Introduction . 1.2 Objectives . . 1.3 Criteria for Success . 1.4 Thesis Overview . .
2 Medical Background 2.1 Introduction . . . . 2.2 Anatomy of the Eye
2.3 Causes of Diabetic Retinopathy
2.4 Pathological Changes of Diabetic Retinopathy 2.4.1 Non-proliferative Retinopathy . 2.4.2 Proliferative Retinopathy 2.4.3 Maculopathy
2.5 Clinical Features . 2.6 Clinical Diagnosis .
2.6.1 Non-proliferative Diabetic Retinopathy (NPDR) 2.6.2 Proliferative Diabetic Retinopathy (PDR) 2.7 Treatment . . . .
2.7.1 Photocoagulation . 2.7.2 Vitrectomy . . . .
2.8 Early Detection for Diabetic Retinopathy
vi 1 4 6 6 11 11 12 13 14 15 15 16 16 18 18 18 19 19 20 21
CONTENTS
2.9 Summary . . .
3 Optic Nerve Head 3.1 Introduction . .
3.1.1 Motivation 3.1.2 Chapter Contents
3.2 Problem Domain & Literature Review 3.2.1 Optic Nerve Head Appearance 3.2.2 Optic Nerve Head Localisation
vii 22 23 23 23 25 25 25 26
3.2.3 Optic Nerve Head Boundary Segmentation 27
3.3 Method . . . 36
3.3.1 Optic Nerve Head Localisation 36
3.3.2 Optic Nerve Head Boundary Segmentation - Novel Alterations to the Hu's model . . . .
3.3.3 Optic Nerve Head Boundary Segmentation - Phases 3.4 Evaluation . . . .
3.4.1 Optic Nerve Head Localization Results .
3.4.2 Optic Nerve Head Boundary Segmentation Results 3.5 Conclusion
4 Fovea Detection & Vascular Segmentation 4.1 Introduction . . . . 4.1.1 Chapter Contents 4.2 Fovea Detection . . 4.2.1 4.2.2 4.2.3 4.2.4 Motivation
Appearance and Distractors Fovea Location Algorithm Evaluation
4.3 Vascular Segmentation 4.3.1 Motivation . .
4.3.2 Appearance and Distractors
37 41 43 44 44 48 50 50 50 51 51 51 52 53 54 54 55
CONTENTS viii
4.3.3 Vascular Segmentation Algorithm 55
4.3.4 Evaluation 56
5 Diabetic Lesions 58
5.1 Introduction . 58
5.1.1 Motivation 58
5.1.2 Chapter Contents 59
5.2 Problem Domain & Literature Review 59
5.2.1 Bright Lesions 59 5.2.2 Dark Lesions 66 5.2.3 Classification 70 5.2.4 Summary 76 5.3 !VIet hod 76 5.3.1 Location . 77
5.3.2 Segmentation - Region Growing . 78
5.3.3 Feature Extraction 81 5.3.4 Classification 87 5.4 Evaluation . 88 5.4.1 Lesion Segmentation 89 5.4.2 Neural Network. 95 5.5 Conclusion .. 97
6 Image Quality Assessment 99
6.1 Introduction . 99
6.1.1 Motivation 99
6.1.2 Chapter Contents 100
6.2 Problem Domain & Literature Review 100
6.2.1 Image Quality Characteristics . 100
6.2.2 Quality Assessment Algorithms 102
6.2.3 Summary 104
CONTENTS
6.3.1 Vascular measurement definition 6.3.2 Fovea Contrast Definition . . 6.3.3 Overall Image Quality Metric 6.3.4 Quality Metric Boundaries 6.4 Evaluation . . . . 6.4.1 Benchmarking Method . 6.4.2 Models Tested 6.4.3 Results 6.5 Conclusion 1 Retinal Vessels 7.1 Introduction . 7.1.1 Motivation 7.1.2 Chapter Contents
7.2 Problem Domain & Literature Review 7.2.1 Retinal Vessel Structure . . . 7.2.2 Diameter measurement algorithms 7.3 Method . . .
7.3.1 Model definition 7.3.2 Optimization
7.3.3 Determining the model width 7.4 Evaluation . . . .
7.4.1 Benchmarking Method . 7.4.2 Models Tested
7.4.3 Results . .
7.4.4 Effectiveness of the light reflex model 7.4.5 Effect of high curvature on precision 7.4.6 Effect of beaded vessels on precision 7.5 Conclusion IX 105 106 108 108 109 109 109 110 113 114 114 114 115 116 116 117 120 120 121 125 125 126 127 128 129 129 129 131
CONTENTS 8 System Evaluation 8.1 Introduction . . . 8.1.1 Chapter Contents 8.2 Benchmarking Method 8.3 Clinician Disparity 8.4 Screening Data 8.5 Results . . . . . 8.5.1 Screening Programme 8.5.2 Pre-filtered Screening 8.6 Summary 9 Conclusion 9.1 9.2 9.3 9.4 9.5 Introduction . 9 .1.1 Chapter Contents Criteria for Success . . . .
Summary of Research Contributions Future Work Conclusion X 132 132 133 133 135 136 137 137 139 142 143 143 143 144 145 147 149
List of Figures
1.1 Effect on vision a). Normal vision b). Vision with diabetic retinopathy, [taken from http:/ jwww.stlukeseye.com/Conditions/DiabeticRetinopathy.asp] 3 1.2 Canon CR6 45MN, [taken from http:/ jwww.edigonline.com/fundus.htm] 3 1.3 Fundus Photographs a). Structural components of the retina b). Retina with diabetic
1.4
2.1 2.2
2.3
retinopathy . . . .
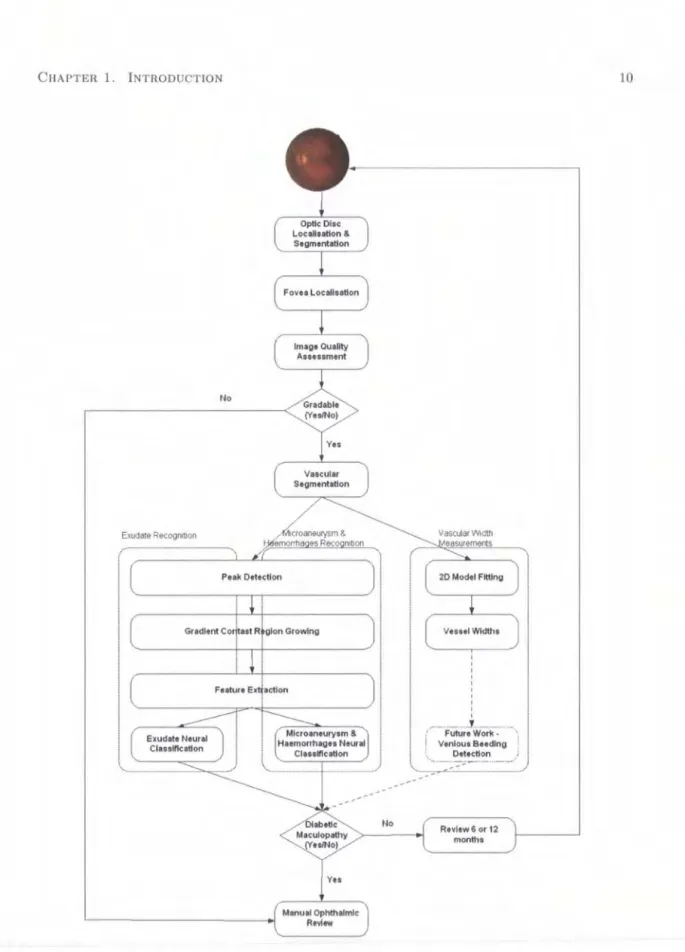
Outline of the proposed system for automated detection of maculopathy
Anatomy of the eye, [taken from http:/ fwww.stlukeseye.com/ Anatomy.asp]
Anatomy a). Retina. b). Macula, [taken from http:/ /www.stlukeseye.comfanatomy /retina.asp and /Macula.asp respectively]
Retinal Quadrants .
2.4 Photocoagulation a). Focal b). Panretinal, [taken from http:/ jwww.eyemdlink.com/ Eye-9 10 13 14 19 Procedure.asp?EyeProcedureiD=55] . . . 20 2.5 Vitrectomy, [taken from http:/ /theretinasource.comfconditions/diabetic_ retinopathy.htm] 21
3.1 Retinal Structure . . . 24 3.2 The Optic Nerve Head. a) Cross Section. b) A typical well-defined disc. 25
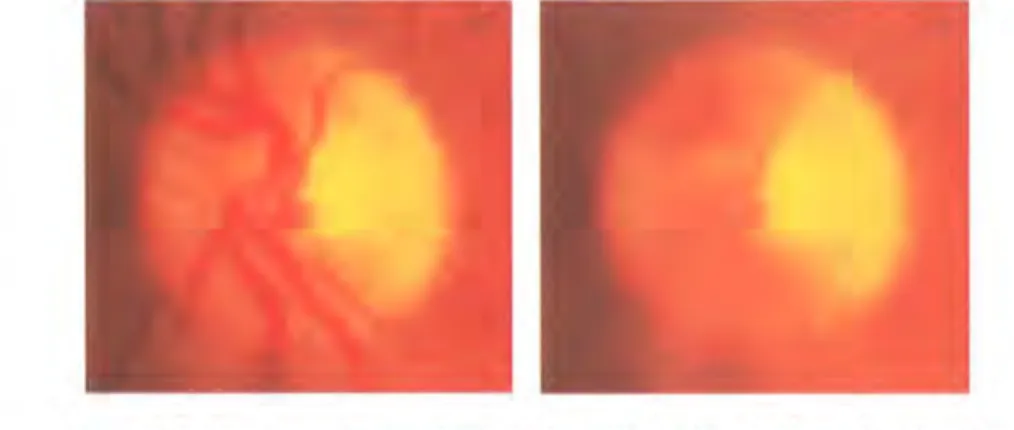
3.3 Examples of varing optic nerve head appearance 27
3.4 Circular Hough Transform . . . 28
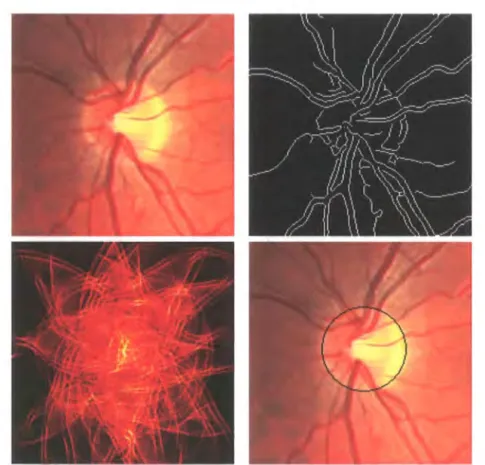
3.5 Circular Hough Transform a)Colour fundus. b)Canny edge map. c)Circular Hough Transform. d)Superimposed Hough Result 011 Optic Nerve Head. 29 3.6 Hough Transform Result . . . 30
LIST OF FIGURES xii
3.7 The Optic Nerve Head. a) Normal. b) Morphologically Closed. . . 32 3.8 a) Irregular image sampling. b) Bilinear interpolation of gradient. 33
3.9 a) Stiffness factor function. b) Radial Force 35
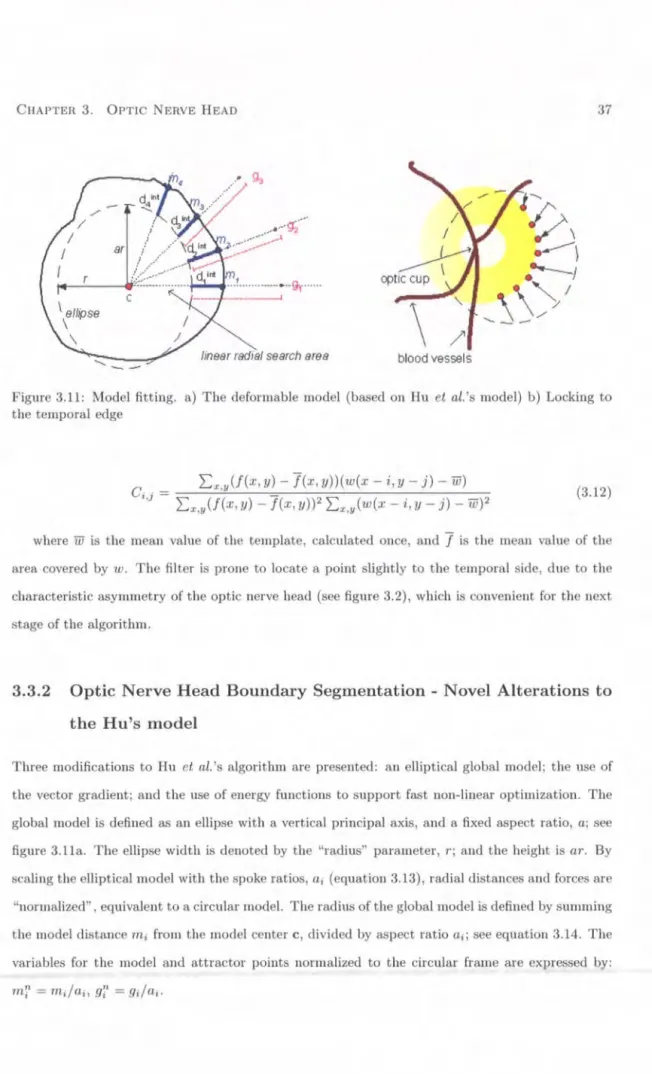
3.10 Localisation filter . . . 36 3.11 Model fitting. a) The deformable model (based on Hu el al.'s model) b) Locking to
the temporal edge 37
3.12 Line Search . . . . 40
3.13 Localization Algorithm. a) Gross exudation. b) Strong pallor. 44 3.14 Sample Segmentations. a) Excellent. b) Good. c) Fair. d) Poor. Solid line:
algorithm; dotted line: mean clinician boundary. .
3.15 a). Temporal Lock (TL) versus direct algorithm. b). Interaction between De-vascularization (DV) and vector (Vec)/magnitude (Mag) gradient versions of direct algorithm. c). Temporal Lock (TL), vascularized Hough (DV Hough), and
De-46 vascularized direct (DV). . . 48 4.1 4.2 4.3 4.4 4.5 4.6 5.1 5.2 5.3 5.4 5.5 5.6 5.7 5.8 Fovea . . . . Fovea. a) Low Contrast. b) Distracter. Fovea Template . . . .
Distracters a) Exudates b) Light Artefact c) Tiger Strips Normal a) Blood Vessel b) Blood Vessel Cross Section Profile .
Sensory Layer, [taken from http://my.webmd.com/hw /healthguideatoz/hwl21946.asp] . Exudates a) Circinate b) Single dot c) Multiple . . .
Distractors a) Drusen. b) Light Artefact c) Laser Burn. Red Lesions a) Haemorrhage b) Microaneurysm c) Mixed
Distractors a) Light Artefact b) Choroidal vessels c) Vessel Breaks Hit-and-miss structuring elements a) Object. b) Background . . Example of region growing a) iteration 1 b) iteration 2 c) iteration 3
Segmentation Examples TL) Original, TR) Adaptive, BL) Fuzzy, BR) Gradient. Green TP, Red FN, Blue FP, Black TN . .
51 52 53 56 56 57 60 61 61 66 67 69 79 93
LIST OF FIGURES xiii
5.9 Gradient Image versus Intensity Image Segmentation Example L) Gradient, R) In-tensity. Green TP, Red FN, Blue FP, Black TN . . 94 5.10 Contrast Gradient Model Segmentation Examples.
5.11 ROC Curves a) Exudate Ensemble Neural Network b) Microaneurysms and Haem-orrhages Ensemble Neural Network
6.1 Achievable standard 6.2 Minimum standard .
6.3 Inadequate (ungradable) a) poor illumination b) cataracts 6.4 Fovea Quality Measure . . . .
6.5 Image Quality Assessment Performance Receiver Operating Characteristic Curve: 95 96 101 102 103 107
Macula model algorithm- Blue; Usher's algorithm- Red; Lalonde's algorithm- Greeu.111
7.1 The apparent and true width of the blood column Based on Brinchmann-Hansen, 0; Heier, H. Acta Ophthalmolog. Suppl. 1986,179,29-32.
7.2 Sample vessel profile . . . . 7.3 a) Full width half maximum. b) Rectangular profile.
116 117 118 7.4 Model without Light Reflex. a) Cross-section of Profile. b) Two-dimensional Representation.121 7.5 Model with Light Reflex. a) One-dimensional Representation. b) Two-dimensional
Repre-7.6 7.7 7.8 7.9 8.1 sentation . . . .
Vascular model. a) Vessel segments points. b) Mask and Region of Interest Kick Points . . . .
Detected widths on a) Straight b) beaded vessel segment. Detected widths on curved vessel segments. . . .
Potential Exudates missed due to estimated disc diameter and fovea centre. . . . . 121 123 127 130 130 135
List of Tables
3.1 3.2 3.3 3.4 4.1 4.2 5.1 5.2 5.3 5.4 5.5 5.6 6.1 6.2 6.3 6.4 6.5Screening Data Image Quality . Localization Performance . . .
Subjective Classification of Performance Error types . . . .
Distance from Real Fovea Centre . . . . Accumulated Distance from Benchmarked Fovea
Algorithm Performance Metrics Algorithm Pixel Classifications
Effect of Colour Components in Region Growing Gradient Image versus Intensity Image . . . .
Gradient Image versus Intensity Image Pixel Classifications
Exudate and Microaneurysms and Haemorrhages Ensemble Classification
Quality Metric Boundary
Image Quality Assessment Algorithm Performance
Amalgamated Image Quality Assessment Algorithm Performance Macula Model Image Quality Categorisation Performance Foveal Measure Performance
43 44 46 48 54 54 91 92 92 93 94 97 108 110 111 112 113
7.1 Standard deviation of width difference at a scaling of 4 . . . 128
8.1 Clinician Disparity . . . . 136
LIST OF TABLES XV
8.2 Clinician Adjudication 136
8.3 Screening Data .. . . 137
8.4 Screening Programme System Performance: Evaluated per Patient 138 8.5 Screening Programme System Performance: Evaluated per Image . 138 8.6 Pre-filtered Screening System Performance: Evaluated per Patient 139 8.7 Pre-filtered Screening System Performance: Evaluated per Image 140 8.8 Pre-filtered Screening vs Usher: Evaluated per Patient 140 8.9 Pre-filtered Screening vs Usher: Evaluated per image . 141 8.10 Pre-filtered Screening System Performance: Evaluated per Patient 141 8.11 Pre-filtered Screening System Performance: Evaluated per Image 141
Chapter
1
Introduction
The research contribution of this thesis is the development of techniques for the automated analysis of the retina using digital fundus images. The technical problems associated with retinal analysis have been isolated and have led to the development of four novel algorithms; a deformable model for optic nerve head segmentation; a new region growing algorithm for lesion segmentation based on gradient contrast and compactness; identification of a image quality metric for fundus image quality assessment; and development of a 2D vascular segment model for vessel width measurements.
1.1
Introduction
Medical diagnostic imaging has existed since the first decade of the 1900's after the discovery of x-rays. Following World War II and the arrival of the digital computer, new image modalities including ultrasound and magnetic resonance imaging have combined to create an explosion of research into medical image analysis [3].
Diagnostic imaging has enabled non-invasive visualisation of a variety of biological systems, such as the brain, heart, lungs and eyes. Medical diagnosis based on images obtained by ultrasound, computer tomography (CT), magnetic resonance (MR), digital x-rays and digital fundus cameras (see figure 1.2) is now commonplace and has significantly improved the medical care available to patients. With increased medical imaging capabilities, screening programs for the early detection of cancerous tumors or lesions from other diseases such as diabetes have gone nationwide. The
CHAPTER 1. INTRODUCTION 2
repetitive task of manually assessing large numbers of diagnostic images and the susceptibility of intra-observer variation and error has encouraged the investigation of methods for semi-automated and fully-automated analysis of medical images. Such investigations are usually multidisciplinary due to the complexities of computer vision, and often require implementation of image processing, pattern recognition, and machine learning techniques.
Diabetes mellitus is a chronic disease caused by insufficient insulin being produced by the pancreas or by the ineffectiveness of the insulin produced. In recent years, diabetes mellitus has reached worldwide epidemic proportions. The World Health Organization attributes the increased occurrence of the disease to lifestyle and economic change. In 1985, the worldwide estimate for diabetes was 30 million people; a decade later, 135 million. The WHO's millennium estimation was 177 million worldwide sufferers. This figure is expected to almost double by 2025 [4].
There are two principle forms of diabetes; insulin dependent (type 1) and non insulin dependent (type 2). Insulin dependent diabetes occurs most frequently in children and adolescents and is most commonly caused by the inherited failing of the pancreas to produce enough insulin for the body. Non insulin dependent diabetes accounts for 90% of all cases, and typically effects ageing adults with unhealthy diets, obesity and sedentary lifestyles, and results in the body's inability to process the insulin produced by the pancreas [4]. Increased concentrations of glucose in the blood caused by pancreas deficiencies damage many of the body's systems, but in particular the blood vessels and nerves. Complications of the disease vary with the duration of elevated blood glucose but can include kidney failure, heart disease, limb damage (leading to amputation) and eye disease.
Diabetic retinopathy is a common complication of diabetes and a leading cause of blindness and visual impairment. After 15 years of diabetes, over 95% type 1 and 77% of type 2 patient sufferers develop retinopathy [5][6]. The severity of the retinopathy varies with the age of onset, disease duration and the blood glucose control. However, at 15 years duration, approximately 2% of people become blind and 10% will be severely visually handicapped [4]; see figure 1.1.
Although, diabetic retinopathy cannot be cured, the progression of the disease can be slowed or even halted if it is detected early and treatment given. Diabetics are generally unaware of the onset of retinopathy as visual loss is most commonly associated with severe retinal disease. It is therefore recommended that diabetics receive annual eye examinations to detect initial signs of progression of retinopathy. Such screening, followed by appropriate treatment is believed to prevent blindness
CHAPTER 1. INTRODUCTION 3
Figure 1.1: Effect on VISIOn a). Normal VISIOn b). Vision with diabetic retinopathy, [taken from http:/ /www.stlukeseye.com/Conditions/DiabeticRetinopathy.asp]
within 90% of patients at risk if caught early enough in its progression [7].
Screening in the UK is either done by fundal examination (viewing the back of the eye, including the retina), performed by medical or optometric staff or by observation of retinal photographs [8]. Figure 1.2 a. shows a Canon CR6-45NM Non-Mydriatic fundus camera, the type used to capture retina images for this research. Figure 1.3 shows two examples of retinal fundal images. In photographic screening units highly trained staff visually assess large numbers of retinal images, searching for small abnormalities indicative of diabetic retinopathy.
Figure 1.2: Canon CR6 45MN, [taken from http:/ /www.edigonline.com/fundus.htm]
As the growing diabetic population overstretches the screening infrastructure [8] the pressure on specialist staff increase. This can have a knock on effect for the detection of diabetic retinopathy as early indicators can be missed due to subjective error or human error in the performance of repetitive tasks. A screening method that does not require highly trained personnel would relieve pressure from screening services and decrease costs.
CHAPTER 1. INTRODUCTION 4
In summary, a fully automated diagnostic approach, involving computer analysis of digital fundus images, could provide patient referral assessments and reduce the workload of specialist staff.
1.2
Objectives
Automating retinal screening from digital fundus images can be thought of as a modular problem with varying degrees of success attainable. There are a number of visual clinical features indicative of diabetic retinopathy that appear at different phases of progression and at different levels of regularity. For an automated screening system to match a human grader, such a system would require an ensemble of algorithms capable of detecting and distinguishing all clinical features no matter how rare, or at least be capable of flagging unusual images.
The system would also be required to follow national screening guidelines, categorising patients as referable or non-referable. A patient at risk of developing sight threatening retinopathy and requiring further ophthalmic investigation is classed as referable whereas a patient not at risk and requiring no further action until the next annual eye examination is classed as non-referable. This classification depends upon the frequency and position of early diabetic features such as vascular bulges (microaneurysrns), leakages of blood (haemorrhages), deposits of lipoproteins (exudates) and vascular anomalies such as venous beading (unusual variations in diameter).
In addition to accurately identifying diabetic lesions, locating structural elements such as the fovea, is also necessary. The fovea at the central part of the retina subserves fine detail and colour vision, retinal lesions found in, or immediately around, the fovea (macula) are associated with a high risk of visual loss as diabetic lesions or floaters obscure fine and colour vision. Figure 1.3a shows the structural location of the fovea together with the optic nerve head and vascular network. Figure 1.3b shows a high risk retina with diabetic retinopathy. The image has gross exudatation in conjunction with large haemorrhage floaters.
Identifying retinal lesions associated with diabetic retinopathy is a critical and demanding process in automated retinal image analysis. This is mainly due to the varying shapes, sizes, and colour of lesion types, image distracters such as lighting variation, natural pigmentation, light artefacts, broken capillaries and non-diabetic lesions. The variability of retinal appearance argues
CHAPTER 1. INTRODUCTION 5
for a structured approach [9], where significant landmarks in the retina are identified, and the relationships between them exploited to increase confidence in the classification of each object.
The focus of this research is the development of novel algorithms for the structured analysis of the retina, the purpose of which is the automatic diagnosis of digital images, identifying early signs of sight threatening retinopathy. As algorithms exist that segment the fovea and the blood vessel map to an acceptable level, this research has concentrated on the following areas of the structured analysis:
1. Optic Nerve Head: Optic nerve head segmentation is a necessary step in this structured analysis for a number of reasons. The optic nerve head can itself act as a distracter: it is a large bright region that can be mistaken (by algorithms) for gross circinate exudation (large circular group of exudates). Secondly, the optic nerve head can be used to locate the general location of the fovea using an approximated distance from the centre of the optic nerve. The fovea is a dark approximately circular area, but the contrast is often quite low, and it may be obscured by exudates or blurring. Consequently a global correlational search often fails.
2. Diabetic Lesions: Microaneurysms and haemorrhages detection and classification: Retinal microaneurysrns are the earliest clinically apparent lesion indicative of diabetic retinopa-thy. This is shortly followed by the appearance of small haemorrhages that have leaked from ruptured microaneurysms. Identification of these lesions is therefore vital to obtain early indi-cation of disease. Exudate detection and classifiindi-cation: Exudates located within the macula area are an important gauge of sight threatening retinopathy or progressive maculopathy (within the macula area).
3. Image Quality Assessment: Image quality is an important factor in diagnostic imaging, and can alter diagnosis if areas indicative of disease are blurred or not illuminated. Retinal image quality can be defined by the contrast between the fovea and background retina and the quantity and sharpness of retinal vessels leading up to the macula. Measuring image quality is a crucial step in order to flag images not suitable for automated screening.
4. Retinal Vessels: Changes in retinal vessel diameter are an important predictive indicator of sight threatening retinopathy. Obtaining precise measurements of vascular widths is therefore a necessary step to calculate vascular change.
CHAPTER 1. INTRODUCTION 6
The proposed automated system should be able to detect features symptomatic of diabetic retinopathy and provide diagnosis based on national screening criteria. It is expected that the majority of sight threatening retinopathy cases be identified and ungradeable images flagged for further investigation. The outline of the proposed system structure is shown in figure 1.4. The modular structure of the system allows continuous improvement to existing retinal analysis compo-nents, together with enabling the inclusion of additional clinical feature location and classification; such as the feature inclusion of venous beading detection.
1.3
Criteria for Success
As this research aims to investigate and develop techniques for the structured analysis and classi-fication of digitized retinal images, its success can be judged on how well each algorithm fulfils its role and how it compares to other published techniques:
1. Locate and segment the Optic Nerve Head from the fundus image.
2. Segment the boundary of potential retinal lesions indicative of diabetic retinopathy.
3. Classify potential lesions into retinopathy and non-retinopathy categories.
4. Determine the image quality and assess gradability of image.
5. Vascular width measurements
6. Classify image into referable and non-referable maculopathy.
These criteria are revisited in chapter 8 and are compared against actual results.
1.4
Thesis Overview
This thesis is structured into a number of chapters, each focusing on a different aspect of background and research. The chapters are summarised as follows:
Chapter 2 - Medical Background: begins by describing the anatomy of the eye, followed by the fundamental causes of diabetes and the associated complications focusing on diabetic retinopathy. The pathological and clinical aspects of the eye disease are mentioned together with an overview
CHAPTER 1. INTRODUCTION 7
of the retinal treatment available. The chapter concludes with discussion on why early screening for diabetic retinopathy is important and why an automated screening system is preferable.
The structure of the following chapters include the Problem Domain and Previous Work, Method, Evaluation and Conclusion for their respective topics: Optic Nerve Head Segmentation, Lesion Detection and Classification, Image Quality Assessment and Vascular Diameter Measure-ment.
Chapter 3 - Optic Nerve Head: describes a novel algorithm for the localization and seg-mentation of the optic nerve head boundary in low-resolution images (about 2011 per pixel). Optic disk localization is achieved using specialized template matching, and segmentation by a deformable contour model. The latter uses a global elliptical model and a local deformable model with variable edge-strength dependent stiffness.
Chapter 4- Fovea Detection & Vascular Segmentation: describes two algorithms presented by previous authors for fovea detection and vessel detection. The algorithms have been incorporated into the overall system and are described for completeness.
Chapter 5- Lesion Detection: introduces techniques to automatically detect lesions suggestive of diabetic retinopathy. This is achieved using peak detection, novel region growing, feature selection and neural network classification.
Chapter 6 - Image Quality Assessment: describes a novel algorithm to quantify the gradability of retinal images. This is achieved by combining the fovea contrast with a weighted contrast between vascular centre pixels and the background.
Chapter 7 - Retinal Vessels: describes a new algorithm to measure the vessel diameter to sub-pixel accuracy. The diameter measurement is based on a two-dimensional difference of Gaussian model, which is optimized to fit a two-dimensional intensity vessel segment.
Chapter 8 - System Evaluation: demonstrates the performance of the integrated system (incor-porating optic disc, fovea, vascular, and lesion segmentation together with image quality assess-ment) in detecting sight threatening diabetic retinopathy. The system evaluated on a per image basis against a variety of criteria and previously published work.
CHAPTER 1. INTRODUCTION 8
Chapter 9- Conclusion: concludes the thesis by reviewing the presented research and discusses its novel contributions. The aforementioned criteria for success are also examined and are com-pared against actual results. Finally, areas for future work are described and their impact in the structured retinal analysis is highlighted.
CHAPTER 1. INTRODUCTION 9
Optic Nerve Head Fovea
MlcroaneLrYSm
Figure 1.3: Fundus Photographs a). Structural components of the retina b). Retina with diabetic retinopathy
CHAPTER 1. INTRODUCTION No Exudate Recognmon v .. Monuoi Ophthalmic Review ' ' I I I I I ... J .·-··-FuturoWorl< -Vonious Boeding Detection j ·· ...
_
··-·_, ... Review 6 or 12 monthsFigure 1.4: Outline of the proposed system for automated detection of maculopathy
Chapter
2
Medical Background
2.1
Introduction
Diabetes is a chronic disease affecting over 2% of the population in the UK [1]. Diabetes can manifest in different systems in the body causing long-term complications to the heart, kidneys, nerves, blood vessels and the eye. In the eye, diabetes can affect various ocular structures such as the lens and the retina. In the retina, diabetes can lead to an eye disease called diabetic retinopathy, which has been identified as one of the leading causes of blindness in the working population of industrialised countries. Persons with diabetes are 29 times more likely to become blind than those without the disease [10].
As the initial phase of the disease is typically asymptomatic, individuals are not usually aware of the risk of developing sight-threatening retinopathy and consequently loss of vision until it is too late. It is therefore crucial that regular retinal examinations are carried out in order to detect the initial onset of the disease before noticeable visual loss occurs.
To reduce the risk of visual loss from diabetic retinopathy, treatment is required at the onset of sight-threatening retinopathy. Early treatment by laser photocoagulation has been shown to significantly reduce the incidence of visual loss [11].
Diabetic retinopathy can be detected by either clinical examination using different methods such as direct ophthalmoscopy, indirect ophthalmoscopy and biomicroscopy; or retinal photography using instant fundus Polaroid photographs, colour fundus 35-mm slides or digital imaging. The
CHAPTER 2. MEDICAL BACKGROUND 12
UK National Screening Committee have suggested that annual screening by digital colour fundal photography is the preferred medium [2]. With 20,000 - 30,000 diabetic patients per million population, manually grading retinal images is a time-consuming and costly process requiring highly skilled staff and is susceptible to subjective variation and error.
This chapter begins with a brief description of the anatomy of the eye, followed by a discussion of the causes and pathological changes of diabetic retinopathy. The clinical features suggestive of diabetic retinopathy are described followed by current methods of diagnosis and treatment of the disease. The chapter is concluded by emphasizing the benefits of automated retinal analysis for digitised retinal photography.
2.2
Anatomy of the Eye
The eye is a complex optical structure that is able to reflect and focus light that stimulates neural responses enabling us to see. The eye is essentially made up from a number of optical components, neural components and supportive layers, see figure 2.1. At the front of the eye is a thin transparent membrane known as the cornea. The cornea has a dual purpose of protecting the eye, and refracting light as it enters the eye. A portion of the light passing through the cornea passes through the pupil, a small opening in front of the lens.
The amount of light that can pass through the pupil is dependant on the size. This is adjusted by contractions of the iris muscles. The iris is a diaphragm that is capable of enlarging and reducing the size of the pupil. In bright light, the iris constricts, reducing the size of the pupil and the amount of light entering the eye. In dim-light the iris dilates, enlarging the pupil size and increasing the amount of light entering the eye. The light then passes through a clear crystalline lens. The lens controls 1/3 of the refraction of light that enters the eye (the cornea, the other 2/3) completing refraction by fine-tuning the focused light onto the retina.
The eye is full of a clear gelatinous substance known as vitreous gel that constitutes 2/3 of the eye volume and it is formed mainly of water and structural proteins. Light refracted from the lens must travel through the vitreous before reaching the retina.
The retina is the innermost membrane that lines the back of the eye. It comprises of multi-layered sensory and pigmentary layers. The retina contains photoreceptions that transform
cap-CHAPTER 2. MEDICAL BACKGROUND 13
Ciliary body
Figure 2.1: Anatomy of the eye, [taken from http:/ jwww.stlukeseye.com/ Anatomy. asp]
tured light rays into electrical nerve impulses. These impulses travel from the light photoreceptors
of the retina along the optic nerve and into the brain's visual cortex for processing. There are two
types of photoreceptors in the retina: rods and cones. The cones, which number approximately 6
million, are primarily located in the central part of the retina called the macula. Cones are highly
sensitive to colour, functioning best in bright light and enable colour vision.
The highest density of cones is situated at the centre of the macular called the fovea. The fovea
is responsible for central, sharp vision and this is largely due to each cone being connected to its
own nerve fibre. The fovea itself is a circular indentation in the retina of approximately l.5mm in
diameter [12] and unlike the peripheral retina the fovea has no blood vessels. See figure 2.2
Approximately 75 to 150 million rods are distributed throughout the peripheral retina. As
several rods are connected to single nerve endings the information discernable from these receptors
is reduced giving peripheral vision. Rods are sensitive to low levels of illumination and receive no
colour information; as a result night vision is colourless.
2.3
Causes
of Diabetic Retinopathy
Diabetes mellitus is a chronic disease triggered by a metabolism disorder resulting in an unhealthy
CHAPTER 2. MEDICAL BACKGROUND 14
Figure 2.2: Anatomy a). Retina. b). Macula, [taken from http:/ jwww.stlukeseye.com/anatomy
/retina.asp and /Macula.asp respectively]
produces glucose that enters the bloodstream where it is used by cells for growth and energy. For
glucose to get into the cells the hormone insulin must be present. When the pancreas does not
secrete enough insulin, the cells do not respond appropriately and glucose builds up in the blood.
The body therefore loses its main source of fuel as it cannot use the glucose present in the blood.
The long-term complications of diabetes affect almost every part of the body. The disease often
leads to heart disease, kidney failure, nerve and blood vessel damage. Damage to the small blood
vessels throughout the body can lead to reduced blood flow. When these changes affect the tiny
blood vessels in the retina of the eye, diabetic retinopathy may develop.
In the early stages of diabetic retinopathy, the tiny retinal vessels weaken and develop ou
t-pouching (microaneurysms), which may burst and leak blood (haemorrhages) and fat (exudates)
into the retina. The leakage may also cause swelling (oedema) of the retina. The weak blood
vessels may also become blocked, starving the retina of nourishment, leading to the growth of new
abnormal vessels in the retina. The new blood vessels are often fragile and can bleed into the eye
or may form scar tissue that pulls on the retina, leading to retinal detachment.
2.4
Pathological Changes of Diabetic Retinopathy
Diabetic retinopathy can be pathologically classified into three principal categories: non-proliferative,
CHAPTER 2. MEDICAL BACKGROUND 15
into three different stages according to its severity.
2.4.1
Non-proliferative Retinopathy
1. Mild Non-proliferative Retinopathy. At the earliest stage, balloon-like swelling occurs in the retina's blood vessels. These swellings are called microaneurysms and may not have any noticeable effect on vision.
2. Moderate Non-proliferative Retinopathy. Disease progression results in a number of blocked blood vessels reducing the nourishment to the retina. The weakened capillaries can lead to retinal haemorrhages, fluid and leakage lipid accumulation (exudates).
3. Severe Non-proliferative Retinopathy. An increased number of blood vessels become blocked, depriving areas of the retina with their blood supply. The deprived retina secretes chemicals such as growth factors; these chemicals can trigger the growth of abnormal new vessels.
2.4.2 Proliferative Retinopathy
At this advanced form of the disease, new, abnormally weak, blood vessels grow on the retinal surface or overlying the optic disk; these vessels extend in the plane between the retinal surface and the posterior surface of the vitreous gel (the clear jelly-like substance that fills the centre of the eye) and acts as a scaffold for its further growth. The abnormal growth of new blood vessels does not support deprived areas of the retina with a new blood supply, instead these vessels may cause other complications:
1. Vitreous haemorrhage. Subsequent contraction of the vitreous gel leads to traction on the fragile new blood vessels that can lead to their avulsion. This results in bleeding either in or behind the vitreous gel with resultant drop of vision. If the amount of bleeding is small only a few dark spots may obscure vision. In severe cause the entire vitreous cavity can fill with blood and subsequently block all vision.
2. Traction retinal detachment. Scar tissue accompanies new blood vessel growth. This scar tissue can contract and pull the retina from the back wall of the eye. This can result in profound visual loss if the macula is involved.
CHAPTER 2. MEDICAL BACKGROUND 16
2.4.3
Maculopathy
Maculopathy can occur in both non-proliferative and proliferative retinopathy and is the common-est cause of visual loss within the diabetic population. Diabetic Maculopathy can be defined as diabetic retinopathy affecting the central macula [13]. The condition can be divided into several subgroups each with a different pattern of disease; focal, diffuse, ischaemic and mixed.
1. Focal maculopathy consists of clusters of microaneurysms from deep or superficial capillary networks associated with focal retinal oedema, and often surrounded by hard exudates. This is due to lipoproteins (seen as hard exudates) being deposited at distal sites where leakage causes a flow of fluids towards normal capillaries for resorption.
2. Diffuse macular oedema occurs from widespread blood-retinal barrier break down and diffuse dilatation of the capillary bed. Hard exudates may not be present and microaneurysms often inconspicuous.
3. Macular ischaemia occurs from capillary closure, often causing deep retinal haemorrhages and cotton wool spots representing nerve fibre layer infarcts and occasionally visibly closed white vessels.
4. Mixed maculopathy contains a combination of all three groups with the full extent visible only on fluorescein angiography [13]. Only focal, diffuse and mixed maculopathies can be treated with laser photocoagulation.
2.5
Clinical Features
As the retinopathy progresses a small number of clinical features appear in the retina. Their characteristics and position in relation to the macula and each other is of great importance when making a diagnosis. There are two types of clinical feature suggestive of diabetic retinopathy: lesions and vascular anomalies. Retinal lesions include haemorrhages and microaneurysms (dark spots), cotton wool spots and exudates (bright spots), and vascular features including venous beading.
1. Microaneurysms. Retinal microaueurysms are the earliest clinically apparent lesion in-dicative of diabetic retinopathy. The number of microaneurysms increases with the severity
CHAPTER 2. MEDICAL BACKGROUND 17
of the retinopathy [14]. A microaneurysm indicates an area of deficient capillary cell wall and localised break of the blood-retinal barrier and may be associated with abnormal vascular leakage [15].
2. Haemorrhages. It is thought that haemorrhages occur from ruptured microaneurysms or weak vascular segments. Haemorrhages vary in appearance more than microaneurysms and are not necessarily round. Haemorrhages can occur in the confinement of the retina or they can spread out on the retinal surface where they take on a flame appearance [15].
3. Exudates. Exudates are frequently associated with clinically significant macular oedema. Previously called hard exudates to distinguish them from soft exudates (now called cotton wool spots), exudates are collections of lipoproteins caused by abnormal vascular leakage. The number of exudates increases as extravascular fluid diminishes due to precipitation of lipids and proteins; this is analogous to a saline solution depositing salt upon drying [15].
4. Cotton Wool Spots. Cotton wool spots are areas of swollen nerve axons caused by a localised obstruction of blood supply in the nerve fibre layer. [15]. They appear as small whitish fluffy superficial lesions that obscure underlying blood vessels and are clinically ev-ident only in the post equatorial retina where the nerve fiber layer is of sufficient thickness to render them visible [16].
5. Venous Beading. Venous beading is an important sign of sluggish retinal circulation. It occurs in the retinal veins in a response to oxygen deficiency, it represents a localised increase in the venous calibre (segmental dilatation), in severe cases it appears as a string of beads 'sausage-like appearance'. Venous beading is indicative of severe non-proliferative retinopathy and is the most significant predictor of proliferative diabetic retinopathy, ie: imminent new vessels development. [15] [?].
Non-diabetic lesions that are commonly rnistaken as Exudates due to their similar visual char-acteristics include Drusen. Drusen are nodules that exist in a layer called Bruch's membrane which lies beneath the retina and the adjacent retina pigment epithelium layer. Drusen are metabolic waste derived from retina pigment epithelium cells RPE. Its accumulation is thought to result from failure to clear the debris discharged into the region. Drusens appear as yellow excrescences
CHAPTER 2. MEDICAL BACKGROUND 18
beneath the RPE distributed symmetrically at both posterior poles. They can vary in number and size. Drusens are rarely clinically visible before the age of 45 years [17] [16].
2.6
Clinical Diagnosis
The diagnosis of diabetic retinopathy is based upon the presence of the various clinical features previously described. The clinical criteria as set by the Early Treatment Diabetic Retinopathy Study Group [11] are used to classify the extent of diabetic retinopathy:
2.6.1
Non-proliferative Diabetic Retinopathy (NPDR)
1. Mild NPDR: Microaneurysms with or without one or more of the following: Intra-retinal hemorrhages, hard exudates away from macula or cotton wool spots
2. Moderate NPDR: Microaneurysms/hemorrhages in at least one quadrant (see figure 2.3) plus one or more of the following: cotton wool spots, intra-retinal microvascular abnormality or venous beading.
3. Severe NPDR: Any one of the following ( 4-2-1 rule): Intra-retinal hemorrhages in 4 quad-rants, venous beading in 2 quadrants and moderately severe intra-retinal microvascular ab-normality in 1 quadrant.
2.6.2
Proliferative Diabetic Retinopathy (PDR)
1. Early PDR: One or more of the following: Neovascularisation of the optic nerve head (also known as optic disc)
<
!
disc diameter. Neovascularisation elsewhere (non-bleeding). Pre-retinal or vitreous hemorrhage and neovascularisation elsewhere<
!
disc diameter without neovascularisation of the optic disc.2. High Risk Characteristics {HR PDR): One or more of the following: Neovascularisation of the optic disc
>
!
disc diameter. Neovascularisation of the optic disc with bleeding. Neovascularisation elsewhere>
!
disc diameter with bleeding.CHAPTER 2. MEDICAL BACKGROUND 19
Figure 2.3: Retinal Quadrants
2. 7
Treatment
Currently there are two forms of treatrnent for diabetic retinopathy: photocoagulation and
vitrec-tomy. Both treatments can be effective in slowing or stopping the progression of the disease for
a time. As diabetes continually weakens the arterioles and capillaries further retinal damage may
occur and additional treatment is required. The decision of which procedure to use depends on
the type and severity of the retinopathy.
2. 7.1
Photocoagulation
In Photocoagulation, a high-energy laser beam creates small burns in the retina areas with abn
or-mal blood vessels. The purpose of photocoagulation is to stop leakage of blood and fluid into the
retina and hence slow the disease's progression. This can be achieved using one of two
photocoag-ulation techniques: focal or panretinal.
1. Focal Photocoagulation. Diabetics with clinically significant macula edema, which is related to leaky capillaries and microaneurysms, are generally recommended to undergo focal
photocoagulation laser treatment. In this procedure, the laser is applied to the macula of
the eye avoiding the fovea and focused on leaking blood vessels creating "spot welds" to stop
the leakage [18]. If the leaks are small in number the treatment is applied directly to specific
CHAPTER 2. MEDICAL BACKGROUND 20
For diabetics diagnosed with clinically significant macula edema the risk of visual loss is reduced by more than 50% when treated by focal photocoagulation; see figure 2.4 a.
2. Panretinal Photocoagulation. For proliferative retinopathy laser panretinal
photocoagu-lation is started promptly after diagnosis of the condition. In this treatment the entire retina
except the macula is exposed to randomly placed laser burns, causing the new abnormal
blood vessels to regress.
Although the risk of vitreous haemorrhage and traction retinal is reduced, some loss in peripheral vision may occur. Panretinal photocoagulation is a trade-off, sacrificing peripheral vision to preserve central vision; see figure 2.4 b.
Diabelic: relinopaJhy
Figure 2.4: Photocoagulation a). Focal b). Panretinal, [taken from http:/ /www.eyemdlink.com/ EyePro-cedttre.asp?EyeProcedureiD=55J
2.7.2
Vitrectomy
If proliferative retinopathy is diagnosed late, one of the abnormal neovessels (neovascular vessel)
may bleed into the vitreous, blocking vision and preventing laser treatment as the blood also blocks the laser. If the haemorrhage does not clear by itself within a few weeks or months, vitrectomy surgery may be performed. See figure 2.5.
In this procedure a surgeon removes the blood-filled vitreous from the eye, the abnormal new
vessels are then dissected. A vitrectomy may also be indicated for the treatment of tractional
retinal detachment. In this case the scar tissue that is pulling the retina away from the eye wall is
CHAPTER 2. MEDICAL BACKGROUND 21
ugnt
y'
Figure 2.5: Vitrectomy, [taken from http:/ /theretina.source.com/conditions/diabetic_ retinopathy.htm]
2.8
Early
Detection
for
Diabetic
Retinopathy
Treatment of diabetic retinopathy can prevent blindness within 90% of patients at risk, if the
disease is caught early enough in its progression [7]. Annual screening is therefore necessary to
detect those at risk before visual loss occurs and when treatment is at its most effective.
At present annual screening for diabetic retinopathy is carried out by general practitioners, optometrists, diabetologists, nurse practitioners, junior physicians and ophthalmologists. The
level of experience and competence between and within these groups has been shown to vary
significantly.
Automating the retinal analysis process to reduce the subjective variation and error would be beneficial to standardise screening. Such a system could have a number of roles in national
screening:
1. Screening tool: highlighting potential lesions with or without classification or overall ref er-able, non-referable classification.
2. Audit tool: Assessing the quality of national screening.
3. Automated screening: producing referable, non-referable recommendations, removing the
need for national screeners. According to national guidelines any screening system should have sensitivity and specificity over 80% and 95% respectively, where sensitivity represents the percentage of true diabetic retinopathy cases detected and specificity represents the
CHAPTER 2. MEDICAL BACKGROUND 22
percentage of non-diabetic retinopathy cases detected.
2.9
Summary
Long-term complications of diabetes can affect different systems of the body including the eye. In the eye, diabetes can affect the retina and lead to an eye disease called diabetic retinopathy which has been identified as one of the leading causes of blindness in the UK. As retinopathy progresses, tiny retinal vessels weaken and may rupture causing a leakage of blood or lipoprotein that may obscure central vision (macula) and may also cause swelling of the retina. The weakened blood vessels may also become malnourished leading to the growth of new fragile vessels that can bleed into the eye and again obscure vision.
Early detection followed by treatment can significantly reduce the risk of blindness. At present diabetic retinopathy is detected manually by either clinical examination or retinal photography. The UK national screening committee have suggested that annual screening by digital photography is the preferred medium. Automating retinal analysis using digitised retinal photography would be beneficial in reducing subjective variation and error and could have a number of roles in national screening; as a screening tool, audit tool or for fully automated screening.
Chapter 3
Optic Nerve Head
3.1
Introduction
This chapter presents a novel algorithm for the automatic localisation and segmentation of the optic nerve head in retinal images. The algorithm automatically selects the general location of the center of the optic nerve head, then fits a contour to the optic nerve head rim. Localization is achieved using a simple but effective specialized filter; segmentation by fitting an active contour to the optic nerve head rim using a three phase global and local deformable model that exploits the specific characteristics of the optic nerve head's appearance. The performance of the algorithm is evaluated against alternative approaches using a set of 100 random images drawn from a diabetic screening programme.
3.1.1
Motivation
Optic nerve head segmentation is a necessary step in this structured analysis for a number of reasons. First, the optic nerve head can itself act as a distractor: it is a large bright region that can be mistaken (by algorithms) for gross circinate exudation; the high-contrast rim also causes false responses to linear blood vessel filters [9]. Second, the vessels radiate from the optic nerve head, so vessel tracking algorithms [19] may start from there. Vessels are of direct importance in assessing vascular condition [20] [21] [22], (explained in more detail in chapter 7). Third, the optic nerve head is important in localisation of the fovea, the central part of the retina that subserves
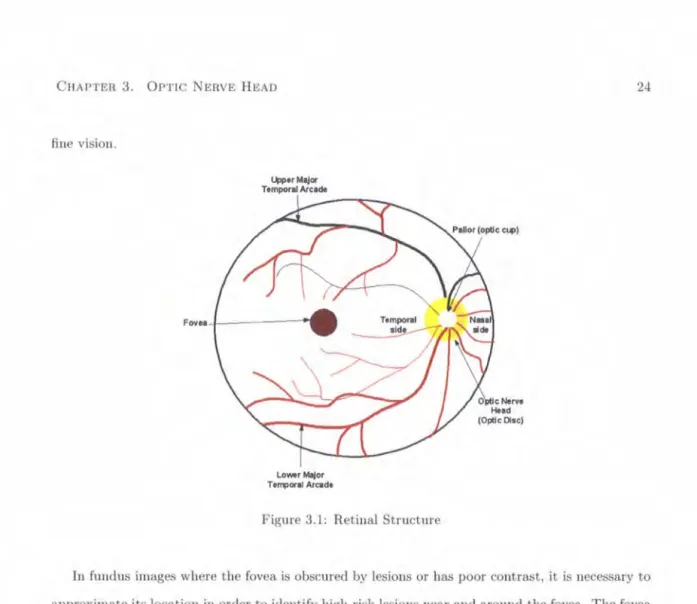
CHAPTER 3. OPTIC NERVE HEAD fine vision. 4>J>orMajor Temporal Arcade Lo-rMojor TefT!>oral Arcade
Figure 3.1: Retinal Structure
24
In fundus images where the fovea is obscured by lesions or has poor contrast, it is necessary to approximate its location in order to identify high-risk lesions near and around the fovea. The fovea is located approximately 2.5 optic disc diameters temporal to the temporal edge of the optic disc and lies between the major temporal retinal vascular arcades (see figure 3.1. Using the positional constraints, the approximate location of the fovea can be calculated and used as a substitute value if the foveal search methods fails, although variation in the optic disc size compromises the reliability of this method. Littmann [23] has developed a technique to explicitly determine the distance from the optic disc's center to the fovea, by correcting for the magnification factors of the fundus camera and the patient's eye. However, the ocular magnification factor depends mainly on anterior corneal curvature, refraction and axial length, which require measuring variables on the patient's eye - an important practical limitation in screening. The method can also give false values in the case of an abnormally high lens refractive power (e.g. by cataract formation) and so is not applicable in aphakic or pseudophacic eyes ( 10% of the diabetic screening population). The "2.5 elise diameters" heuristic method is therefore more practical as absolute accuracy is not required.
CHAPTER 3. OPTIC NERVE HEAD 25
Blood vessels
Optic Dsk
Opnc Cup Optic CUp r - - Neurorennal Rim
Neuroretinal rim
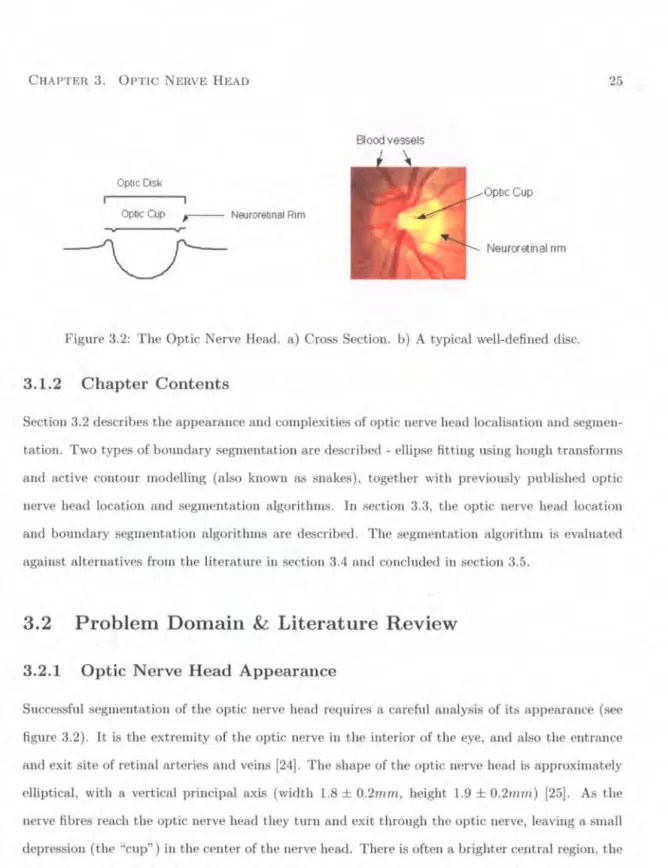
Figure 3.2: The Optic Nerve Head. a) Cross Section. b) A typical well-defined disc.
3.1.2
Chapter Contents
Section 3.2 describes the appearance and complexities of optic nerve head localisation and segmen-tation. Two types of boundary segmentation are described-ellipse fitting using hough transforms and active contour modelling (also known as snakes), together with previously published optic nerve head location and segmentation algorithms. In section 3.3, the optic nerve head location and boundary segmentation algorithms are described. The segmentation algorithm is evaluated against alternatives from the literature in section 3.4 and concluded in section 3.5.
3.2 Problem Domain
&
Literature Review
3.2.1
Optic Nerve Head Appearance
Successful segmentation of the optic nerve head requires a careful analysis of its appearance (see figure 3.2). It is the extremity of the optic nerve in the interior of the eye, and also the entrance and exit site of retinal arteries and veins [24]. The shape of the optic nerve head is approximately elliptical, with a vertical principal axis (width 1.8
±
0.2mm, height 1.9±
0.2mm) [25]. As the nerve fibres reach the optic nerve head they turn and exit through the optic nerve, leaving a smalldepression (the "cup") in the center of the nerve head. There is often a brighter central region, the "pallor", which if present usually includes the cup. The optic disc rim is judged to be the inner margin of the peripapillary scleral ring, seen as a thin white band encircling the optic disc.
In fundal images, the appearance varies quite substantially; see figure 3.3. Although the topol-ogy of the optic disc is standard, there are large variations in the size and shape of the optic nerve
CHAPTER 3. OPTIC NERVE HEAD 26
head, due to variable amounts of glial and connective tissue. The rim is usually visible as a bright boundary with the nasal side usually being less bright than the temporal side, however sometimes the rim is not visible at all. In some images the entire optic nerve head is brighter than the sur-rounding area, appearing as a disc; in others the appearance is of a hollow ring. In either case the pallor may appear as a smaller, brighter disc within the optic disc. There may also be bright areas just outside the rim caused by peripapillary atrophy, either distorting the shape or forming concentric elliptical arcs. To complicate the issue further, departing vessels partially obscure the rim. The majority exit on the nasal side and depart vertically; a smaller number depart nasally, and a few fine vessels depart temporally. Occasionally vessels turn at the nasal rim edge and run vertically, obscuring portions of the optic boundary. A consequence of the nasal distribution of vessels is that the pallor, if visible, is mainly located to the temporal side.
The variability in appearance misleads obvious localisation and segmentation approaches. Large areas of bright diabetic lesions (gross exudation see section 5.2.1), which have high contrast, act as strong distractors for correlation-based localization algorithms - algorithms that work well on images of healthy retina may fail on a screening population. Similar problems arise from reflection artifacts (young patients) and visible choroidal vessels [26).
Segmentation is complicated by the presence of strong distractors along the pallor and vessel edges, weakness of the rim and peripapillary atrophy [27). However, these problems can be over-come by exploiting specific aspects of the appearance: the relative sharpness, reliability and lack of vascular intersections on the temporal side of the rim, and the approximately elliptical shape.
3.2.2
Optic Nerve Head Localisation
Optic Disc Localisation Algorithms
Reliable optic nerve head location is surprisingly difficult, due to its variable appearance; naive approaches that work well for images of healthy retinae often fail on screening images.
Sinthanayothin et al. [25) exploited the rapid intensity variation between the dark vessels and the bright nerve fibres to locate the optic disc. This was achieved by using a 80 x 80 sub-image to calculate the intensity variance of adjacent pixels. An average variance within these sub-images was obtained and the point of largest average variance deemed the optic centre. The sensitivity and specificity of this technique is reported as 99.1% when no significant distractors are present. When
CHAPTER 3. OPTIC NERVE HEAD 27
Figure 3.3: Examples of varing optic nerve head appearance
presented with large cotton wool spots, gross exudation, light artifacts or strongly visible choroidal vessels the algorithm commonly misclassifies the optic disc's location for that of a distractor.
Akita et al. [24], traced the parent-child relationship between blood vessels segments, tracking
back to the center of the optic disc; this presupposes robust detection of the blood vessels, which is difficult in images of diseased retinae where even quite sophisticated algorithms detect false positives along the edges of white lesions and along the edge of the optic nerve head itself [9].
Lalonde et al.[28], used pyramidal decomposition and Hausdorff-based template matching to locate the optic disc. The template-based matching technique is based on a edge map using a Hausdorff distance measure and guided by scale tracking of large objects using multiresolution image decomposition. This method is effective, but computationally demanding.
3.2.3
Optic Nerve Head Boundary Segmentation
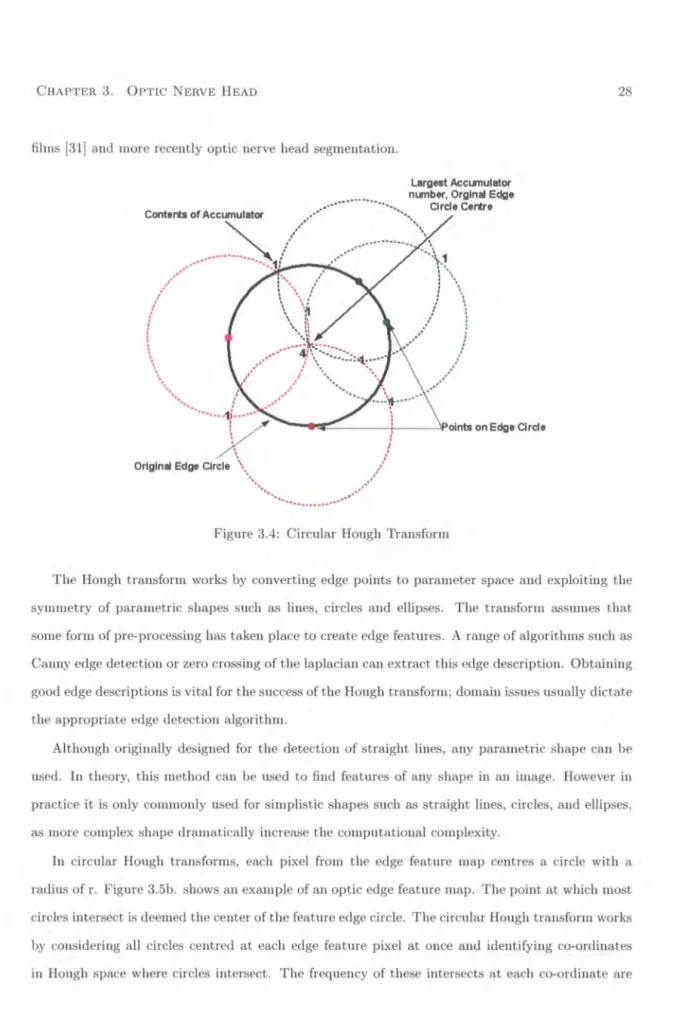
Overview of Circular Hough TransformThe Hough transform is a global, robust technique for the detection of predefined shapes in images [29]. Since patented in 1962, the technique has been successfully employed in a range of domains including the detection of human hemoglobin fingerprints (30], the detection of tumors in chest

![Figure 2.2: Anatomy a). Retina. b). Macula, [taken from http:/ j www.stlukeseye.com/anatomy /retina.asp and /Macula.asp respectively]](https://thumb-us.123doks.com/thumbv2/123dok_us/1294765.2673532/30.799.65.735.100.1105/figure-anatomy-retina-macula-stlukeseye-anatomy-macula-respectively.webp)