This is an Open Access document downloaded from ORCA, Cardiff University's institutional
repository: http://orca.cf.ac.uk/112895/
This is the author’s version of a work that was submitted to / accepted for publication.
Citation for final published version:
Liu, Yong-Jin, Li, Bing-Jun and Lai, Yukun 2018. Sparse MDMO: learning a discriminative feature
for micro-expression recognition. IEEE Transactions on Affective Computing file
Publishers page:
Please note:
Changes made as a result of publishing processes such as copy-editing, formatting and page
numbers may not be reflected in this version. For the definitive version of this publication, please
refer to the published source. You are advised to consult the publisher’s version if you wish to cite
this paper.
This version is being made available in accordance with publisher policies. See
http://orca.cf.ac.uk/policies.html for usage policies. Copyright and moral rights for publications
made available in ORCA are retained by the copyright holders.
Sparse MDMO: Learning a Discriminative
Feature for Micro-Expression Recognition
Yong-Jin Liu,
Senior Member, IEEE,
Bing-Jun Li, Yu-Kun Lai,
Member, IEEE
Abstract—Micro-expressions are the rapid movements of facial muscles that can be used to reveal concealed emotions. Recognizing them from video clips has a wide range of applications and receives increasing attention recently. Among existing methods, the main directional mean optical-flow (MDMO) feature achieves state-of-the-art performance for recognizing spontaneous micro-expressions. For a video clip, the MDMO feature is computed by averaging a set of atomic features frame-by-frame. Despite its simplicity, the average operation in MDMO can easily lose the underlying manifold structure inherent in the feature space. In this paper we propose a sparse MDMO feature that learns an effective dictionary from a micro-expression video dataset. In particular, a new distance metric is proposed based on the sparsity of sample points in the MDMO feature space, which can efficiently reveal the underlying manifold structure. The proposed sparse MDMO feature is obtained by incorporating this new metric into the classic graph regularized sparse coding (GraphSC) scheme. We evaluate sparse MDMO and four representative features (LBP-TOP, STCLQP, MDMO and FDM) on three spontaneous micro-expression datasets (SMIC, CASME and CASME II). The results show that sparse MDMO outperforms these representative features.
Index Terms—Micro-expression, MDMO feature, sparse coding, recognition.
✦
1
I
NTRODUCTIONM
ICRO-EXPRESSIONS are brief and involuntary move-ments of facial muscles, typically lasting for less than 0.5 seconds [1]. Psychological studies have shown that a person may intentionally conceal her/his genuine emotions, but cannot fake expressions [2]. Recognizing micro-expressions from video clips is useful in many applications, including clinical diagnosis, social interaction and national security.The choice of features is critical for micro-expression recognition. A few features have been proposed and they can be broadly divided into two classes: appearance-based
and optical-flow-based. Local binary pattern (LBP) is a clas-sic feature in the first class, which has been successfully applied in image-based macro-expression recognition [3]. An extension of LBP, called local binary pattern from three orthogonal planes (LBP-TOP), is proposed in [4] for macro-expression recognition in video clips. Pfister et al. [5] pro-pose a micro-expression recognition method based on TOP. By introducing local structure information into LBP-TOP, Huang et al. [6] propose spatiotemporal completed local quantization patterns (STCLQP). STCLQP partitions a video clip into blocks and concatenates individual features from all the blocks into an overall feature. However, the dimension of the STCLQP feature may be very large.
The second feature class relies on a robust and accurate
• Y.-J. Liu and B. Li are with the Beijing National Research Center for Information Science and Technology, Department of Computer Science and Technology, Tsinghua University, Beijing, P. R. China.
E-mail: [email protected]
• Y.-K. Lai is with School of Computer Science and Informatics, Cardiff University, UK.
This work was supported in part by the Natural Science Foundation of China (61725204, U1736220, 61521002) the National Key Research and Development Plan (2016YFB1001202) and Royal Society-Newton Advanced Fellowship (NA150431).
optical flow estimation. Histograms of oriented optical flow (HOOF) [7] is an elaborated feature that is originally pro-posed for human action recognition. To apply HOOF for micro-expression recognition, Liu et al. [8] divide the whole facial area into 36 regions of interest (ROIs) based on the fa-cial action coding system [9], and compute a HOOF feature for each ROI, from which a main direction is determined. The main directions of all the ROIs are consolidated into a 72-dimensional feature vector. Finally, the feature vector is averaged over time, leading to a so-called main directional mean optical-flow (MDMO) feature. Facial dynamics map (FDM) [10] is another optical-flow-based feature. Instead of using 36 ROIs as in MDMO, FDM computes a pixel-level alignment for micro-expression sequences. Each sequence is further divided into spatiotemporal cuboids, in which the principal optical flow directions are computed to represent the local facial dynamics. Both MDMO and FDM make use of special properties1 in micro-expressions to optimize the estimated optical flow, such that it is insensitive to illumination changes.
Our study presented in this paper is inspired by two key observations:
• Due to the characteristics of short duration and low intensity, any features depicting micro-expressions are sparse in both temporal and spatial domains [11];
• The feature data is likely to reside on a low-dimensional manifold embedded in a high-dimensional feature space.
Based on these observations, we propose a sparse MDMO feature that preserves the underlying manifold structure and has more discriminating power than the original
1. For example, FDM assumes that most of facial areas in neighboring frames remain motionless, due to very few facial muscles involved in micro-expressions.
MDMO feature. Sparse representations have been widely used for face and facial expression recognition (e.g., [12], [13]). The classic sparse-representation-based classification (SRC) method [12] directly builds a dictionaryD from the entire training set as the concatenation of allkclasses,D=
c1 c2 · · · ck , where ci = vi1 vi2 · · · vin i , vi
j is a vector representing the jth sample image Ij by packing the grayscale values of all the pixels inIj column by column, andniis the number of samples in theith class. SRC does not need an explicit feature extraction scheme and can efficiently handle occlusion and corruption in facial images. However, using all the pixel information in training images may lead to a dictionary of a huge size.
Rather than using a fixed dictionary like the one in SRC, many dictionary learning methods have been proposed to learn an effective dictionary from training data (e.g., [13], [14], [15], [16]). Unsupervised dictionary learning, such as K-SVD [14], works well for image restoration, image compression and denoising. For classification tasks, recent studies can be broadly categorized into two classes. One class is supervised dictionary learning which takes full ad-vantage of class labels of training data. Two representative works are discriminative K-SVD (D-KSVD) [13] and label consistent K-SVD (LC-KSVD) [15]. The other class is to consider the local geometric structure in the sparse data. In many image and vision applications, the sample data in a high-dimensional space is observed to lie on or close to a smooth low-dimensional manifold. By building ak-nearest neighbor graph to encode the local manifold structure, the methods in this class learn a sparse representation that explicitly incorporates the graph Laplacian as a regularizer (e.g., GraphSC in [16]). Some other state-of-the-art methods include [17], [18], [19]. Experimental results demonstrate that graph regularized sparse representations have good discriminating power for classification and have a good scalability to large training data such as those in video applications.
However, trivially applying existing sparse methods such as K-SVD or GraphSC in micro-expression recognition (MER) does not achieve good performance, since these gen-eral sparse models do not consider the special and discrimi-native structure inherent in MER applications. In this paper, we introduce the classic graph regularized sparse coding (GraphSC) [16] into the MDMO feature with the special consideration to preserve an important manifold structure in MER. The key idea is that in the MDMO feature space, the low-dimensional manifold structure of data points can be depicted by their sparsity. We propose a new distance metric to capture this sparsity. By incorporating this new metric into the unsupervised sparse representation GraphSC, the desired sparse MDMO feature can be efficiently computed by the elegant solver to GraphSC.
The main contributions of this paper are:
• A new distance metric in the MDMO feature space is
proposed based on the sparsity of data points. Based on this metric, the manifold structure of data points is revealed.
• The sparse MDMO feature making use of
unsuper-vised learning with sparse coding has the following benefits: it (1) only requires a small amount of
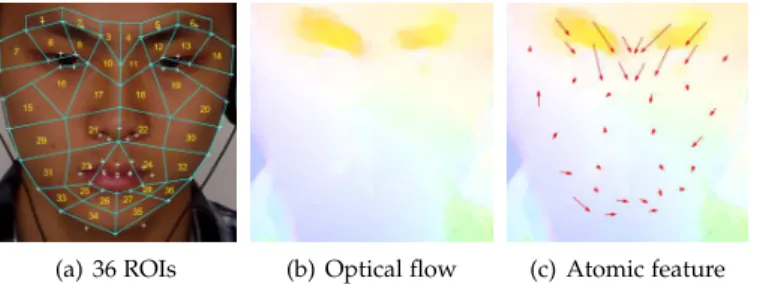
train-(a) 36 ROIs (b) Optical flow (c) Atomic feature Figure 1. (a) The facial area is partitioned into 36 regions of interest (ROIs). (b) Optical flow is computed between this frame and the first frame in the video clip. (c) MDMO represents a frame by an atomic optical flow feature, which is a 72-dimensional vector.
ing data, (2) fits well with MER due to the limited data availability, and (3) can be efficiently computed by the GraphSC solver [16] with the new metric.
• The proposed sparse MDMO feature remains
com-pact but is substantially more discriminative than MDMO, outperforming state-of-the-art features for MER.
Extensive experiments are presented, in which two trivial sparse codings with MDMO, the proposed sparse MDMO and four representative features including MDMO [8], LBP-TOP [4], STCLQP [6] and FDM [10], are evaluated on three spontaneous micro-expression datasets, i.e., SMIC [20], CASME [21] and CASME II [22]. The results show that the proposed sparse MDMO outperforms the existing features.
2
P
RELIMINARIESSince sparse MDMO is based on MDMO [8] and is also closely related to GraphSC [16], we briefly introduce both methods before presenting the sparse MDMO.
2.1 MDMO
Given a micro-expression video clip, i.e., an image sequence
(f1, f2,· · · , fm), the MDMO feature takes the optical flow as the basis, due to its capacity to infer subtle motions by detecting the changing intensity of pixels between two frames. Based on the facial action coding system [9], MDMO partitions the facial area in each frame into 36 regions of interest (ROIs) using 66 facial points (Figure 1(a)). In the first frame f1, these 66 facial points are detected by discriminative response map fitting (DRMF) method [23]. Optical flow is computed between each framefi,i >1, and the first framef1(Figure 1(b)). The facial points infi,i >1, are then determined by the optical flow field.
In each frame fi, i > 1, the optical flow vectors in each ROI Ri
k,k = 1,2,· · · ,36, are categorized into eight orientation bins, and the bin Bmax with the maximum number of optical flow vectors is selected. The so-called
main direction of the optical flow in Ri
k is defined as the average of all optical flow vectors fallen into Bmax, de-noted asuik = (ρi
k, θ i
k), where the optical flow vectors are represented in polar coordinates(ρi, θi), ρi and θi are the magnitude and the direction. MDMO represents each frame
fi,i >1, by an atomic optical flow featureΨi(Figure 1(c)):
Ψi= ui1,ui2,· · ·,ui36
T
The dimension ofΨiis36×2 = 72, where 36 is the number of ROIs. A micro-expression video clipΓcan be represented by a series of atomic optical flow features
Γ = (Ψ2,Ψ3,· · ·,Ψm), (2) wheremis the number of frames in the video clip. Finally, the MDMO feature for the video clip Γis defined as a 72-dimensional vectorΨe, which is a normalized version ofΨ:
Ψ =h ρ1, θ1 T , ρ2, θ2 T ,· · ·, ρ36, θ36 Ti , (3) where ρk, θk = 1 m−1 m X i=2 ui k, k= 1,2,· · ·,36 (4) The 72-dimensional vectorΨe is represented by:
e
Ψ = [αP,(1−α)Θ] (5) where P = [ρe1,ρe2,· · · ,ρe36] is a 36-dimensional row vec-tor, ρek = max{ρ ρk j,j=1,2,···,36}, k = 1,2,· · ·,36, and Θ = θ1, θ2,· · · , θ36
is a 36-dimensional row vector. It was shown in [8] thatα ∈ [0.75,0.98]achieves best results. In all experiments in this paper, we use fixedα= 0.9.
2.2 GraphSC
LetX = [x1,· · ·,xN] ∈ Rd×N be a data matrix, whereN is the number of data points,xi is ad-dimensional column vector denoting theith data point. Sparse coding is to find a sparse representation for each data point, based on a dictionaryD = [d1,· · ·,dn
d] ∈ R
d×nd, which is an over-complete matrix consisting of nd basis vectorsdj,nd > d. The sparse coding problem can be formulated as follows:
min D,Sk X−DSk2 F+λ N X i=1 g(si), s.t.kdik2≤c, i= 1,2,· · · , n d (6)
whereS = [s1,· · · ,sN] ∈ Rnd×N is the coefficient matrix, in which each column vectorsi is a sparse representation for the data pointxi, k · kF denotes the matrix Frobenius norm,gis a function to measure the sparseness ofsi,λis a weight to balance the reconstruction error and sparsity, and
cis a constant imposing a norm constraint for the basis. Directly optimizing the function (6) may lead to a so-lution that ignores the underlying structure in the data set X. To introduce a structure constraint into sparse coding, GraphSC constructs a k-nearest neighbor graph G in the data setX. Each vertex inGis a data point and the edges of
Gare represented by a weight matrixW={wi,j},
wi,j=
1, xj∈ Ni
0, otherwise (7)
where Ni is the set of k-nearest neighbors of xi. To put the structure constraint represented by the graph Gto the sparse representationS, a graph regularization term can be described as: 1 2 X i,j wi,jksi−sjk22 (8)
Eq. (8) can be rewritten in the matrix form using the Lapla-cian matrixLasT r(SLST), whereT r(·)is the matrix trace,
L=Σ−W,Σ=diag(σ1, σ2,· · · , σN)andσi=PN j=1wi,j is the degree ofxi in G. GraphSC optimizes the following objective function by incorporating the graph regularization term (Eq. 8) into the original sparse coding (Eq. (6)):
min D,Sk X−DSk2 F +wgT r(SLST) +λ N X i=1 ksik1 s.t.kdik2≤c, i= 1,2,· · ·, nd (9)
where wg is a regularization parameter and GraphSC chooses ksik1 for the functiong(si) in Eq. (6). An elegant numerical solver is proposed in [16] to find an optimal solution in Eq. (9) for bothDandS.
3
S
PARSEMDMO F
EATUREObserving that any features depicting micro-expressions are sparse [11], we propose a sparse representation for the MDMO feature, which considers the manifold structure of sparse data in the MDMO feature space and therefore is more discriminative than the original MDMO feature.
3.1 Overview
Let Π = {Γ1,Γ2,· · ·,Γnclips} be a given micro-expression video dataset consisting of nclips video clips. In MDMO, each video clipΓi is represented bymi−1 atomic optical flow features (ref. Eq. (2)), wheremiis the number of frames in Γi. We collect all atomic features in Π and consolidate them into a data matrixX∈R72×N:
X=Γ1,Γ2,· · · ,Γn clips =hΨ1 1,Ψ12,· · ·,Ψ nclips mnclips−1 i (10) where the number of data points N = Pnclips
i=1 (mi −1). Whenever there is no risk of confusion,Γi is also used as a sub-matrix Γi= Ψi1,Ψi2,· · ·,Ψimi−1 ∈R72×(mi−1) (11) Applying the objective function in Eq. (6) with Eq. (10) can learn a sparse representationSand a dictionary Dfor the data setXdepicting in Eq. (10). However, our experiments in Section 4 show that this trivial implementation does not achieve the best performance of sparse representation.
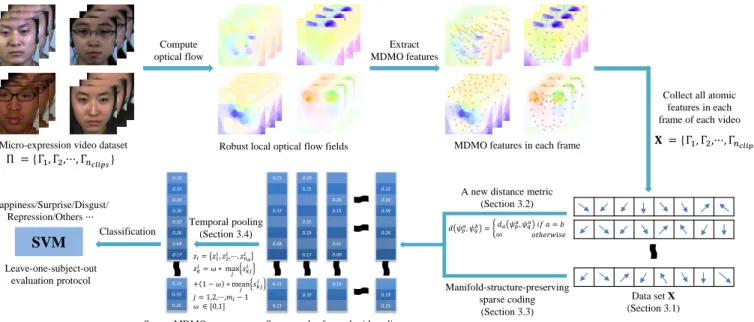
Our key observation is that the data points contained in Xreside on multiple low-dimensional manifolds embedded in R72×N. The simple average operation in MDMO (ref. Eq. (4)) can easily lose this underlying manifold structure and most of dynamic details. To overcome this limitation in MDMO, in Section 3.2, we propose a new distance metric in the MDMO feature space based on the sparsity of the data. With the aid of this new metric, the manifold structure in X is revealed and in Section 3.3, a manifold-structure-preserving sparse coding method is proposed by incorporating the new metric into the GraphSC. Finally in Section 3.4, a temporal pooling is applied to the sparse representation of X, leading to a concise sparse MDMO feature. Both MDMO and sparse MDMO are vector rep-resentations, and thus, the same SVM classifier with the polynomial kernel used in [8] can be applied. In Section 4, experimental results are presented, demonstrating that our proposed sparse MDMO outperforms the original MDMO and several other representative micro-expression recogni-tion features. The overview of our proposed sparse MDMO feature is illustrated in Figure 2.
Compute optical flow
Micro-expression video dataset
Data set X (Section 3.1) A new distance metric
(Section 3.2) Manifold-structure-preserving sparse coding (Section 3.3) 0.15 0.37 0.68 0.11 0.23 0.19 0.25 0.55 0.19 0.17 0.33 0.26 0.15 0.61 0.09 0.14 0.15 0.33 0.39 0.26 0.19 0.25
Sparse codes for each video clip Temporal pooling (Section 3.4) 0.19 0.25 0.33 0.39 0.55 0.26 0.68 0.17 0.14 0.33 0.25 Sparse MDMO Classification SVM Happiness/Surprise/Disgust/ Repression/Others··· Leave-one-subject-out evaluation protocol Extract MDMO features
Robust local optical flow fields MDMO features in each frame
Collect all atomic features in each frame of each video
Π ={Γ , Γ ,···, Γ�����} � ={Γ , Γ ,···, Γ�����} , = , = ∞ � ℎ � � = � , � ,···, �� � = ∗ max + − ∗ mean = , ,···,� − ∈ [ , ]
Figure 2. Overview of the proposed MER system with sparse MDMO features.
3.2 A new distance metric
The structure inherent in the data setX∈R72×N (Eq. (10)) is two-fold:
• in the MDMO feature space, the sample points
from each micro-expression category form a low-dimensional manifold, and
• different micro-expression categories contribute to
multiple low-dimensional manifolds.
To reveal the above manifold structure, we propose a local distance metric, which is defined in a subspace for each video clipΓi∈Π(ref. Eq.(13)), such that in the same micro-expression category, distance is smaller for more relevant features. We then assemble local distance metrics into a global distance metric (ref. Eq.(14)), such that the distance between sample points from different micro-expression cat-egories is infinity.
To define the local distance metric, For each data point
Ψi
j in the sub-matrix Γi (Eq. (11)), we solve the following sparse representation problem:
minkγjk1 s.t.Ψij=Bijγj (12) where Bi
j is the basis matrix containing all the remaining pointshΨi
1,· · ·,Ψij−1,Ψij+1,· · ·,Ψimi−1
i
inΓi. Eq. (12) can be solved by the LARS-Lasso method [24]. Note that thekth element γj(k) in the vector γj, which corresponds to the
point Ψi
k, represents the contribution of Ψik to reconstruct
Ψi
j. Obviously, the higher γj(k) is, the more similar Ψij and Ψi
k are. Since we use γj(k) for similarity measure, a nonnegativity constraint is imposed for all γj(k). Let
Υi= γ1,γ2,· · ·,γmi−1. We normalizeΥiby settingΥi= Υi/kΥikF = γ1,γ2,· · ·,γmi−1 . Note that0≤γj(k)≤1, ∀j, k.
Based on the similarity measure γj(k), we propose the
local distance metricdi(·)for points inΓias:
di(Ψij,Ψik) = ( 0 ifj=k 1 γj(k)+γk(j) 2 +1 otherwise (13)
The bias 1 in the denominator is added to handle the case that bothγj(k)andγk(j)are zero. Then for all data points
inX(Eq. (10)), the global metric is defined by
d(Ψa
p,Ψbq) =
da(Ψap,Ψaq) ifa=b
∞ otherwise (14)
Property 1. The distanced(·)defined in Eq. (14) is a metric. Proof. We consider the case that two pointsp1andp2are in the same setΓi and the other case can be proved trivially. First, by definition, we have
• d(p1, p2) =d(p2, p1)and
• d(p1, p2) = 0, if and only ifp1=p2.
Second, if p1 6= p2, we have 0.5 ≤ d(p1, p2) ≤ 1, since
0 ≤ γj(k) ≤ 1, ∀j, k, in Eq. (13). Lastly, we show the
triangle inequality. Since 0.5 ≤ d(p1, p2) ≤ 1 and 0.5 ≤
d(p2, p3) ≤1, we have1 ≤ d(p1, p2) +d(p2, p3) ≤ 2, and thus, d(p1, p3) ≤ d(p1, p2) +d(p2, p3). That completes the proof.
3.3 Manifold-structure-preserving sparse coding
GraphSC (ref. Eq. (9)) relies on a weight matrixWthat en-codes ak-nearest neighbor graphG. To explore the manifold structure of data points inX, we build the graphGusing the metric defined in Eq. (14). Accordingly, the resulting weight matrixWhas a block diagonal structure:
W= W1 W2 . .. Wn clips (15)
where the sub-matrix Wi is constructed by applying the
k-nearest neighbor method to the video clip Γi using the metric in Eq. (13). We apply the optimization scheme in [16] to solve Eq. (9) with the weight matrix in Eq. (15), from which the optimal dictionaryDand the manifold-structure-preserving sparse representationSare obtained.
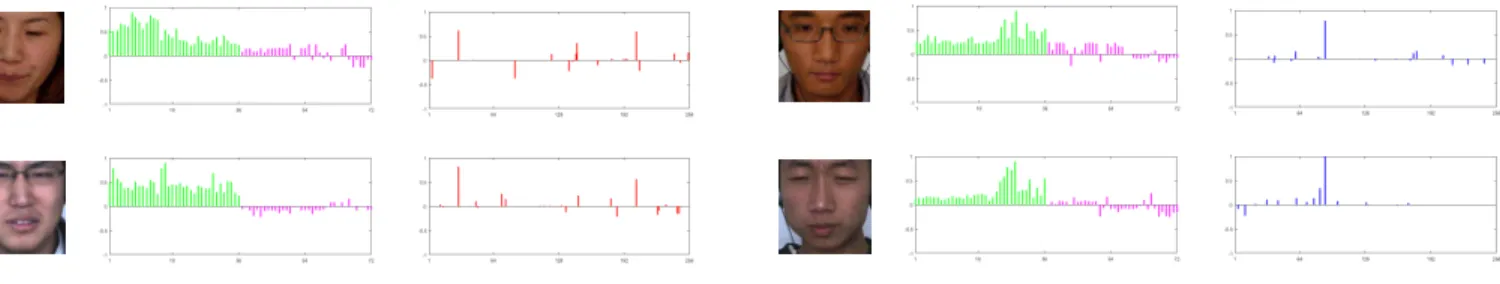
Disgust The original MDMO feature The sparse MDMO feature Repression The original MDMO feature The sparse MDMO feature Figure 3. Two representative micro-expressions (disgust and repression), each of which contains two example video clips from the CASME dataset. For each of four video clips, its original MDMO and sparse MDMO features are illustrated. Note that sparse MDMO features show higher similarity for the same micro-expression than the original MDMO features.
3.4 Temporal pooling
Given the sparse representation S for the video set Π, a micro-expression video clip Γi ∈ Π can be represented by a coefficient matrix Si = {si
kj} ∈ Rnd×(mi−1), where
nd is the size of the dictionary. To maintain the simplicity of MDMO in sparse MDMO, biologically-inspired pooling operations [25] can be applied, which further make the feature invariant to small translations and thus more robust. A pooling function replaces a pool of scale values {si
kj},
j = 1,2,· · · , mi−1, by a summary statistic; e.g., the max and the average poolings are two representative functions. We use a mixed pooling strategy to obtain a vector repre-sentationzifor the video clipΓi:
zi={zi 1, zi2· · ·, znid}, zi k =ωmaxj{sikj}+ (1−ω)meanj{sikj}, j = 1,2· · · , mi−1 (16)
where the parameter ω ∈ [0,1] is optimized in Section 4. We call the vector zi the sparse MDMO feature for the video clipΓi. Figure 3 illustrates four examples of sparse MDMO features with the comparison to the original MDMO features, showing that sparse MDMO features have higher similarity for the same micro-expression than the original MDMO features.
3.5 Computational complexity
The computational complexity of computing sparse MDMO features includes three parts:
• compute and collect all atomic optical flow features inΠ, which takesO(nclipskfmp)time [8], [26];
• build thek-nearest neighbor graphGusing the
met-ric (14), which takesO(nclipsk2f.2)[24];
• GraphSC optimization and temporal pooling take
O(nclipskfnd)time [16], [27];
wherenclipsis the number of video clips in the dataset,kf is the number of frames in each clip,mp is the number of pixels in each frame andndis the size of dictionary.
4
E
XPERIMENTSWe implement the proposed sparse MDMO feature in MAT-LAB R2016a and the source code is available2. Three sparse
versions of MDMO feature are compared:
2. http://cg.cs.tsinghua.edu.cn/people/∼Yongjin/Yongjin.htm
• BasicSC-MDMO: this feature is trivially obtained by
optimizing the objective function in Eq. (6) with the data matrixXin Eq. (10) and the function g(si) =
ksik1, followed by the temporal pooling in Section 3.4.
• GraphSC-MDMO: this feature is trivially obtained by optimizing the objective function in Eq. (9) with the data matrixX in Eq. (10) and using the Euclidean distance metric to construct thek-nearest neighbor graphG, followed by the temporal pooling in Section 3.4.
• Sparse MDMO, this feature is obtained by optimizing
the objective function in Eq. (9) with the data ma-trixXin Eq. (10) and using the manifold-structure-preserving distance metric in Eq. (14) to construct the k-nearest neighbor graph G, followed by the temporal pooling in Section 3.4.
We compare these sparse features with four representa-tive MER features, including two (LBP-TOP [4] and STCLQP [6]) from the appearance-based class and two (MDMO [8] and FDM [10]) from the optical-flow-based class. In partic-ular, we implement two versions of LBP-TOP feature:
• LBP-TOP: it is the original LBP-TOP feature applied to the entire facial region;
• LBP-TOP-ROIs: it is a combinatorial LBP-TOP
fea-ture, constructed by applying the LBP-TOP feature in each of 36 ROIs and consolidating them into one feature.
All aforementioned features are compared on three spon-taneous micro-expression datasets, including SMIC [20], CASME [21] and CASME II [22]. In our experiments, leave-one-subject-out (LOSO) cross validation is applied for subject-independent evaluation, i.e., in each fold, one subject is used as the test set, and the others are used as the training set. Afternfolds, wherenis the number of subjects in the dataset, each subject has been used as the test set once, and the final recognition accuracy was calculated based on all of the results. In addition to LOSO cross validation, other commonly used metrics including precision, recall and F1 rate are also evaluated. LIBSVM [28] with the polynomial kernel is used for multiclass classification, i.e., for a dataset withkclasses,k(k−1)/2classifiers are constructed, each of which is used to train data from two classes.
Feature
Dictionary sizend
SMIC CASME CASME II
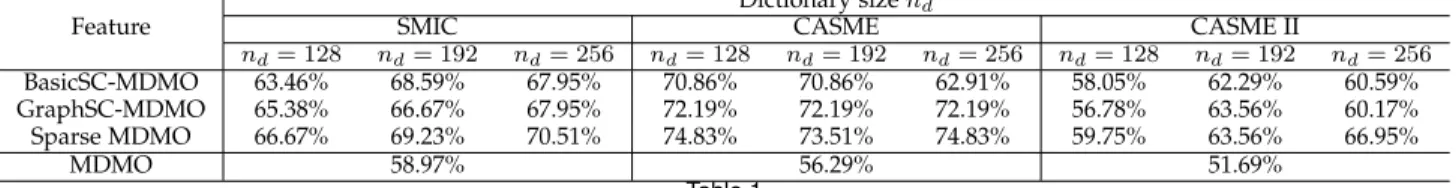
nd= 128 nd= 192 nd= 256 nd= 128 nd= 192 nd= 256 nd= 128 nd= 192 nd= 256 BasicSC-MDMO 63.46% 68.59% 67.95% 70.86% 70.86% 62.91% 58.05% 62.29% 60.59% GraphSC-MDMO 65.38% 66.67% 67.95% 72.19% 72.19% 72.19% 56.78% 63.56% 60.17% Sparse MDMO 66.67% 69.23% 70.51% 74.83% 73.51% 74.83% 59.75% 63.56% 66.95% MDMO 58.97% 56.29% 51.69% Table 1
In sparse MDMO representations, the average LOSO recognition rates in three spontaneous micro-expression datasets are not sensitive to different dictionary sizes; their results are all better than the results from the original MDMO feature.
61% 10% 12% 29% 66% 23% 10% 24% 65% Positive Negative Surprise
Positive Negative Surprise
(a) STCLQP 48% 14% 13% 44% 73% 38% 8% 14% 50% Positive Negative Surprise
Positive Negative Surprise
(b) MDMO 70% 17% 13% 20% 70% 15% 10% 14% 73% Positive Negative Surprise
Positive Negative Surprise
(c) Sparse MDMO
Figure 4. The confusion matrices of STCLQP, MDMO and sparse MDMO on the SMIC datset. MDMO has the best performance for recognizing
negativemicro-expression. Sparse MDMO has the best performance for recognizing the other two micro-expressions and has the best average performance over three classes.
4.1 Parameter setting
The three sparse versions of MDMO feature have the same vector representation as the original MDMO feature. So they can be used in the same recognition process as that in MDMO. The parameters in our proposed method are specified as follows:
• the size of dictionarynd, the regularization
parame-terwg, the sparsity balance weightλand the pool-ing parameterω: these parameters are optimized by five-fold cross validation with the candidate values
{128,192,256} for nd,{0.01,0.1,1,10,100} for wg, {0.1,0.2,0.3,0.4,0.5}forλand{0.01i}100
i=0forω.
• the number of nearest neighbors k: following [16],
we setk= 5empirically;
In practice, our sparse representations are not sensitive to these parameters. Table 1 summarizes the results of three sparse MDMO representations with three dictionary sizes
nd = 128,192and256on three datasets. As a comparison, the results of the original MDMO feature are also summa-rized in Table 1. The results show that for all three dictionary sizes, the sparse MDMO representations are all better than the original MDMO feature. The results summarized in Table 2 demonstrate that the performance of sparse MDMO is stable with the parameterkin the range of 3 to 7.
Furthermore, we use the optimal parameters specified in [8] for MDMO and LBP-TOP-ROIs, the optimal parameters specified in [6] for STCLQP and LBP-TOP, and the optimal parameters specified in [10] for FDM.
4.2 Experimental results
Evaluation on SMIC.The SMIC dataset [20] has three subsets and we take the largest subset SMIC-HS in our experiment. SMIC-HS contains 164 spontaneous micro-expression video
Dataset k= 3 the number of nearest neighborsk= 4 k= 5 k= 6 k= 7 SMIC 70.51% 69.87% 70.51% 70.51% 71.79% CASME 74.83% 74.17% 74.83% 74.17% 73.51% CASME II 64.83% 65.68% 66.95% 63.98% 63.16%
Table 2
The average LOSO recognition rates of sparse MDMO in three spontaneous micro-expression datasets are stable with the number of
nearest neighborskin the range of[3,7].
clips recorded from 16 subjects in three classes: positive, negative and surprise. All video data were recorded by a high speed camera of 100 fps with640×480resolution. We follow [29] to optimize the normalized frame number to 20 for each clip using the temporal interpolation model (TIM). The LOSO recognition rates of eight features, averaged over three classes, are summarized in Table 3. The results show that in previously existing features, the best appearance-based feature is STCLQP, whose average recognition rate is 64.02%, and the best optical-flow feature is MDMO, whose average recognition rate is 58.97%. The sparse represen-tations of the MDMO feature improve the performance and the sparse MDMO is the best sparse MDMO feature (70.51%), demonstrating that manifold-preserving sparse coding with our proposed new metric (Eq. (14)) achieves good discriminating power for classification. We further compare the confusion matrices of STCLQP, MDMO and sparse MDMO in Figure 4. The results show that MDMO has the best performance for recognizing negative micro-expression; while sparse MDMO has the best performance for recognizing the other two micro-expressions and has the best average performance over three classes.
Evaluation on CASME.The CASME dataset [21] contains 195 spontaneous micro-expression video clips recorded from 20 subjects in seven classes. Since the three classes
Feature SMIC CASME CASME II
LOSO P R F1 LOSO P R F1 LOSO P R F1
LBP-TOP 53.66% 53.62% 53.69% 53.65% 37.43% 36.35% 30.14% 32.96% 46.46% 41.52% 30.87% 35.41% LBP-TOP-ROIs 51.28% 50.54% 49.38% 49.95% 53.64% 56.64% 45.87% 50.69% 44.49% 40.88% 30.28% 34.79% STCLQP 64.02% 64.69% 64.06% 64.37% 57.31% 56.30% 56.06% 56.18% 58.39% 59.95% 55.18% 57.47% FDM 54.88% 55.63% 52.74% 54.17% 56.14% 57.36% 52.82% 54.99% 45.93% 43.32% 29.63% 35.19% MDMO 58.97% 60.08% 56.91% 58.45% 56.29% 58.17% 53.09% 55.51% 51.69% 52.24% 47.33% 49.66% BasicSC-MDMO 68.59% 70.03% 68.08% 69.04% 70.86% 70.31% 65.63% 67.89% 62.29% 64.82% 58.56% 61.53% GraphSC-MDMO 67.95% 68.03% 68.87% 68.44% 72.19% 76.87% 68.35% 72.36% 63.56% 65.01% 62.34% 63.64% Sparse MDMO 70.51% 70.09% 70.73% 70.41% 74.83% 77.59% 72.54% 74.98% 66.95% 69.81% 68.42% 69.11% Table 3
Average LOSO recognition rates, precision (P), recall (R) andF1metrics of different features in three spontaneous micro-expression datasets.
The best result for each dataset is shown in bold.
64% 25% 16% 19% 7% 50% 8% 3% 7% 10% 53% 20% 23% 15% 24% 58% Disgust Surprise Repression Tense
Disgust Surprise Repression Tense
(a) STCLQP 49% 7% 14% 13% 0% 47% 6% 5% 5% 0% 49% 13% 46% 47% 31% 68% Disgust Surprise Repression Tense
Disgust Surprise Repression Tense
(b) MDMO 66% 7% 3% 5% 2% 67% 0% 2% 5% 13% 74% 10% 27% 13% 23% 83% Disgust Surprise Repression Tense
Disgust Surprise Repression Tense
(c) Sparse MDMO
Figure 5. The confusion matrices of STCLQP, MDMO and sparse MDMO on the CASME dataset. Sparse MDMO has the best performance for recognizing each of four micro-expressions.
56% 3% 8% 22% 5% 6% 38% 0% 11% 19% 3% 0% 72% 0% 0% 6% 2% 4% 37% 1% 28% 58% 16% 30% 75% Happiness Disgust Surprise Repression Others
Happiness Disgust Surprise Repression Others
(a) STCLQP 55% 3% 5% 11% 9% 0% 45% 0% 4% 18% 3% 6% 55% 0% 1% 0% 5% 0% 15% 7% 42% 41% 41% 70% 65% Happiness Disgust Surprise Repression Others
Happiness Disgust Surprise Repression Others
(b) MDMO 65% 6% 0% 7% 10% 0% 52% 23% 4% 11% 3% 5% 68% 0% 0% 0% 0% 0% 81% 5% 32% 38% 9% 7% 74% Happiness Disgust Surprise Repression Others
Happiness Disgust Surprise Repression Others
(c) Sparse MDMO
Figure 6. The confusion matrices of STCLQP, MDMO and sparse MDMO on the CASME II dataset. STCLQP has the best performance for recognizingsurpriseandothersmicro-expressions. Sparse MDMO has the best performance for recognizing all other three micro-expressions.
of happiness, fear and sadness contain very few samples, we chose the remaining four classes in our experiment: disgust, surprise, repression and tense. All video data in CASME were recorded by a 60 fps camera with1280×720
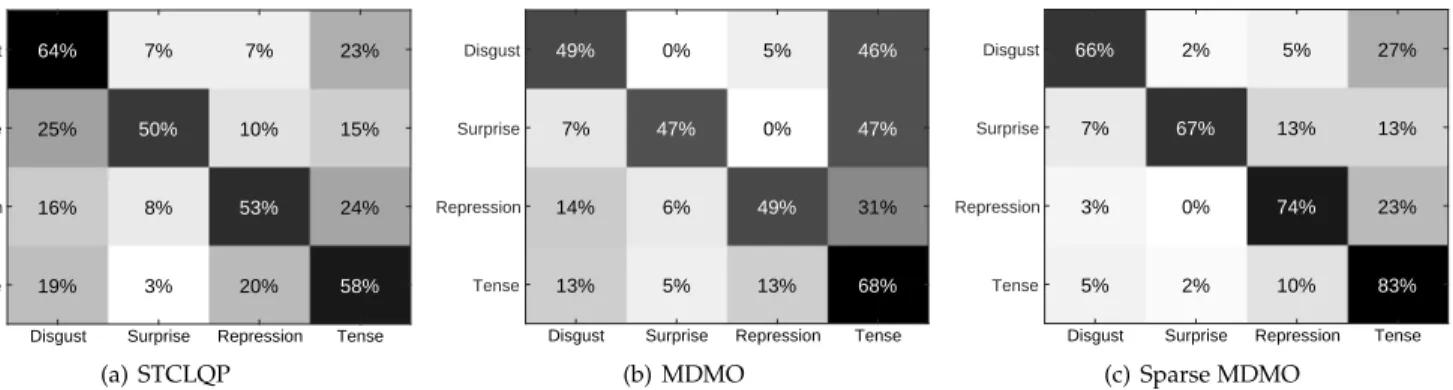
resolution. We follow [29] to optimize the normalized frame number to 64 for each clip using TIM. The LOSO recog-nition rates of eight features, averaged over four classes, are summarized in Table 3. The results show that in previ-ously existing features, the best appearance-based feature is STCLQP (57.31%), and the best optical-flow feature is MDMO (56.29%). All three sparse representations of the MDMO feature improve the performance and the best sparse MDMO feature is sparse MDMO (74.83%). These results are consistent with those in SMIC. We further com-pare the confusion matrices of STCLQP, MDMO and sparse MDMO in Figure 5. The results show that sparse MDMO has the best performance for recognizing each of four micro-expressions.
Evaluation on CASME II. The CASME II dataset [22] contains 246 spontaneous micro-expression video clips recorded from 26 subjects in five classes: happiness, sur-prise, disgust, repression and others. All video data in CASME II were recorded by a high speed camera of 200 fps with 640×480 resolution. The cropped facial area in each video frame is only of 170×140. We follow [29] to optimize the normalized frame number to 90 for each clip using TIM. The LOSO recognition rates of eight features, averaged over five classes, are summarized in Table 3. The results show that in existing features, the best appearance-based feature is STCLQP (58.39%), and the best optical-flow feature is MDMO (51.69%). Consistent with SMIC and CASME, on CASME II, all three MDMO-based sparse rep-resentations improve the performance and the best sparse MDMO feature is sparse MDMO (66.95%). We further com-pare the confusion matrices of STCLQP, MDMO and sparse MDMO in Figure 6. The results show that STCLQP has the
best performance for recognizingsurpriseandothers micro-expressions, while sparse MDMO has the best performance for recognizing other three micro-expressions and has the best average performance over five classes.
We note that micro-expression labels in [8] are grouped in a non-standard manner; e.g., four classes of positive, negative, surprise and other are used for CASME II in [8], but in the original CASME II dataset [22], five classes of happiness, surprise, disgust, repression and other are used. In this paper, to facilitate comparison with state-of-the-art methods, we use the standard labels from the original datasets, and thus the results of MDMO and LBP-TOP are different from [8].
Statistical significance. The Friedman test is the non-parametric alternative to the one-way ANOVA with re-peated measures and is used to detect differences in treat-ments across multiple test attempts [30]. We performed the Friedman test for statistical significance measurement, since it is suitable for comparing multiple algorithms on different datasets. To reduce randomness, 10-fold cross validation was run 10 times on all the three datasets. We compare sparse MDMO with original MDMO, BasicSC-MDMO and GraphSC-MDMO. The differences between these features were all statistically significant (p < 0.001). In statistics, the Nemenyi test is a post-hoc test intended to find the groups of data that differ after performing the Friedman test [31]. In our case, a follow-up Nemenyi test showed that the mean ranking of original MDMO, BasicSC-MDMO, GraphSC-MDMO and sparse MDMO were 3.613, 2.235, 2.278 and 1.873 (where 1 is the best and 4 is the worst), and the improvement of sparse MDMO over GraphSC-MDMO
(p < 0.001), and all three sparse features over the original
MDMO (all withp <0.001) were statistically significant.
4.3 Comparison with other state of the art
We further compare sparse MDMO with [29], which uses an appearance-based feature calledHIGOand has state-of-the-art performance (LOSO recognition rate 65.24% for SMIC and 57.09% for CASME II). Their results show that even TIM and Eulerian motion magnification can significantly improve the HIGO performance (68.29% for SMIC and 67.21% for CASME II), sparse MDMO still has comparable performance (70.51% for SMIC and 66.95% for CASME II).
Different from designing elaborate artificial features for MER, recently blossoming deep learning methods can au-tomatically learn effective features in a multi-layer style. Some pioneering works [32], [33], [34] have applied deep learning methods to MER. However, their performances (LOSO recognition rates are 47.3%, 60.98% and 59.47% for CASME II, respectively) are inferior to the performance of sparse MDMO (66.95% for CASME II).
5
C
ONCLUSIONIn this paper, we propose an effective sparse representation that learns a discriminative feature called sparse MDMO
for spontaneous micro-expression recognition. To introduce sparsity into the original MDMO feature, we construct a data set X that contains all the atomic optical flow fea-tures in video frames. We further propose a new distance
metric (Eq.(14)) in the MDMO feature space, such that the underlying manifold structure inherent in X can be revealed. By incorporating this new metric into the clas-sic GraphSC scheme, an efficient sparse representation for micro-expression recognition is built and the concise sparse MDMO feature is obtained by applying temporal pooling to this sparse representation. Experimental results on three spontaneous micro-expression datasets (SMIC, CASME and CASME II) show that sparse MDMO outperforms the state-of-the-art features including LBP-TOP, STCLQP, MDMO and FDM.
R
EFERENCES[1] W.-J. Yan, Q. Wu, J. Liang, Y.-H. Chen, and X. Fu, “How fast are the leaked facial expressions: The duration of micro-expressions,”
Journal of Nonverbal Behavior, vol. 37, no. 4, pp. 217–230, 2013. [2] M. Iwasaki and Y. Noguchi, “Hiding true emotions:
micro-expressions in eyes retrospectively concealed by mouth move-ments,”Scientific Reports, vol. 6, p. 22049, 2016.
[3] C. Shan, S. Gong, and P. W. McOwan, “Facial expression recog-nition based on local binary patterns: A comprehensive study,”
Image Vision Comput., vol. 27, no. 6, pp. 803–816, 2009.
[4] G. Zhao and M. Pietik¨ainen, “Dynamic texture recognition using local binary patterns with an application to facial expressions,”
IEEE Trans. Pattern Analysis and Machine Intelligece, vol. 29, no. 6, pp. 915–928, 2007.
[5] T. Pfister, X. Li, G. Zhao, and M. Pietik¨ainen, “Recognising spon-taneous facial micro-expressions,” inIEEE International Conference on Computer Vision (ICCV), 2011, pp. 1449–1456.
[6] X. Huang, G. Zhao, X. Hong, W. Zheng, and M. Pietik¨ainen, “Spontaneous facial micro-expression analysis using spatiotempo-ral completed local quantized patterns,”Neurocomputing, vol. 175, pp. 564–578, 2016.
[7] R. Chaudhry, A. Ravichandran, G. Hager, and R. Vidal, “His-tograms of oriented optical flow and binet-cauchy kernels on non-linear dynamical systems for the recognition of human actions,” in
IEEE Conference on Computer Vision and Pattern Recognition (CVPR), 2009, pp. 1932–1939.
[8] Y.-J. Liu, J.-K. Zhang, W.-J. Yan, S.-J. Wang, G. Zhao, and X. Fu, “A main directional mean optical flow feature for spontaneous micro-expression recognition,” IEEE Trans. Affective Computing, vol. 7, no. 4, pp. 299–310, 2016.
[9] P. Ekman and W. V. Friesen,Facial action coding system: A technique for the measurement of facial movement. CA: Consulting Psycholo-gists Press, 1978.
[10] F. Xu, J. Zhang, and J. Wang, “Microexpression identification and categorization using a facial dynamics map,”IEEE Trans. Affective Computing, vol. 8, no. 2, pp. 254–267, 2017.
[11] A. C. L. Ngo, J. See, and C.-W. R. Phan, “Sparsity in dynamics of spontaneous subtle emotion: Analysis & application,”IEEE Trans. Affective Computing, DOI:10.1109/TAFFC.2016.2523996, 2017. [12] J. Wright, A. Y. Yang, A. Ganesh, S. S. Sastry, and Y. Ma, “Robust
face recognition via sparse representation,” IEEE Trans. Pattern Analysis and Machine Intelligence, vol. 31, no. 2, pp. 210–227, 2009. [13] Q. Zhang and B. Li, “Discriminative k-svd for dictionary learning
in face recognition,” in IEEE Conference on Computer Vision and Pattern Recognition (CVPR), 2010, pp. 2691–2698.
[14] M. Aharon, M. Elad, and A. Bruckstein, “K-SVD: An algorithm for designing overcomplete dictionaries for sparse representation,”
IEEE Trans. Signal Processing, vol. 54, no. 11, pp. 4311–4322, 2006. [15] Z. Jiang, Z. Lin, and L. S. Davis, “Label consistent K-SVD: learning
a discriminative dictionary for recognition,” IEEE Trans. Pattern Analysis & Machine Intelligence, vol. 35, no. 11, pp. 2651–2664, 2013. [16] M. Zheng, J. Bu, C. Chen, C. Wang, L. Zhang, G. Qiu, and D. Cai, “Graph regularized sparse coding for image representation,”IEEE Trans. Image Processing, vol. 20, no. 5, pp. 1327–1336, 2011. [17] S. Gao, I. W.-H. Tsang, and L.-T. Chia, “Laplacian sparse coding,
hypergraph laplacian sparse coding, and applications,”IEEE Tran. Pattern Analysis and Machine Intelligence, vol. 35, no. 1, pp. 92–104, 2013.
[18] W. Liu, D. Tao, J. Cheng, and Y. Tang, “Multiview Hessian dis-criminative sparse coding for image annotation,”Computer Vision and Image Understanding, vol. 118, pp. 50–60, 2014.
[19] W. Liu, Z.-J. Zha, Y. Wang, K. Lu, and D. Tao, “p-Laplacian regularized sparse coding for human activity recognition,”IEEE Trans. Industrial Electronics, vol. 63, no. 8, pp. 5120–5129, 2016. [20] X. Li, T. Pfister, X. Huang, G. Zhao, and M. Pietik¨ainen, “A
spontaneous micro-expression database: Inducement, collection and baseline,” inIEEE Intl. Conf. on Automatic Face and Gesture Recognition, 2013, pp. 1–6.
[21] W.-J. Yan, S.-J. Wang, Y.-J. Liu, Q. Wu, and X. Fu, “For micro-expression recognition: Database and suggestions,” Neurocomput-ing, vol. 136, pp. 82–87, 2014.
[22] W.-J. Yan, X. Li, S.-J. Wang, G. Zhao, Y.-J. Liu, Y.-H. Chen, and X. Fu, “CASME II: An improved spontaneous micro-expression database and the baseline evaluation,”PloS ONE, vol. 9, no. 1, p. e86041, 2014.
[23] A. Asthana, S. Zafeiriou, S. Cheng, and M. Pantic, “Robust dis-criminative response map fitting with constrained local models,” in IEEE Conference on Computer Vision and Pattern Recognition (CVPR), 2013, pp. 3444–3451.
[24] S. Han, H. Huang, H. Qin, and D. Yu, “Locality-preserving l1-graph and its application in clustering,” in ACM Symp. Applied Computing, 2015, pp. 813–818.
[25] Y.-L. Boureau, J. Ponce, and Y. LeCun, “A theoretical analysis of feature pooling in visual recognition,” inInternational Conference on International Conference on Machine Learning (ICML), 2010, pp. 111–118.
[26] T. Senst, V. Eiselein, and T. Sikora, “Robust local optical flow for feature tracking,” IEEE Trans. Circuits and Systems for Video Technology, vol. 22, no. 9, pp. 1377–1387, 2012.
[27] T. Ge, K. He, and J. Sun, “Product sparse coding,” in IEEE Conference on Computer Vision and Pattern Recognition (CVPR), 2014, pp. 939–946.
[28] C.-C. Chang and C.-J. Lin, “Libsvm: a library for support vector machines,”ACM Trans. Intelligent Systems and Technology, vol. 2, no. 3, p. 27, 2011.
[29] X. Li, X. Hong, A. Moilanen, X. Huang, T. Pfister, G. Zhao, and M. Pietik¨ainen, “Towards reading hidden emotions: A comparative study of spontaneous micro-expression spotting and recognition methods,” IEEE Trans. Affective Computing, DOI:10.1109/TAFFC.2017.2667642, 2017.
[30] A. Field,Discovering Statistics using IBM SPSS Statistics. 4th ed., SAGE Publications Ltd, 2013.
[31] M. Hollander, D. A. Wolfe, and E. Chicken,Nonparametric Statisti-cal Methods. 3rd ed., Wiley, 2013.
[32] D. Patel, X. Hong, and G. Zhao, “Selective deep features for micro-expression recognition,” inInternational Conference on Pat-tern Recognition (ICPR), 2016, pp. 2258–2263.
[33] D. H. Kim, W. J. Baddar, and Y. M. Ro, “Micro-expression recog-nition with expression-state constrained spatio-temporal feature representations,” in Proceedings of the 2016 ACM on Multimedia Conference (MM’16), 2016, pp. 382–386.
[34] R. Breuer and R. Kimmel, “A deep learning perspective on the origin of facial expressions,” inarXiv:1705.01842v2, 2017.
Yong-Jin Liu received the BEng degree from Tianjin University, China, in 1998, and the PhD degree from the Hong Kong University of Sci-ence and Technology, Hong Kong, in 2004. He is an associate professor with BNRist, Department of Computer Science and Technology, Tsinghua University, China. His research interests include computational geometry, computer graphics and computer-aided design. He is a senior mem-ber of the IEEE and a memmem-ber of ACM. For more information, visit http://cg.cs.tsinghua.edu. cn/people/∼Yongjin/Yongjin.htm
Bing-Jun Lireceived his BEng degree from Bei-jing University of Posts and Telecommunications, China, in 2014. Currently, he is now a mas-ter student at Department of Compumas-ter Science and Technology, Tsinghua University, China. His research interests include computer vision and image processing.
Yu-Kun Lai is a Senior Lecturer at School of Computer Science and Informatics, Cardiff Uni-versity, UK. He received his B.S and PhD de-grees in Computer Science from Tsinghua Uni-versity, in 2003 and 2008 respectively. His re-search interests include computer vision, com-puter graphics and geometric computing. For more information, visit https://users.cs.cf.ac.uk/ Yukun.Lai/