This is a repository copy of
3D deep convolutional neural network-based ventilated lung
segmentation using multi-nuclear hyperpolarized gas MRI
.
White Rose Research Online URL for this paper:
http://eprints.whiterose.ac.uk/168061/
Version: Accepted Version
Proceedings Paper:
Astley, J., Biancardi, A., Hughes, P. et al. (8 more authors) (2020) 3D deep convolutional
neural network-based ventilated lung segmentation using multi-nuclear hyperpolarized gas
MRI. In: Petersen, J., Estépar, R.S.J., Schmidt-Richberg, A., Gerard, S., Lassen-Schmidt,
B., Jacobs, C., Beichel, R. and Mori, K., (eds.) Thoracic Image Analysis. TIA 2020, 08 Oct
2020, Lima, Peru. Lecture Notes in Computer Science , 12502 . Springer Verlag , pp.
24-35. ISBN 9783030624682
https://doi.org/10.1007/978-3-030-62469-9_3
This is a post-peer-review, pre-copyedit version of an article published in Petersen J. et al.
(eds) Thoracic Image Analysis. TIA 2020. Lecture Notes in Computer Science, vol 12502.
The final authenticated version is available online at:
http://dx.doi.org/10.1007/978-3-030-62469-9_3
[email protected] https://eprints.whiterose.ac.uk/
Reuse
Items deposited in White Rose Research Online are protected by copyright, with all rights reserved unless indicated otherwise. They may be downloaded and/or printed for private study, or other acts as permitted by national copyright laws. The publisher or other rights holders may allow further reproduction and re-use of the full text version. This is indicated by the licence information on the White Rose Research Online record for the item.
Takedown
If you consider content in White Rose Research Online to be in breach of UK law, please notify us by
3D deep convolutional neural network-based ventilated
lung segmentation using multi-nuclear hyperpolarized
gas MRI
Joshua R. Astley1,2[0000-0002-6552-5436], Alberto M. Biancardi1, Paul J.C. Hughes1, Laurie J.
Smith1, Helen Marshall1, James Eaden1, Jody Bray1, Nicholas D. Weatherley1, Guilhem J.
Col-lier1, Jim M. Wild1, and Bilal A. Tahir1,2[0000-0003-0531-3519]
1POLARIS, Department of Infection, Immunity & Cardiovascular Disease 2Department of Oncology and Metabolism, University of Sheffield, UK.
Abstract. Hyperpolarized gas MRI enables visualization of regional lung ventilation with high
spatial resolution. Segmentation of the ventilated lung is required to calculate clinically relevant biomarkers. Recent research in deep learning (DL) has shown promising results for numerous segmentation problems. In this work, we evaluate a 3D V-Net to segment ventilated lung regions on hyperpolarized gas MRI scans. The dataset consists of 743 helium-3 (3He) or xenon-129
(129Xe) volumetric scans and corresponding expert segmentations from 326 healthy subjects and
patients with a wide range of pathologies. We evaluated segmentation performance for several DL experimental methods via overlap, distance and error metrics and compared them to conven-tional segmentation methods, namely, spatial fuzzy c-means (SFCM) and K-means clustering. We observed that training on combined 3He and 129Xe MRI scans outperformed other DL
meth-ods, achieving a mean±SD Dice of 0.958±0.022, average boundary Hausdorff distance of 2.22±2.16mm, Hausdorff 95th percentile of 8.53±12.98mm and relative error of 0.087±0.049.
Moreover, no difference in performance was observed between 129Xe and 3He scans in the testing
set. Combined training on 129Xe and 3He yielded statistically significant improvements over the
conventional methods (p<0.0001). The DL approach evaluated provides accurate, robust and rapid segmentations of ventilated lung regions and successfully excludes non-lung regions such as the airways and noise artifacts and is expected to eliminate the need for, or significantly reduce, subsequent time-consuming manual editing.
Keywords: Functional lung imaging, Hyperpolarized gas MRI, Deep learning,
Convo-lutional neural network, Lung segmentation.
1
Introduction
Hyperpolarized gas MRI enables visualization of regional lung ventilation with high spatial resolution [1]. Quantitative biomarkers derived from this modality, including the ventilated defect percentage, provide further insights into pulmonary pathologies currently not possible with alternative techniques [2]. To facilitate the computation of such biomarkers, segmentation of ventilated regions of the lung is required [3].
Conventional approaches for hyperpolarized gas MRI ventilation segmentation em-ploy classical image processing and machine learning techniques, such as hierarchical K-means clustering [4] and spatial fuzzy c-means (SFCM) with tuned bilateral filtering and clustering [5]. However, as these methods are based on voxel intensities and thresh-olding, they provide only semi-automatic segmentations; as such, they are prone to er-rors that often require significant time to manually correct such as the removal of non-ventilated lung voxels and non-lung regions, including the airways and artifacts.
Recent research in image segmentation has focused on the use of deep learning (DL) and has been applied to numerous problems, showing promising results [6, 7]. Convo-lutional neural networks (CNN) have become the most common DL network used for image segmentation, enhanced by the adoption of transfer learning to cope with limited datasets [8, 9]. Tustison et al. employed a 2D CNN with a U-Net architecture using 113 hyperpolarized gas MRI scans, obtaining impressive results [10]. However, application of DL on a more extensive database with a broader range of pathologies is required for clinical adoption.
In this work, we evaluate a 3D volumetric V-Net CNN to accurately, robustly and rapidly segment ventilated lungs on hyperpolarized gas MRI scans using a large, di-verse dataset with both helium-3 (3He) and xenon-129 (129Xe) scans and corresponding
expert segmentations. We evaluate several DL methods for training a neural network and use a diverse set of evaluation metrics for comparison. We then compare the best performing DL method to conventional approaches used for hyperpolarized gas MRI segmentation. We also investigate the effect of the noble gas on DL performance.
2
Materials and Methods
2.1 Hyperpolarized gas MRI acquisition
All subjects underwent 3D volumetric 3He [11] and 129Xe [12] hyperpolarized gas MRI
with full lung coverage at 1.5T. Flexible quadrature radiofrequency coils were em-ployed for transmission and reception of MR signals at the Larmor frequencies of 3He
and 129Xe. In-plane (x-y) resolution of scans for both gases was 4x4mm2. 129Xe scans
ranged from 16-34 slices with a mean of 23 slices and slice thickness of 10mm. 3He
scans ranged from 34-56 slices with a mean of 45 slices and slice thickness of 5mm.
2.2 Dataset
The imaging dataset used in this study was collected retrospectively from several clin-ical observational studies and patients referred for clinclin-ical scans. The dataset consisted of 743 volumetric hyperpolarized gas MRI scans (22890 slices), with either 3He (248
scans, 11370 slices) or 129Xe (495 scans, 11520 slices), from 326 subjects. The slices
are distributed approximately 50:50 between 3He and 129Xe. The subjects included
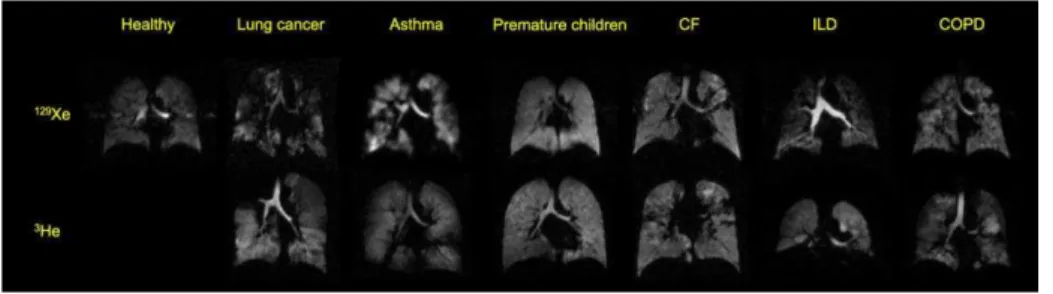
healthy individuals and patients with various pulmonary pathologies and are summa-rized in Table 1. Examples of 3He and 129Xe images for a range of pathologies are
Table 1. Dataset information and disease breakdown.
Number of scans Hyperpolarized Gas
Healthy 41 129Xe
Lung cancer 22 3He or 129Xe
Chronic obstructive pulmonary disease (COPD) 54 3He or 129Xe
Cystic fibrosis (CF) 223 3He or 129Xe
Premature children 50 3He or 129Xe
Interstitial lung disease (ILD)* 127 3He or 129Xe
Patients referred for clinical scans** 245 3He or 129Xe
*Contains idiopathic pulmonary fibrosis (IPF), connective tissue disease associated ILD (CTD-ILD), hypersensitivity pneumonitis (HP) and drug induced ILD (DI-ILD).
**Clinical referral cases include patients with asthma, COPD, bronchiectasis, cystic fibrosis, col-lapsed lung and primary ciliary dyskinesia (PCD).
Fig. 1. Example coronal slices from the dataset. 3He MRI scans for healthy subjects were
una-vailable.
Each scan has a corresponding manually-edited ground truth segmentation represent-ing the ventilated region of the lung. These segmentations were generated by multiple expert observers and reviewed by an independent imaging scientist to ensure quality and identify potential errors; errors such as the inclusion of the trachea or background noise were manually corrected.
2.3 Parameterization
Several experiments were conducted to assess the effect of varying network architec-ture, loss function and pre-processing technique using a subset of the data comprising of 431 hyperpolarized gas MRI scans, with either 3He (n=173) or 129Xe (n=258), from
healthy subjects and patients with pulmonary pathologies. 29 scans were used as a pa-rameterization testing set and 40 scans used for internal validation.
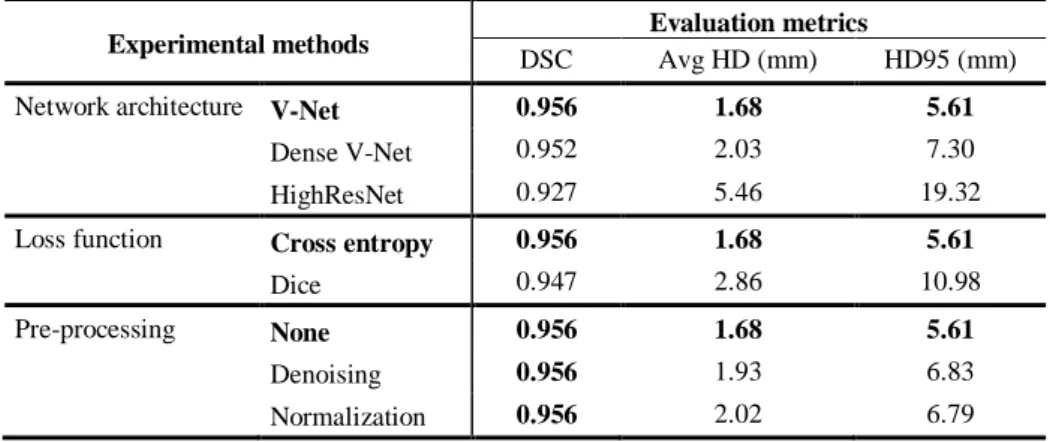
Table 2 displays the results of these investigations showing mean performance on
the parameterization testing set. The V-Net architecture with cross-entropy loss func-tion exhibited improved performance in terms of Dice similarity coefficient (DSC),
av-erage Hausdorff distance at the boundary (Avg HD) and Hausdorff 95th percentile
dis-tance at the boundary (HD95). The impact of two commonly used pre-processing tech-niques for hyperpolarized gas MRI, namely, normalization and denoising [10], were evaluated. Due to the lack of substantial improvements, no pre-processing was imple-mented on the larger dataset used to evaluate DL methods in this work.
Table 2. Mean results on the parameterization testing set shown for three experiments
investi-gating the effect of varying network architecture, loss function and pre-processing technique. The highest DSC values are shown in bold.
Experimental methods Evaluation metrics
DSC Avg HD (mm) HD95 (mm)
Network architecture V-Net 0.956 1.68 5.61
Dense V-Net 0.952 2.03 7.30
HighResNet 0.927 5.46 19.32
Loss function Cross entropy 0.956 1.68 5.61
Dice 0.947 2.86 10.98
Pre-processing None 0.956 1.68 5.61
Denoising 0.956 1.93 6.83
Normalization 0.956 2.02 6.79
Further derived from the above investigations, 25000 iterations were selected as the appropriate number of training iterations, as they represent the optimal balance between segmentation performance and training time.
Conducting these experiments on a subset of the total data allows for optimization of parameters without introducing potential biases to a specific training and testing set. The following section describes the data split and DL parameters, informed by the above investigations, used in the remainder of this work.
2.4 Convolutional Neural Network
We used the V-Net fully convolutional neural network which processes 3D scans using volumetric convolutions [13]. The network is trained end-to-end using hyperpolarized gas MRI volumetric scans. The network utilizes a non-linear PReLu activation function [14] and is optimized using a binary cross-entropy (BCE) loss function defined below:
log log
where denotes the manually-edited ground truth segmentation, the predicted segmentation by the network and represents the voxel loca-tion within the image, which is assumed to have N number of voxels.
Parameters. ADAM optimization was used to train the CNN [15]. The spatial window
size was set to [96,96,24] with a batch size of 10. A learning rate of 1x10⁻⁵ was used
for initial training and 0.5x10⁻⁵ for fine-tuning methods.
Data split. The dataset was split into training, validation and testing sets. The training
set contained 232 3He scans (10686 slices) and 437 129Xe scans (10212 slices) from a
total of 252 subjects. 74 scans, each from a different subject, were selected for the test-ing set (3He: 16 scans; 129Xe: 58 scans). 10% of the training set was randomly selected
as a validation dataset. Repeat or longitudinal scans from multiple visits for the same patient were contained in the training set; however, no subject was present in both the training/validation and testing sets, with the testing set containing only one scan from each patient. The range of diseases in the testing set is representative of the dataset as a whole.
Computation. The networks were trained using the medical imaging DL framework
NiftyNet 0.6.0 [16] on top of TensorFlow 1.14 [17]. Training and inference were per-formed on an NVIDIA Tesla V100 GPU with 16 GB of RAM.
2.5 DL experimental methods
Five DL experimental methods were performed to train the network: (1) The model was trained on 232 3He scans for 25000 iterations.
(2) The model was trained on 437 129Xe scans for 25000 iterations.
(3) The model was trained on 232 3He scans for 20000 iterations; these weights
were used to initialize a model trained on 437 129Xe scans for 5000 iterations.
(4) The model was trained on 437 129Xe scans for 20000 iterations; these weights
were used to initialize a model trained on 232 3He scans for 5000 iterations.
(5) The model was trained on 669 129Xe and 3He scans for 25000 iterations.
The five experimental methods were applied to the data split defined in section 2.4 using the same testing set for each method, facilitating comparison between the five methods to identify the best performing training process on multiple metrics.
2.6 Comparison to conventional methods
For further benchmarking of the CNN methods, the best-performing DL method was compared against other conventional machine learning methods for hyperpolarized gas MRI segmentation. The methods used are briefly described as follows:
(1) Hierarchical K-means segmentation algorithm: A high number of iterations and centroid sorting were used to improve robustness [4].
(2) SFCM algorithm: The method uses bilateral filtering tuned to 3He or 129Xe and
19 clusters to assign membership before thresholding produces a binary seg-mentation (adaption of [5]).
2.7 Evaluation Metrics
The testing set results for each of the five DL experimental methods and two conven-tional methods were evaluated using several metrics. The DSC was used to assess over-lap between the ground truth and predicted segmentations [18]. Two distance metrics, Avg HD (mm) and HD95 (mm) were used [19]. The Avg HD reduces sensitivity to outliers and is regarded as a stable metric for segmentation evaluation [20]. Further-more, a relative error metric (XOR) was used to evaluate segmentation error [21].
2.8 Statistical Analysis
Paired t-tests were used to assess the statistical significance of differences between ex-perimental methods. A Mann-Whitney U test was used to compare differences between
3He and 129Xe segmentations to assess the effect of the gas. The best performing
exper-imental method was compared to other segmentation methods using paired t-tests. Sta-tistical analysis was performed using Prism 8.4 (GraphPad, San Diego, CA).
3
Results
Table 3 shows a comparison of segmentation performance for the five DL experimental
methods and the two conventional segmentation methods.
Table 3. Comparison of segmentation performance of DL methods and conventional methods
for a testing set of 74 scans. Means are given; the best result for each metric is in bold.
Experimental methods Evaluation metrics
DSC Avg HD (mm) HD95 (mm) XOR
Train on 3He 0.948 3.92 16.64 0.109
Train on 129Xe 0.954 1.84 6.32 0.091
Train on 3He, fine-tuned on 129Xe 0.955 2.47 9.12 0.091
Train on 129Xe, fine-tuned on 3He 0.946 4.37 17.94 0.120
Combined 3He and 129Xe training 0.958 2.22 8.53 0.087
K-means 0.610 37.28 98.79 1.604
SFCM 0.907 5.61 23.06 0.242
P-values are shown in a 5x5 matrix in Table 4 using both the DSC and Avg HD evaluation metrics for the five DL experimental methods.
Table 4. P-values from paired t-tests comparing DL experimental methods in Table 3 for DSC
(blue) and Avg HD (green) evaluation metrics. *significant P-values (p<0.05) DSC Avg HD Train on 3He Train on 129Xe Train on 3He, fine tune on 129Xe Train on 129Xe, fine tune on 3He Train on com-bined 129Xe and 3He Train on 3He 0.11 0.004* 0.28 <0.0001* Train on 129Xe 0.0072* 0.44 0.13 0.032*
Train on 3He, fine tune on 129Xe <0.0001* 0.31 0.036* 0.0007*
Train on 129Xe, fine tune on 3He 0.53 0.0004* 0.0093* 0.0075*
Train on combined 129Xe and 3He 0.0005* 0.069 0.097 0.0003*
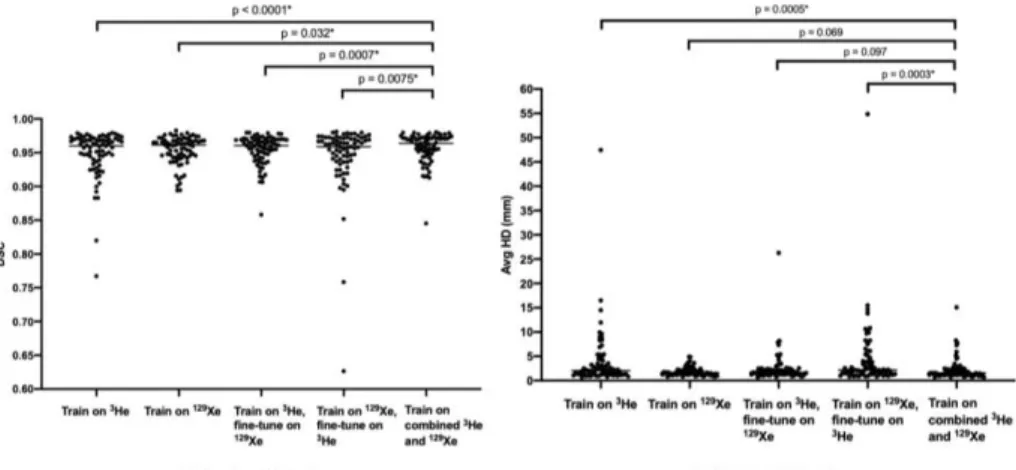
Fig. 2 shows distributions of the DSC and Avg HD values for each method.
Statisti-cal significance was assessed using paired t-tests for the DSC and Avg HD metrics comparing the combined 3He and 129Xe method to other DL methods. The combined 3He and 129Xe method yielded statistically significant improvements over all DL
meth-ods using DSC (mean DSC=0.958, p<0.05). Using Avg HD, the combined 3He and 129Xe method generated statistically significant improvements over two DL methods
(p<0.05); no significant difference between the other methods was observed (p>0.05).
Fig. 2. Comparison on 74 testing scans for five DL experimental methods using DSC (left) and
Avg HD (right). P-values are displayed for paired t-tests comparing the combined 3He and 129Xe
DL method to the other DL methods.
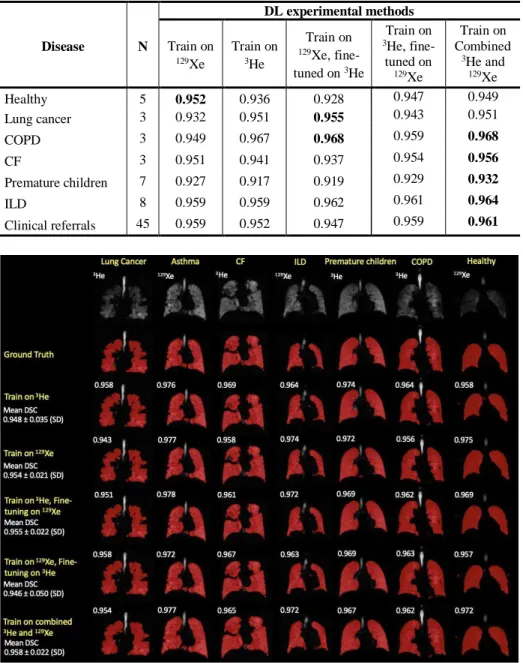
Fig. 3 shows examples of segmentation quality for a healthy subject and patients
with six different pathologies across the five DL experimental methods using 3He and 129Xe, representing a wide range of hyperpolarized gas MRI scans. The original scans
and ground truth segmentations are included to facilitate comparison. It can be observed that there are negligible voxels outside the lung parenchyma classed as ventilated and that the CNN accurately excluded ventilation defects, as shown in the examples of the CF and lung cancer patients. Table 5 stratifies results based on disease and shows that, for the majority of diseases, the combined 3He and 129Xe method is the best performing
Table 5. Comparison of segmentation performance of DL methods stratified by disease for 74
testing scans. Mean DSCs are given; the best result for each disease is shown in bold.
Disease N DL experimental methods Train on 129Xe Train on 3He Train on 129Xe, fine-tuned on 3He Train on 3He, fine-tuned on 129Xe Train on Combined 3He and 129Xe Healthy 5 0.952 0.936 0.928 0.947 0.949 Lung cancer 3 0.932 0.951 0.955 0.943 0.951 COPD 3 0.949 0.967 0.968 0.959 0.968 CF 3 0.951 0.941 0.937 0.954 0.956 Premature children 7 0.927 0.917 0.919 0.929 0.932 ILD 8 0.959 0.959 0.962 0.961 0.964 Clinical referrals 45 0.959 0.952 0.947 0.959 0.961
Fig. 3. Example coronal slices for seven subjects with different pathologies for each DL
experi-mental method. Individual, and mean ± SD, DSC values are displayed.
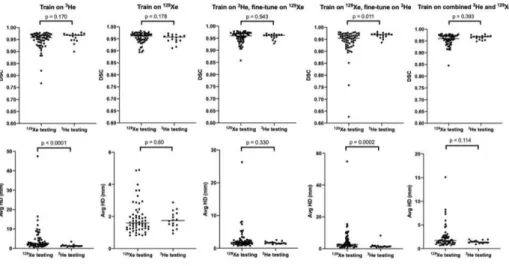
Fig. 4 shows the segmentation performance for the testing set between noble gases
(129Xe and 3He) using the DSC and Avg HD metrics. Only the ‘Train on 129Xe,
(p=0.011) and Avg HD (p=0.0002) metrics. The combined 3He and 129Xe method shows
no statistically significant differences between gases using DSC and Avg HD metrics.
Fig. 4. Comparison of DSC (top) and Avg HD (bottom) values for 129Xe and 3He testing scans
for five DL methods. P-values between 129Xe and 3He using the Mann-Whitney test are shown.
Combined 3He and 129Xe training was identified as the most accurate DL ventilated
lung segmentation method due to statistically significant improvements over all other methods using DSC and XOR metrics. Fig. 5 shows a comparison using the combined DL method and two conventional segmentation methods, K-means and SFCM. The DL segmentation method exhibits significant improvements (p<0.0001), accurately exclud-ing low-level noise as well as non-lung regions such as the trachea and bronchi.
Fig. 5. Comparison of performance on testing scans between the combined 129Xe and 3He DL
method and conventional segmentation methods (SFCM and K-means) with P-values from paired t-tests. Individual DSC and Avg HD values for each method are displayed for two cases. Case 1 is a COPD patient and case 2 is a clinical referral patient.
4
Discussion and Conclusion
DL segmentation methods produced highly accurate segmentations across a range of evaluation metrics on the dataset used. To the best of the authors’ knowledge, the hy-perpolarized gas MRI dataset used here is the largest used to date for ventilated lung segmentation and contains over 743 scans from patients with a wide range of lung pa-thologies. This is advantageous for preserving generalizability as it enables the algo-rithm to learn features present in a range of diseases and multiple hyperpolarized gases (3He and 129Xe), producing robust and accurate segmentations across numerous cases.
The CNN produced more accurate segmentations than the two conventional ap-proaches investigated for all evaluation metrics used in this study. In particular, the CNN was able to deal with images containing background noise and artifacts, as well as successfully excluding ventilation defects and airways. In comparison, the SFCM method is unable to distinguish airways or artifacts and segments these areas errone-ously. As such, it is highly probable that the CNN eliminates or dramatically reduces the manual-editing time required after automatic segmentation. Tustison et al. used a 2D U-Net for hyperpolarized gas MRI segmentation and achieved a mean DSC of 0.94 [10]. In comparison, our combined 3He and 129Xe method trained via a 3D V-Net
yielded a mean DSC value of 0.96. The 3D CNN allows the model to treat the segmen-tation as a 3D volume and learn features which are present across multiple slices.
The combined 3He and 129Xe method shows statistically significant improvements
over all other methods using the DSC metric; however, using the Avg HD metric, there is no significant difference between the combined and 129Xe-only methods. In terms of
mean values, the 129Xe-only method generates a reduced Avg HD; this is likely due to
the ability of the 129Xe-only method to accurately segment an outlier testing scan that
was segmented relatively poorly by the other methods. In addition, the testing set is imbalanced in favor of 129Xe, introducing a possible bias into the analysis. No
statisti-cally significant differences were observed in performance when comparing 3He and 129Xe testing set scans, indicating that for a given 3He or 129Xe scan, neither the
com-bined nor the 129Xe-only methods are biased towards a specific hyperpolarized gas.
The training algorithm was implemented on a single GPU and required 12 days to reach 25000 iterations. Inference was also implemented on a single GPU, taking 27 seconds per 129Xe scan and 35 seconds per 3He scan, corresponding to approximately
one second per slice for both gases.
A limitation of the study is the presence of only one expert segmentation per scan which limits the ability to evaluate inter- and intra-observer variability. However, the wide range of expert observers to generate the expert segmentations lead to significant variability in the training and testing sets. Hence, the CNN can learn a robust segmen-tation method across ground truth segmensegmen-tations with multiple expert observers. In fu-ture work, multiple ground truth segmentations may be used to train the algorithm and allow evaluation of inter-observer variability.
The variation in the number of repeat or longitudinal scans and slice thickness be-tween 3He and 129Xe scans impeded us from achieving a training and testing set split
equally between both gases. Although multiple scans from the same patient were in-cluded in the training set to increase dataset numbers, to increase the robustness of the
evaluation, no scan of the same patient was present both in the training and testing sets. In doing so, the testing set suffers from an imbalance in hyperpolarized gases in favor of 129Xe. As such, the comparison of DL methods may have been subject to bias.
Although the effect of several CNN architectures was investigated, a more robust study of network architectures, such as 2D and 3D networks, is required; in future work, further comparisons between common network architectures will be conducted to as-sess whether superior performance can be achieved. Furthermore, hyper-parameteriza-tion and addihyper-parameteriza-tional loss funchyper-parameteriza-tions need to be investigated.
For the evaluation of clinically relevant metrics such as ventilated defect percentage [2], the whole-lung cavity volume is required in addition to ventilated lung volumes, most commonly computed from a whole-lung segmentation generated from a structural proton MRI scan. Accurate automatic segmentation of both ventilated and structural images will lead to significant improvements in the clinical workflow, including re-duced segmentation generation time and manual editing time.
In conclusion, we evaluated a 3D fully-connected CNN using the V-Net architecture that is capable of producing accurate, robust and rapid hyperpolarized gas MRI seg-mentations on a large, diverse dataset. We compared five experimental DL methods and observed that combining 3He and 129Xe scans in the training set produces the most
accurate segmentations with multiple evaluation metrics. This CNN-based method also significantly outperforms two conventional segmentation methods.
Acknowledgements. This work was supported by Yorkshire Cancer Research
(S406BT), Weston Park Cancer Charity, National Institute of Health Research, the Medical Research Council and GlaxoSmithKline (BIDS3000032592). The authors also acknowledge access to high-performance computing equipment available via an Engi-neering and Physical Sciences Research Council Equipment Grant (EP/P020275/1; Joint Academic Data Science Endeavour) and support provided for this equipment grant via Research Software Engineering Sheffield.
References
1. Fain, S.B., Korosec, F.R., Holmes, J.H., O'Halloran, R., Sorkness, R.L., Grist, T.M.: Func-tional lung imaging using hyperpolarized gas MRI. vol. 25, pp. 910-923 (2007)
2. Woodhouse, N., Wild, J.M., Paley, M.N., Fichele, S., Said, Z., Swift, A.J., van Beek, E.J.: Combined helium-3/proton magnetic resonance imaging measurement of ventilated lung vol-umes in smokers compared to never-smokers. J Magn Reson Imaging 21, 365-369 (2005) 3. Tustison, N.J., Avants, B.B., Flors, L., Altes, T.A., de Lange, E.E., Mugler, J.P., 3rd, Gee,
J.C.: Ventilation-based segmentation of the lungs using hyperpolarized (3)He MRI. J Magn Reson Imaging 34, 831-841 (2011)
4. Kirby, M., Heydarian, M., Svenningsen, S., Wheatley, A., McCormack, D., Etemad-Rezai, R., Parraga, G.: Hyperpolarized He-3 Magnetic Resonance Functional Imaging Semiauto-mated Segmentation. Academic radiology 19, 141-152 (2011)
5. Hughes, P.J.C., Horn, F.C., Collier, G.J., Biancardi, A., Marshall, H., Wild, J.M.: Spatial fuzzy c-means thresholding for semiautomated calculation of percentage lung ventilated vol-ume from hyperpolarized gas and (1)H MRI. J Magn Reson Imaging 47, 640-646 (2018)
6. Bakator, M., Radosav, D.: Deep Learning and Medical Diagnosis: A Review of Literature. Multimodal Technologies and Interaction 2, 47 (2018)
7. Lundervold, A.S., Lundervold, A.: An overview of deep learning in medical imaging focusing on MRI. vol. 29, pp. 102-127. Elsevier GmbH (2019)
8. Tajbakhsh, N., Shin, J.Y., Gurudu, S.R., Hurst, R.T., Kendall, C.B., Gotway, M.B., Jianming, L.: Convolutional Neural Networks for Medical Image Analysis: Full Training or Fine Tun-ing? IEEE Trans Med Imaging 35, 1299-1312 (2016)
9. Zha, W., Fain, S.B., Schiebler, M.L., Evans, M.D., Nagle, S.K., Liu, F.: Deep convolutional neural networks with multiplane consensus labeling for lung function quantification using UTE proton MRI. J Magn Reson Imaging 50, 1169-1181 (2019)
10.Tustison, N.J., Avants, B.B., Lin, Z., Feng, X., Cullen, N., Mata, J.F., Flors, L., Gee, J.C., Altes, T.A., Mugler Iii, J.P., Qing, K.: Convolutional Neural Networks with Template-Based Data Augmentation for Functional Lung Image Quantification. Acad Radiol 26, 412-423 (2019)
11.Horn, F.C., Tahir, B.A., Stewart, N.J., Collier, G.J., Norquay, G., Leung, G., Ireland, R.H., Parra-Robles, J., Marshall, H., Wild, J.M.: Lung ventilation volumetry with same-breath ac-quisition of hyperpolarized gas and proton MRI. NMR in Biomedicine 27, 1461-1467 (2014) 12.Stewart, N.J., Norquay, G., Griffiths, P.D., Wild, J.M.: Feasibility of human lung ventilation imaging using highly polarized naturally abundant xenon and optimized three-dimensional steady-state free precession. Magn Reson Med 74, 346-352 (2015)
13.Milletari, F., Navab, N., Ahmadi, S.A.: V-Net: Fully Convolutional Neural Networks for Vol-umetric Medical Image Segmentation. Proceedings of 2016 Fourth International Conference on 3d Vision, 565-571 (2016)
14.He, K., Zhang, X., Ren, S., Sun, J.: Delving Deep into Rectifiers: Surpassing Human-Level Performance on ImageNet Classification. IEEE International Conference on Computer Vision (ICCV 2015) 1502, (2015)
15.Kingma, D., Ba, J.: Adam: A Method for Stochastic Optimization. International Conference on Learning Representations (2014)
16.Gibson, E., Li, W., Sudre, C., Fidon, L., Shakir, D.I., Wang, G., Eaton-Rosen, Z., Gray, R., Doel, T., Hu, Y., Whyntie, T., Nachev, P., Modat, M., Barratt, D.C., Ourselin, S., Cardoso, M.J., Vercauteren, T.: NiftyNet: a deep-learning platform for medical imaging. Comput Meth-ods Programs Biomed 158, 113-122 (2018)
17.Abadi, M., Agarwal, A., Barham, P., Brevdo, E., Chen, Z., Citro, C., Corrado, G.S., Davis, A., Dean, J., Devin, M.: Tensorflow: Large-scale machine learning on heterogeneous distrib-uted systems. arXiv preprint arXiv:1603.04467 (2016)
18.Dice, L.R.: Measures of the Amount of Ecologic Association Between Species. Ecology 26, 297-302 (1945)
19.Beauchemin, M., Thomson, K.P.B., Edwards, G.: On the Hausdorff Distance Used for the Evaluation of Segmentation Results. Canadian Journal of Remote Sensing 24, 3-8 (1998) 20.Shapiro, M.D., Blaschko, M.B.: On hausdorff distance measures. Computer Vision
Labora-tory University of Massachusetts Amherst, MA 1003 (2004)
21.Biancardi, A.M., Wild, J.M.: New Disagreement Metrics Incorporating Spatial Detail – Ap-plications to Lung Imaging. In: Medical Image Understanding and Analysis, pp. 804-814. Springer International Publishing (2017)