Research Bulle tin
O c t o b e r 3 0 , 2 0 1 2IT Infrastructure to Support Analytics
L a y i n g t h e G r o u n d w o rk f o r I n s t i t u t i o n a l An a l y t i c s
Jerrold M. Grochow
Introduction
Analytics has become a hot topic in the educational community. Although analytics is a broad term with many possible interpretations, EDUCAUSE has developed the following definition to facilitate dialogue in the higher education community:
Analytics is the use of data, statistical analysis, and explanatory and predictive models to gain insights and act on complex issues.1
This definition articulates analytics in terms of how it is used. We also need to define analytics in the technical sense and determine the specifics of what the IT department has to do to support this use. What are the roles of a data warehouse; extract, transform, and load (ETL) tools; and visualization tools? What is the role of IT in initiating and supporting a program of analytics activities? What are the responsibilities of CIOs and other IT leaders in addressing analytics? These are the key questions about the infrastructure of an analytics program—all the myriad components and activities that have to come together to support “the use of data…to gain insights” and take action.
A member of the institutional research team at University of Maryland, Baltimore County (UMBC), interviewed for this report asked, “Is IT leading the project, only providing technical support, or some type of hybrid approach? I think the hybrid works best, but at a minimum, I look to IT to keep the database up and running, maintain security, and support the reporting tools. They also need the ability to interact with the functional offices and analytics user community.” While this suggests the possibility of a broad role for IT at some institutions, IT is almost always expected to have primary responsibility for providing and supporting the technology infrastructure: keeping the database up and running, maintaining security, and supporting the reporting tools, as well as many other tasks. This research bulletin broadly addresses these functions and the related activities of the IT department that are important to providing analytics infrastructure. Discussion of other activities, such as program management, requirements gathering, relationship management, and change management—which are all very important to a successful analytics program—can be found in many sources (see the Where to Learn More section).
Infrastructure for Analytics
Analytics infrastructure is addressed below in terms of three broad considerations: the processing cycle, the processing environment, and governance.
Processing Cycle
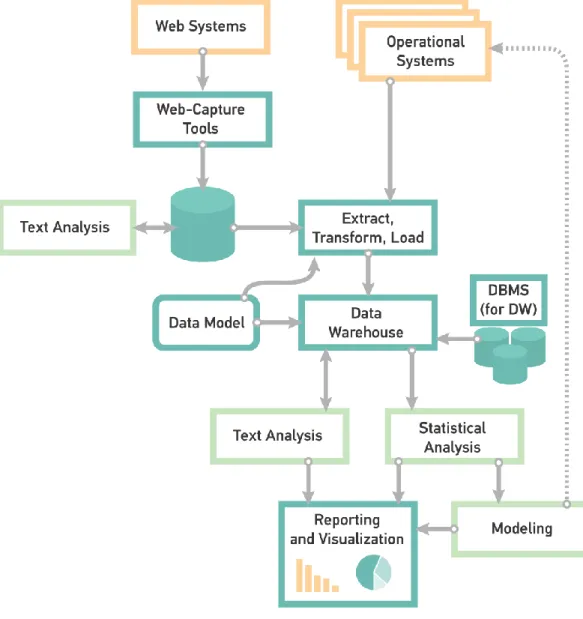
What technology is necessary to support analytics? Based on the EDUCAUSE definition, analytics is about data, statistical analysis, and modeling. Technology is needed to capture, store, and organize data; perform various statistical analyses on it; and create and test models. A data warehouse, ETL software, statistical tools, modeling tools, data-mining tools, and a variety of ancillary tools are necessary. An appropriate hardware and network environment is also required (perhaps in the cloud, or at least partly so), as are the associated management software and processes. These components serve to process, analyze, and interpret the data that are entered to the analytics process, as shown in Figure 1.
Data can come from operational systems, the web, e-mail, and other sources such as the EDUCAUSE Core Data Service. The choice of specific sources of data will be driven by the types of problems you want to investigate. A data model showing the structure and
relationships among data entities can be created based on the specifics of the data sources. The data now has to be collected, extracted, transformed into standard formats, and loaded into a data warehouse or similar storage using the data model. Web-capture software is available for click streams, search traffic, and other web-based data, and text-analysis software can analyze unstructured text streams including e-mail and social media posts to create structured data.
Core analytic tools (data-mining, statistical, and behavioral and operational modeling tools) will then do their work on these data accessed through the data warehouse. Various reporting and visualization tools will display the results.
The analytical models you pursue can be used to develop parameters or controls of operational systems to directly use the results of the analysis, for example, in determining what content to display to different types of people browsing your website based on analysis of past behaviors. Augmenting these software and database components will be management tools (versioning, scheduling, etc.), collaboration tools (for model and report development and sharing), and a variety of other utilities. This is the technology of the analytic cycle, from data capture to use of that data in making decisions.2
Processing Environment
Another aspect of the infrastructure for analytics is where the computing will be done. Most large-scale analytics are run on servers (dedicated or virtual) housed in the enterprise data center (sometimes referred to as “enterprise analytics”). Very-large-scale processing requires multiple servers and increasingly uses parallel processing, typically both for computation and database access (“big-data analytics”). Smaller-scale processing can be done on a desktop machine (“personal analytics”), with the definition of “smaller” increasing all the time.3
Desktop systems can also be set up very quickly and deliver business value in prototyping and building support for a larger enterprise systems.
Most recently, a number of new vendors are offering their services in the cloud (“analytics as a service”), and even established vendors are moving in this direction. Making decisions about whether or what analytics processing to run in the cloud can be based on type and quantity of data to be analyzed, cost, security, and, of course, features available in the analytics software. The parameters behind these decisions are changing rapidly as cloud-based analytics processing gets more sophisticated; as a result, evaluations made as recently as several months ago might no longer be applicable. Further, moving data to the cloud presents additional considerations versus hosting it in an enterprise data center, chief among them being data privacy and security.
Analytics Governance
Although data security is a technological and physical issue, data privacy is a policy issue. This and the many other policy issues that must be discussed and decided fall under the general topic of “governance.” Many organizations are already at work developing data-governance strategies, dealing with data stewardship (central or distributed), definitions and other standards, retention policies, backup policies, and, of course, privacy policies.
Analytics governance, however, needs to go beyond data governance; it should establish policies and procedures that ensure the institution achieves maximum value from all its analytics investment. Such policies might include consideration of the appropriate use of analytics in decision making (when is data-driven decision making acceptable, with little or no human intervention), the appropriate use of analytic-inference engines (using social network data and what you can learn about a person’s friends to draw inferences about that person), or the appropriate use of cloud-based analytics (based on everything from cost to vendor viability, privacy and security concerns, compliance with state and federal statutes, and many others). This is not an exhaustive list of the issues that an analytics governance program must address, but it highlights the fact that governance concerns have to be considered in establishing IT infrastructure for analytics.
Privacy and Security
While the popular press abounds with articles about the death of privacy and the different views about privacy between older (private) and younger (open) generations, the higher education community must take privacy very seriously. In particular, two federal laws and numerous state laws apply, and severe penalties—monetary, statutory, and reputational—are possible for breaches of privacy. Laws,
however, generally deal with readily identifiable types of data privacy, as in the disclosure of personally identifiable information (combinations of name, address, Social Security number), student record data (Family Educational Rights and Privacy Act of 1974, first enacted almost 40 years ago!), or health information (Health Insurance Portability and Accountability Act of 1998). While cloud vendors are certainly aware of these laws, they are not always compliant (recognizing that compliance changes as the laws are interpreted over time), and some do not see compliance as a sufficient concern for most of their customers to warrant investment. The higher education community has been working through EDUCAUSE for many years to highlight the importance of these issues, and most recently the Internet2 NET+ Services program has been working with a number of cloud service providers and university counsels to help improve operational and contractual privacy provisions for cloud services.
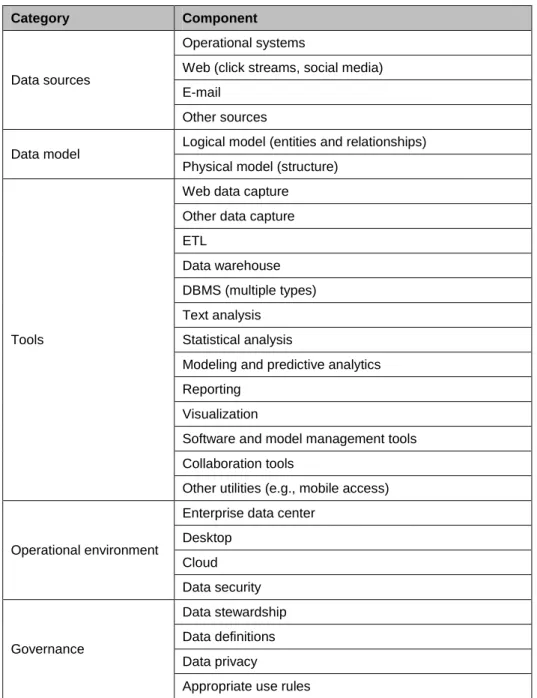
Table 1 summarizes the key elements of the processing cycle, the processing environment, and governance introduced above. A strategy and plan are needed for each to lay the groundwork for an institutional analytics program.
Table 1. Checklist of IT Infrastructure Components to Support Analytics
Category Component
Data sources
Operational systems
Web (click streams, social media) E-mail
Other sources Data model
Logical model (entities and relationships) Physical model (structure)
Tools
Web data capture Other data capture ETL
Data warehouse DBMS (multiple types) Text analysis
Statistical analysis
Modeling and predictive analytics Reporting
Visualization
Software and model management tools Collaboration tools
Other utilities (e.g., mobile access)
Operational environment
Enterprise data center Desktop Cloud Data security Governance Data stewardship Data definitions Data privacy
How Institutions Are Making It Happen: Two
Examples
The ways in which IT departments in colleges and universities are approaching analytics is as varied as it is for other technologies, but there are common themes. Here are some “lessons learned” culled from the experiences of the University of Maryland, Baltimore County, and the University of Notre Dame. How many of them ring true for your environment?
Strong executive sponsorship is critical to the success of a data analytics project. Regardless of IT’s expected role, implementing analytics isn’t just a technical project. Getting clarity about the strategic priorities for analytics (such as student success,
enrollment management, financial management, and so forth) will drive your choice of tools and many other decisions.
Gaining internal support for a data warehouse can be more difficult than the technical implementation.
Once users understand what the data warehouse and analytics software can do for them, usage will expand rapidly.
Expect to spend the major part of your analytics project dealing with data collection, extraction, and transformation.
Internal knowledge of data warehouse and analytics tools is a prerequisite for successful implementation.
Be aware of vendor plans (or lack thereof) for their products, particularly when a large vendor is attempting to integrate a purchased product (or the company that makes it) into an existing product line. Product mergers and acquisitions introduce complications. Become partners with the key users of analytics across your institution.
Start small and iterate!
Make sure you pay attention to analytics governance as well as technology.
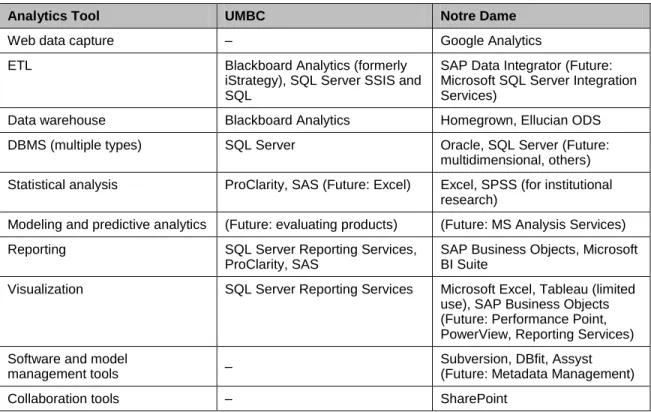
Looking specifically at the software-selection process, UMBC and Notre Dame considered factors such as cost, internal experience with a product, user learning curve, and vendor presentation (specifically, the higher education context). Table 2 summarizes the tools either in use or planned to be used at UMBC and Notre Dame:
Table 2. Analytics Tools at UMBC and Notre Dame
Analytics Tool UMBC Notre Dame
Web data capture – Google Analytics ETL Blackboard Analytics (formerly
iStrategy), SQL Server SSIS and SQL
SAP Data Integrator (Future: Microsoft SQL Server Integration Services)
Data warehouse Blackboard Analytics Homegrown, Ellucian ODS DBMS (multiple types) SQL Server Oracle, SQL Server (Future:
multidimensional, others) Statistical analysis ProClarity, SAS (Future: Excel) Excel, SPSS (for institutional
research)
Modeling and predictive analytics (Future: evaluating products) (Future: MS Analysis Services) Reporting SQL Server Reporting Services,
ProClarity, SAS
SAP Business Objects, Microsoft BI Suite
Visualization SQL Server Reporting Services Microsoft Excel, Tableau (limited use), SAP Business Objects (Future: Performance Point, PowerView, Reporting Services) Software and model
management tools –
Subversion, DBfit, Assyst (Future: Metadata Management) Collaboration tools – SharePoint
University of Maryland, Baltimore County
UMBC has had a data warehouse since 2006 (before “analytics” was starting to be a data processing term of art), using the iStrategy product (now part of Blackboard Analytics). There had been an earlier attempt at creating a data warehouse for human resources data, but the current implementation is focused on storing student information with a follow-on project expected to include accounting and finance information. The data warehouse project initially stored data from a legacy student system and then was converted to work with PeopleSoft’s student system when that was installed several years later.
Overall, use of the data warehouse and analytics software is growing rapidly at UMBC. IT has requests to add data from several additional sources (LMS, learning resources, and even trouble tickets). The data warehouse is already up to 750GB, and the institution expects to add an additional server to start doing parallel processing. While personnel resources aren’t
strapped yet, the two FTEs that IT has committed to the program are now supplemented by two FTEs in Institutional Research.
A member of the IT staff noted that there is a “very big difference in implementing a data warehouse and getting adoption.” IT was most successful when staff members were able to show potential users how they could solve a problem and get results without having to put a request into IT. Using data analytics then became a business improvement project rather than an IT process, and that resonated with the users. As part of this effort, UMBC created a comprehensive governance approach, with active involvement from the CIO and the director of institutional research.4
UMBC is primarily a UNIX/Oracle shop, but the Blackboard Analytics product is based on Microsoft software including SQL Server. Other University of Maryland campuses were having good experiences with Blackboard Analytics, and their positive recommendations overrode the issue of a different technical environment. Blackboard Analytics proved to be easy to use right out of the box, providing both data warehouse and analysis capabilities, with fact tables and dimension tables for registration, class scheduling, and other functions. Although UMBC required some customization of these tables, the product was designed to make that easy. IT’s project leader said that Blackboard Analytics allowed UMBC to “hit the ground running” with data warehouse and analytics.
While Blackboard Analytics came with ProClarity, other tools are also in use at UMBC. For example, Microsoft SQL Server Reporting Services provides easy-to-use, parameter-driven reports, and Institutional Research is using SAS. IT now offers training for end users and provides general support for these tools. UMBC also expects to look at other reporting tools in the future because Microsoft has announced ProClarity end-of-life for 2016 and is promoting PerformancePoint and Excel.
As faculty and staff become comfortable with what analytics can do for them, IT is now starting to think about tools for predictive analysis, mobile use, and creating analytics dashboards for senior management. IT recognizes the need to find good visualization tools since what they have is “good at presenting walls of numbers, not at presenting visualization where you can easily look for patterns.” With a good partnership with Institutional Research and other end users, UMBC IT sees many opportunities for expanding analytics across the university.
University of Notre Dame
The University of Notre Dame had successfully deployed SAP Business Objects to the enterprise in 2007, and the institution used SAP Data Integrator to create an Advancement Data Warehouse in 2008, a Research Data Warehouse in 2009, and a limited employee data warehouse in 2010. As each implementation matured, however, gaps quickly emerged. For the Business Objects implementation, only technically savvy data analysts were able to use the Web Intelligence tools to create transactional reports, and only advanced Business Objects users were able to create analytical reports. Creating a dashboard required outside
consultants. Many users conducted their analyses in Excel, based on transactional reports created in Business Objects. One of the leaders of the analytics project observed, “We realized we were not meeting all of our customers’ needs. Unless an employee used Business Objects on a regular basis, they simply forgot their training. On the other hand, everyone seemed to be in Excel every day.”
already having the licenses and in-house expertise to deploy the Microsoft Business
Intelligence stack, the decision was made to add this as a second offering for customers. Unlike some past technical decisions, however, IT made this one in partnership with its campus customers. Notre Dame did review other major vendors but rejected them due to lack of internal expertise, cost, and, in one case, concern about the product’s future.
More difficult was addressing the issue of how data were defined and used within the enterprise. “Traditionally, the OIT was responsible for data governance, requirements
gathering, and implementation. We realized that in order to be successful, this has to be a team effort between the functional and technical sides of the house.” Now, when a business
intelligence project is initiated, the IT staff co-locates in the department that owns the data. “With this arrangement, we get the collaboration required to get the job done, and we don’t throw things back and forth over a wall.” Functional and technical staff have to be available before a project is started and the important data governance issues addressed. “In addition, we have stopped trying to use [business intelligence] tools to correct source system
deficiencies or bad data. Functional users now understand the importance of data matching in the source systems and [business intelligence] solutions.”
One final change that the Notre Dame team introduced was to start small. Analytics is by nature iterative, and Notre Dame now recognizes the importance of iterating in analytics projects. “Rather than building an asset for the enterprise and then incurring large costs to make
changes, we build assets for individuals and teams first.” Once these analytics have been used and refined, they are being promoted for use across the enterprise. “Whereas before it would take us several months to a year to deliver usable business intelligence, now a customer can have something in their hands in a few weeks.”
Increasing Maturity with Analytics
This research bulletin provides a broad overview of the infrastructure components of a successful analytics program: data, data processing tools, analytics tools, and governance. Other factors are also important, ranging from culture to staffing to investment, and especially support from institutional leadership. Creating measurements of these factors and monitoring them over time will help institutions become more mature in their support of analytics. ECAR will publish just such an “analytics maturity index” in the near future to provide a guide to understanding where IT departments should be applying their resources. Developing a successful analytics program requires concentrated effort from both IT and other departments, all helping to move toward the goal of using analytics and data-driven decision making across the institution.
Key Questions to Ask
What is IT’s role in the institution’s analytics program?
What data are to be analyzed, and what analytic techniques will be used?
What infrastructure components are necessary to support those analytic techniques? What operational environment will be most appropriate?
Who is responsible for governance, and what types of policies need to be developed? What skills and staffing does IT need to be effective in its role?
Where to Learn More
Bichsel, Jacqueline. Analytics in Higher Education: Benefits, Barriers, Progress, and Recommendations (Research Report). Louisville, CO: EDUCAUSE Center for Applied Research, August 2012, available from http://www.educause.edu/ecar.
Davenport, Thomas H., and Jeanne G. Harris. Competing on Analytics: The New Science of Winning (Boston: Harvard Business School Publishing, 2007).
Davenport, Thomas H., Jeanne G. Harris, and Robert Morison. Analytics at Work: Smarter Decisions, Better Results (Boston: Harvard Business School Publishing, 2010). “ECAR Analytics Maturity Index” (Louisville, CO: EDUCAUSE Center for Applied
Research, forthcoming), available from http://www.educause.edu/library/resources/2012-ecar-study-analytics-higher-education.
EDUCAUSE Analytics Sprint, July 24–26, 2012, reports are available online at
http://www.educause.edu/events/educause-analytics-sprint.
Grochow, Jerrold M. “Analytics and the CIO,” EDUCAUSE Live! webinar (May 10, 2012) and ECAR Symposium presentation (June 20, 2012), available at
http://www.educause.edu/events/educause-live-enterprise-analytics-and-cio.
Seuss, Jack, Michael Dillon, Kevin Joseph, and Yvette Mozie-Ross. “Report Exchange (RED): One Version of the Truth Supporting Student Success Through Data Analytics,” July 23, 2012. http://www.youtube.com/watch?v=PjbYm-FUjws.
Stiles, Randall J., Kristine T. Jones, and Vishvas Paradkar. “Analytics Rising: IT’s Role in Informing Higher Education Decisions” (Research Bulletin 7, 2011). Louisville, CO: EDUCAUSE Center for Applied Research, available from http://www.educause.edu/ecar.
Acknowledgments
The author is indebted to the many colleagues who have shown an interest in implementing analytics and who have engaged in discussions at EDUCAUSE meetings and other forums that contributed to this research. Interviews and comments from the following individuals were specifically helpful in developing the ideas in this paper, although responsibility for any errors and omissions lies fully with the author: Brandon Burke (Office of Information Technologies,
About the Author
Jerrold M. Grochow consults with universities on IT strategy and organization through Jerrold M. Grochow, LLC. He retired as Vice President for Information Services and Technology at the Massachusetts Institute of Technology in 2009 and was Interim Vice President of The
University Corporation for Advanced Internet Development (Internet2) in 2011–2012, responsible for its NET+ cloud computing initiative.
Citation for This Work
Grochow, Jerrold. “IT Infrastructure to Support Analytics: Laying the Groundwork for Institutional Analytics” (Research Bulletin). Louisville, CO: EDUCAUSE Center for Applied Research, October 30, 2012, available from http://www.educause.edu/ecar.
Notes
1. Jacquline Bichsel, Analytics in Higher Education: Benefits, Barriers, Progress, and Recommendations (Research Report), Louisville, CO: EDUCAUSE Center for Applied Research, August 2012, available form
http://www.educause.edu/ecar.
2. The term “business intelligence tools” is sometimes used to refer to this entire suite of tools, reserving the term “analytics tools” just for the analysis tools. Use terminology with caution and be sure you know that everyone in the discussion has a common understanding of how each term is being used.
3. One person interviewed pointed out that “desktop based in-memory engines are in some cases outperforming their bigger brothers,” citing subsecond response time achieved in a 100-million-rows simulation using PowerPivot and visualized using Tableau.
4. Jack Seuss, Michael Dillon, Kevin Joseph, and Yvette Mozie-Ross, “Report Exchange (RED): One Version of the Truth Supporting Student Success Through Data Analytics,” July 23, 2012,