Effect of different Roughage: Concentrate Ratio on Milk Yield
and Its Fatty Acid Profile in Dairy Cows
Netsanet Beyero1*, V. Kapoor2 B.S. Tewatia2
1, Department of Animal and Range Sciences, College of Agriculture, Wolaita Sodo University, Wolaita, Ethiopia.
2, College of Animal Science, Lala Lajpat Rai University of Veterinary and Animal Science, Hisar, India.
Abstract
Experiment was conducted on eighteen crossbred dairy cows divided into three groups of six animals in each group. Cows were fed on roughage (berseem hay, green sorghum forage and wheat straw) and concentrate. The ratio of roughage: concentrate varied in the three treatment groups from 50:50 (T1); 60:40 (T2); and 70:30 (T3). DMI decreased with increasing the level of roughage in the diet. Digestibility of DM, CP, EE, NFE, and OM showed a significant decrease (P <0.05) when R:C was increased. NDF digestibility did not vary between treatment groups. On the other hand, CF and ADF digestibility were significantly (P <0.05) decreased with decreasing R:C. Increasing R:C significantly (P <0.05) decreased milk production, but production of 4% FCM was not affected by forge level. Milk fat concentration was significantly (P <0.05) decreased by 6.30 and 3.78 % in T1 and T2, respectively, as compared T3. Increasing R:C had non significant effect on milk lactose, CP, TS, SNF, MUN, Ca and P level. Milk cholesterol level in T3 was lowered by 13.35 and 8.27% as compared to T1 and T2, respectively. The concentrations of TLCFA, TUFA, MUFA and PUFA were increased with the increase in roughage level in the diet, whereas, TSFA level was reduced. PUFA content of milk fat (g/100g fat) was increased by 141.75% in T3 over T1. Total CLA production (mg/g fat) in T3 was increased by 50.92% over T1. Total feeding cost decreased as the level of roughage in the ration increased. Total feeding cost decreased as the level of roughage in the ration increased. Feeding cost of T3 per g PUFA production reduced by 68% and 48% as compared to T1 and T2, respectively. Feeding cost of T3 per g CLA production was reduced by 47% as compared to T1. The feed cost per kg milk, per g PUFA and CLA production was lowest for the cows fed 70:30 roughage: concentrate ratio diet. In summary, these results suggest that cows producing 12-14kg of milk/d could be best maintained on a dietary regimen of 70% good quality roughage and 30% concentrate to have the maximum production of human health beneficial conjugated linoleic acid without compromising on milk yield.
Keywords: Dairy cow, concentrate, roughage, milk fatty acid, conjugated linoleic acid 1. INTRODUCTION
Milk fat contains a substantial concentration of saturated fatty acids (C14:0 and C16:0) and relatively low concentrations of monounsaturated and polyunsaturated fatty acids (Kennelly and Glimm, 1998). The ideal milk fat wouldcontain 10 percent polyunsaturated fatty acids (PUFA), 8 percent saturated fattyacids (SFA), and 82 percent monounsaturated fatty acids (MUFA). The difference in fatty acid composition between the ideal and the actual milk fats is enormous. Increasing MUFA and PUFA at the expense of saturated fatty acids (C14:0 and C16:0) is desirable from a human health perspective. Human dietary recommendations indicate the need to decrease intake of medium-chain saturatedfatty acids (lauric acid, myristic acid and palmitic acid) to reduce the frequency of cardio-vascular diseases. Moreover, an increased dietary intake of polyunsaturated fatty acids stimulates the immune system and reduces the frequency of cancer and cardio-vascular diseases (Parodi, 1994; Huang et al., 2008).
CLA is an intermediary product of ruminal biohydrogenation of dietary lipids. The biohydrogenation in the rumen that can alter the CLA production in milk fat is affected by the type and the amount of fatty acid substrate (Noble et al., 1974; Halima et al., 2008), and forage to grain ratio (Gerson et al., 1985; Halima et al., 2008) in the diet. The PUFA content of milk fat is an important aspect of establishing its dietetic quality. The nutritional value of milk fat can be improved by pasture feeding (Dhiman et al., 1999), changing the forage-to-concentrate ratio to reduce proportions of saturated fatty acids and enhance the proportions of oleic, linoleic and linolenic fatty acids in bovine ration and increased ruminal production of CLA and its secretion into milk fat (Sutton and Morant, 1989).This study was designed to assess the effect of various roughage: concentrate ratios
on milk yield and its fatty acid composition.
2. MATERIALS AND METHODS
Experimental animals and management
The study was conducted on the Animal farm of College of Veterinary Sciences, Lala Lajpat Rai University of Veterinary and Animal Sciences (LLRUVAS), Hisar, India. Eighteen Cross bred dairy cattle in second to fourth lactation, with average body weight of 395±16.43kg and average daily milk yield 11.65±1.86kg were divided
animals were housed in well ventilated shed and maintained under clean and hygienic condition in the barn of having the arrangement of individual feeding. Fresh and clean tap water was provided free choice to all animals. The experimental animals were given twenty-one days adaptation period. Before starting the experiment, the animals were adapted for 21 days to the diets. The duration of experiment was 60 days from July to September 2011.
Experimental diets and treatments
The experimental animals were kept on diets containing concentrate mixture (Table 2.1) and roughage (berseem hay, sorghum green forage and wheat straw) . Berseem hay was chopped manually to approximately 5-7 cm length before feeding. Sorghum green forage was harvested daily, and chopped manually also to approximately 5-7 cm length and mixed before feeding. Animals were fed to meet the nutrient requirement (NRC, 2001). All the treatments were iso-nitrogenous and iso-caloric. The three treatment groups differed with regard to the different proportion of roughage to concentrate in the diet. The ratio of roughage: concentrate varied from 50:50 (T1); 60:40 (T2) and 70:30 (T3).
Table 2.1 Percent composition of ingredients in concentrate mixture
Ingredients Parts/100kg Groundnut cake 30 Wheat 27 Barely 40 Mineral mixture 2 Common salt 1 Data collection
The experimental feedstuffs were weighed before feeding. Feed refusals were collected from individual animals every morning and weighed. Feed offered and refusals were sampled daily, bulked foe each animal and sub-sampled for chemical analysis. Amount of all feedstuffs (Berseem forage, wheat straw and concentrate mix) offered and refused were measured to quantify feed intake. Animals were hand milking twice a day at 4 a.m. and 5 p.m. during the experimental period and milk yield was recorded by using circular dial type spring balance, with the capacity of 20 kg and an accuracy of ± 0.05 kg, at each milking time. Milk samples for analysis were taken from morning and evening milking at weekly interval. Hundred fifty ml of milk sample was taken from each milking and each animal in milk sampling bottles. The milk samples from morning and evening samples were pooled and milk was thoroughly mixed before analysis.
Digestibility trial
A digestibility trial of five days collection period was conducted at the end of experimental period to determine the digestibility of nutrients. The feeding regime during the digestibility trial was the same as in the feeding experiment. During trials, the sample of feed offered, residue left and faeces voided were collected and the representative samples of daily feeds offered, residue left and faeces voided were collected and oven dried. For nitrogen estimation, 1/600th part of the total faeces was weighed and preserved in 40% H
2SO4, in wide mouthed plastic bottles. At the end of the trial, samples from each animal were pooled, mixed and grounded to 1mm sieve size. The ground samples were stored for further analysis.
Chemical analysis
Samples of feeds offered, refusals and faeces were analyzed for dry matter (DM), total ash, crude protein (CP), ether extract (EE) and crude fibre (CF) (AOAC, 2005), neutral detergent fiber (NDF), acid detergent fiber (ADF) and acid detergent lignin (ADL) contents (Goering and Van Soest, 1970). The calcium content of feed samples was determined by the atomic absorption spectrophotometry and Phosphorus concentration was determined by colorimetric method.
Samples of milk were analyzed for total solid, total fat and protein according to AOAC, 2005. Milk lactose content (Perry and Doon, 1950), cholesterol (Bindal and Jain,1973), milk urea nitrogen (MUN) (Bector et al., 1998), Fatty acid composition (Sukhjia and Palmquist, 1984 modified by Dhiman et al., 1999), CLA content (AOAC, 1995).
Statistical analysis
The data were subjected to analysis of variance using SPSS statistical software version 16.0 for Windows. The means which showed significant differences at the probability level of P <0.05 were compared with each other by using LSD.
3. RESULTS AND DISCUSSION
3.1 Chemical composition of experimental diets
The chemical composition of the diets is presented in Table 3.1.
Table 3.1 Chemical composition of dietary ingredients (concentrate mixture, sorghum forage, berseem hay and wheat straw)
Item Concentrate mixture Sorghum forage Berseem hay Wheat straw
DM 91.27 31.09 87.81 90.35 OM 91.40 91.18 88.87 93.27 NFE 57.60 53.44 43.78 47.15 CP 19.10 7.82 12.60 2.10 EE 6.55 1.70 1.66 1.55 CF 8.15 28.22 30.83 41.97 Ash 8.60 8.82 11.13 6.73 NDF 28.22 63.70 56.67 79.00 ADF 10.47 41.10 38.43 49.85 ADL 4.69 7.60 12.63 12.55 Calcium 1.36 0.64 1.47 0.31 Phosphorus 0.77 0.26 0.32 0.10
3.2 Dry matter intake, Nutrient intake and Nutrient digestibility
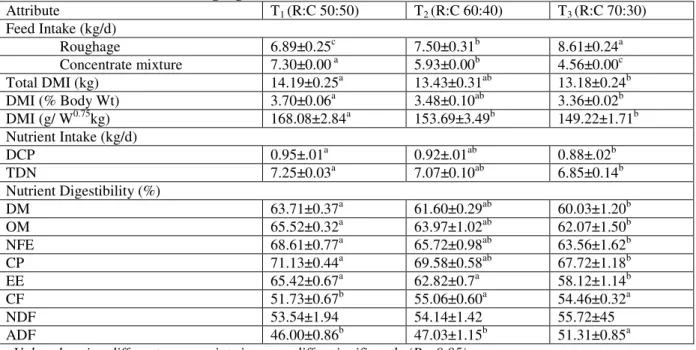
Dry matter intake significant (P <0.05) increased with the decrease in the level of roughage in the diet (Table 3.2). The largest increase was between 50:50 and 60:40 roughage to concentrate (R:C) ratio diets. This is similar to the response of DMI observed by Soita et al. (2005) who reported that feeding a higher level concentrate (R:C ratios 45:55) diet (P <0.05) increased DMI by 1.6 kg/d than diet containing lower proportion of concentrate (55:45 roughage to concentrate ratio). Macleod et al. (1983) also reported a constant increase in DMI until forage was reduced to 35% of the diet. The lower DMI with high roughage diet may be due to limited gut fill capacity in the diets rich in roughage. The intakes of DCP and TDN varied significantly (P <0.05) among treatment groups and the values were highest in T1 (0.95±.01 and 7.25±0.03 kg/d) and lowest in T3 (0.88±.02and 6.85±0.14 kg/d). Increasing roughage: concentrate ratio in the diet of cows significantly (P <0.05) reduced DCP and TDN intakes. Further, studies of Gaafar et al. (2009) and Macleod et al. (1983) also reported that feeding high concentrate (R:C ratio 40:60) diets to buffalos substantially increased DCP and TDN intakes by 30 and 12%, respectively over high roughage (R:C ratio 60:40) diet. In the current study, the increase in DCP and TDN intakes in high concentrate (R:C ratio 50:50) diet was 7.5 and 5.5% over low concentrate (R:C ratio 70:30) diet. This may be attributed to the higher DMI in T1 as compared to T2 and T3 diets.
Table 3.2 Dry matter intake (DMI), nutrient intake and digestibility of nutrients of cows fed diets having different ratios of roughage: concentrate
Attribute T1 (R:C 50:50) T2 (R:C 60:40) T3 (R:C 70:30) Feed Intake (kg/d) Roughage 6.89±0.25c 7.50±0.31b 8.61±0.24a Concentrate mixture 7.30±0.00 a 5.93±0.00b 4.56±0.00c Total DMI (kg) 14.19±0.25a 13.43±0.31ab 13.18±0.24b DMI (% Body Wt) 3.70±0.06a 3.48±0.10ab 3.36±0.02b DMI (g/ W0.75kg) 168.08±2.84a 153.69±3.49b 149.22±1.71b Nutrient Intake (kg/d) DCP 0.95±.01a 0.92±.01ab 0.88±.02b TDN 7.25±0.03a 7.07±0.10ab 6.85±0.14b Nutrient Digestibility (%) DM 63.71±0.37a 61.60±0.29ab 60.03±1.20b OM 65.52±0.32a 63.97±1.02ab 62.07±1.50b NFE 68.61±0.77a 65.72±0.98ab 63.56±1.62b CP 71.13±0.44a 69.58±0.58ab 67.72±1.18b EE 65.42±0.67a 62.82±0.7a 58.12±1.14b CF 51.73±0.67b 55.06±0.60a 54.46±0.32a NDF 53.54±1.94 54.14±1.42 55.72±45 ADF 46.00±0.86b 47.03±1.15b 51.31±0.85a
Increasing the proportion of forage in the diet from 50 to 70% decreased (P <0.05) apparent digestibilities of DM and OM. Higher digestibility of DM and OM in the total tract with low roughage to concentrate ratio agreed with earlier reports (Rode et al., 1985; Sarwar et al., 1992 and Yang et al., 2001) indicating decreased apparent digestibility of DM and OM in the total tract as a result of increase in the proportion of roughage in diet from 35 to 65%. Digestibility of NDF fractions of the diets in treatments tended to be lower when the roughage proportion was increased in the diet, though the differences were non significant. The result of (Kalscheur et al., 1997) indicated that digestibility of NDF was lower (P <0.007) for cows fed low fibre (R:C ratio 25:75) diets than for cows fed high fibre (F:C ratio 60:40) diets. In contrast, Yang et al. (2001) observed lower digestibility of NDF by increasing the R:C ratio from 35:65 to 65:35. Apparent digestibility of ADF and CF was significantly lower (P <0.05) in T1 than in T3. Similar depression of fiber digestibility with high concentrate diets was reported when the percentage of forage in the diet decreased from 60 to 25% (Rode et al., 1985, Kalscheur et al., 1997 and Moorby et al.,2006). The decrease in ruminal fiber digestion in high concentrate diet is believed to be caused by the inhibited growth of cellulolytic bacteria when ruminal pH decreases below 6.2 (Grant and Mertens, 1992).
3.3 Milk yield and its composition
Table 3.3 Milk yield and milk composition of cows fed diets having different ratios of roughage: concentrate Attribute T1 (R:C 50:50) T2 (R:C 60:40) T3 (R:C 70:30) Milk yield (kg/d) 13.78±0.45a 12.96±0.43ab 12.28±0.52b FCM (kg/d) 13.21±0.42 12.67±0.47 12.23±0.53 Fat yield (kg/d) 0.51±0.02 0.50±0.02 0.49±0.02 Milk composition (%) Total solids 11.11±0.52 11.31±0.27 11.14±0.34 Crude protein 3.14±0.04 3.04±0.08 3.01±0.11 Fat 3.72±0.03c 3.85±0.04b 3.97±0.04a Lactose 4.50±0.02 4.46±0.02 4.45±0.03 SNF 7.38±0.53 7.46±0.26 7.16±0.33 Total ash 0.74±0.04 0.72±0.01 0.74±0.01 Calcium 0.108±0.003 0.106±0.004 0.106±0.002 Phosphorus 0.062±0.001 0.063±0.001 0.062±0.002 MUN (mg/dl) 12.74±0.12 12.58±0.08 12.11±0.05 Cholesterol (mg/100ml) 6.03±0.06a 5.76±0.11a 5.32±0.10b
Values bearing different superscripts in a raw differ significantly (P <0.05).
Increasing roughage: concentrate ratio significantly (P <0.05) decreased milk production (Table 3.3), but production of 4% FCM was not affected by forge level, because milk fat content was inversely related to milk production. Increased milk production with increased concentrate feeding has been consistently reported in lactating dairy cows. Macleod et al. (1983) who observed an increase of 0.06 kg milk per percentage unit increase of concentrates, while the increase in current study averaged 0.075 kg milk per percentage unit increase of concentrates. A similar increase in milk yield with increased dietary concentrate has been reported by other workers, (Tuan, 2000; Sanh et al., 2002 and Kuoppala et al., 2004). This was may be attributed to increased DM and energy intake. The lack of effect of R:C ratio on FCM production is also in agreement with earlier reports (Beauchemin and Beauchemin-Smith, 1989; Beauchemin et al., 1994). Increasing roughage: concentrate in the diet of cows increased milk fat production, confirming results of other studies (Loor et al., 2005) in which it was observed that feeding high concentrate (R:C ratio 35:65) diets substantially reduced milk fat percentage (28%) as compared to R:C ratio 65:35 diet. In the current study the reduction was 6.30 and 3.78 % in T1 and T2, respectively, as compared to T3. Similarly, Kalscheur et al. (1997) observed reduction (P <0.01) in milk fat (3.67%) of cows fed low fibre (F:C ratio 25:75) diets compared with cows fed high fibre (F:C ratio 60:40) diets (4.16%). This effect has been commonly reported for high concentrate diets (Macleod et al., 1983; Hansen et al., 1991; Yang et al., 2001 and Moorby et al., 2006) and is clearly an indication of milk fat depression due to ruminal processes (Van Soest, 1963; Bauman et al., 2008). Forage diets high in cellulose give rise to acetic acid, while concentrate diets give rise to propionic acid thereby reducing the proportion of acetic acid (McDonald et al., 2002). High levels of concentrate are conducive to production of propionic acid in the rumen, which in turn promotes partition of energy towards synthesis of body fat instead of milk fat synthesis, resulting in a decrease in milk fat content (Randby, 1996; Sanh et al., 2002). In the present study, protein and lactose percentages in milk did not vary (P <0.05) as roughage: concentrate was increased from 50:50 to 70:30 ratios. A number of earlier reports support this finings (Broster et al., 1985; Sutton et al., 1987 and Sutton, 1989).
It is evident from the present study that dietary R:C ratios did not influence the milk MUN, calcium and phosphorus contents. Cows fed T3 diets had significantly (P <0.05) lower (5.32±0.10) milk cholesterol level than cows in T1 (6.03±0.06), and T2 (5.76±0.11) treatment groups. The cholesterol production value in T3 was lowered by 13.35 and 8.27 % as compared to T1 and T2, respectively. Medium chain fatty acids namely, lauric acid (C12:0), myristic acid (C14:0) and palmitic acid (C16:0) are considered to be cholesterol-raising fatty acids (Berner, 1993; Aloka, 1997). In the current study, the content of each of these fatty acids in milk was significantly (P <0.05) increased when the level of concentrate increased in the diets, and the increased level of cholesterol with increasing concentrate in the diet had similar trends with those fatty acids.
3.4 Fatty acid intake and milk fatty acid profile i. Fatty acid composition of experimental diets
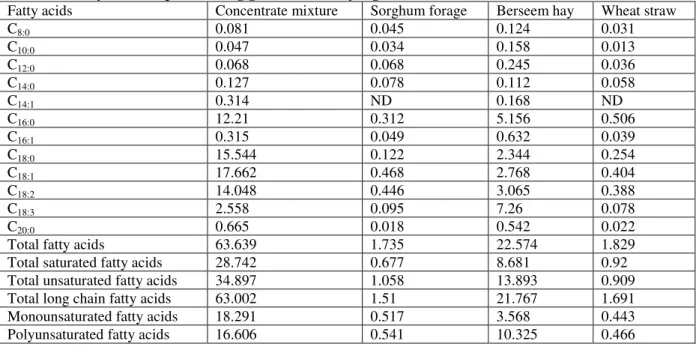
Table 3.4 Fatty acid composition (mg/g DM) of dietary ingredients
Fatty acids Concentrate mixture Sorghum forage Berseem hay Wheat straw
C8:0 0.081 0.045 0.124 0.031 C10:0 0.047 0.034 0.158 0.013 C12:0 0.068 0.068 0.245 0.036 C14:0 0.127 0.078 0.112 0.058 C14:1 0.314 ND 0.168 ND C16:0 12.21 0.312 5.156 0.506 C16:1 0.315 0.049 0.632 0.039 C18:0 15.544 0.122 2.344 0.254 C18:1 17.662 0.468 2.768 0.404 C18:2 14.048 0.446 3.065 0.388 C18:3 2.558 0.095 7.26 0.078 C20:0 0.665 0.018 0.542 0.022
Total fatty acids 63.639 1.735 22.574 1.829
Total saturated fatty acids 28.742 0.677 8.681 0.92
Total unsaturated fatty acids 34.897 1.058 13.893 0.909
Total long chain fatty acids 63.002 1.51 21.767 1.691
Monounsaturated fatty acids 18.291 0.517 3.568 0.443
Polyunsaturated fatty acids 16.606 0.541 10.325 0.466
ND- Not detectable
The composition of fatty acids (g/g DM) in the dietary ingredients has been presented in Table 3.4. Result on Table 3.4 indicated that linoleic (C18:2) and linolenic (C18:3) acids when consider together contributed 45.74% and 31.18% of the total fatty acids in berseem hay and sorghum forage, respectively while total contribution of theses fatty acids towards concentrate mixture fat was 26.09%. Total saturated fatty acids concentration (mg/g DM) in concentrate mixture was 28.742 and the corresponding values for berseem hay and sorghum forage were 0.677 and 8.681 respectively. The data revealed that concentration of Total unsaturated fatty acids (TUFA) accounted 54.69, 60.98 and 61.54% of total fat in concentrate, berseem hay and sorghum forage, respectively.
ii. Fatty acids intake
Feeding high concentrate diet (T1) increased (P <0.05) total fatty acid intake by 49.7 and 83.71g/d as compared to T2 and T3, respectively (Table 3.5). The intake of oleic (C18:1) and linoleic (C18:2) acid was also were greater (P <0.05) in response to high concentrate (T1) diet; however linolenic (C18:3) acid intake was lower (14.1 and 23.33g/d) with T1 vs. T2 and T3, respectively. A significantly higher intake of oleic and linoleic acid in T1 was reflected on TUFA intake. Similarly, Loor et al. (2004) reported that feeding high concentrate diet increased total fatty acid intake by 109g/d, and oleic and linoleic acid intakes were also greater in response to higher concentrate (35:65 ratio of R:C) diets, however linoleinic acid intake was lower by 26.6 g/d with high concentrate diet as compared to low concentrate high roughage (65:35 ratio of R:C) diets. High intake of oleic and linoleic acid in T1 cows is a reflection of higher level of those fatty acids in concentrate (Table 3.4). MUFA intake followed a similar trend like oleic acid intake, as oleic acid contributed about 95% of the total MUFA. Daily intake of PUFA intake ranged between 125.13±0.85 (T3) to 128.48±1.00 (T1).
Table 3.5 Fatty acids intake of cows fed diets different ratios of roughage: concentrate
Fatty acid Intake (g/d) T1 (R:C 50:50) T2 (R:C 60:40) T3 (R:C 70:30)
C8:0 0.96±0.02b 1.01±0.02b 1.15±0.01a C10:0 0.64±0.02c 0.81±0.02b 1.09±0.01a C12:0 1.07±0.03c 1.32±0.03b 1.75±0.02a C14:0 1.54±0.02a 1.45±0.02b 1.46±0.01b C14:1 2.35±0.01a 2.21±0.02b 2.19±0.01b C16:0 93.15±0.53a 85.06±0.56b 80.57±0.43c C16:1 2.86±0.06c 3.48±0.07b 4.54±0.05a C18:0 115.18±0.24a 97.83±0.25b 82.14±0.19c C18:1 133.31±0.32a 113.35±0.33b 95.40±0.25c C18:2 106.85±0.35a 92.40±0.36b 80.14±0.27c C18:3 21.63±0.66c 30.89±0.76b 44.99±0.58a C20:0 5.16±0.05b 5.18±0.06b 5.58±0.04a
Total saturated fatty acids 217.71±0.90 a 192.67±0.96 b 173.73±0.73c Total unsaturated fatty acids 267.00±1.40a 242.34±1.54b 227.26±1.17c Total long chain fatty acids 478.14±2.21a 428.20±2.40b 393.34±1.82c Monounsaturated fatty acids 138.52±0.40a 119.05±0.42b 102.13±0.32c Polyunsaturated fatty acids 128.48±1.00a 123.29±1.12b 125.13±0.85b Values bearing different superscripts in a raw differ significantly (P <0.05).
iii. Fatty acid profile of milk fat
Fatty acid profile of milk of cows under experimental feeding is shown in Table 3.6. The Table revealed that as the dietary roughage proportion increased there was a significant (P <0.05) reduction in the concentration (g/100g fat) of C10:0, C12:0, C14:0 and C16:0 fatty acids. Lower percentages of these fatty acids in cows fed high fiber diet were also reported by AlZahal et al. (2008). Similarly, Martini et al. (2010) also observed decreased values of some medium chain fatty acids viz. C12:0 (14.89%) and C14:0 (4.03%) with the increase in roughage level in the diet of lactating ewes. On the other hand, an inverse effect (P <0.05) was observed in relation to the palmitoleic (C16:1), stearic (C18:0), oleic (C18:1), linoleic (C18:2), and linolenic (C18:3) acids, which increased with the level of increased roughage in the diet. Even if linoleic acid intake was significantly (P <0.05) higher in T1, milk linoleic acid was significantly lower, while milk linolenic acid was increased with intake (Table 3.5 and Table 3.6). A high level of milk saturated fatty acid and lower linoleic acid concentration in T1 may be explained on the basis that ruminal biohydrogenation of unsaturated FA was comparatively more complete in cows fed linoleic acid than in cows fed linolenic acid.
Table 3.6 Fatty acid composition (g/100g) of milk fat of cows fed diets having different ratios of roughage: concentrate Fatty acids T1 (R:C 50:50) T2 (R:C 60:40) T3 (R:C 70:30) C8:0 0.96±0.05 0.94±0.05 1.13±0.09 C10:0 2.48±0.15a 2.18±0.10ab 2.02±0.15b C12:0 3.21±0.12 3.03±0.13 3.03±0.23 C14:0 13.26±0.24a 10.77±0.17b 9.23±0.15c C14:1 1.44±0.09b 1.70±0.13ab 1.78±0.08a C16:0 26.80±2.06 26.37±0.32 25.24±0.23 C16:1 2.04±0.12b 2.53±0.13a 2.46±0.12a C18:0 17.59±0.23a 16.91±0.12b 16.16±0.20b C18:1 23.58±0.33c 27.01±0.15b 28.30±0.20a C18:2 2.08±0.07c 3.28±0.08b 4.13±0.08a C18:3 1.01±0.05c 1.94±0.11b 3.34±0.27a C20:0 0.89±0.06a 0.65±0.06b 0.71±0.06b
Total saturated fatty acids 65.19±2.15a 60.86±0.59b 57.53±0.28c Total unsaturated fatty acids 30.16±0.29c 36.46±0.36b 40.01±0.21a Total long chain fatty acids 74.00±2.09b 78.70±0.42a 80.35±0.33a Monounsaturated fatty acids 27.06±0.35c 31.24±0.27b 32.55±0.20a Polyunsaturated fatty acids 3.09±0.08c 5.22±0.14b 7.47±0.21a
Total CLA (mg/g fat) 10.31±0.28c 12.10±0.35b 15.56±0.33a
Total long chain fatty acids (TLCFA), total unsaturated fatty acids (TUFA), monounsaturated fatty acids (MUFA) and polyunsaturated fatty acids (PUFA) increased significantly (P <0.05) with the increased proportion of roughage in the diet (Table 3.6). Total MUFA content varied from 28.38 (T1) to 33.37 (T3) % of milk fat. The concentration of PUFA was highest in T3 (7.66 % of milk fat) and lower in T1 (3.24 % of milk fat). Polyunsaturated fatty acids content of milk fat (g/100g fat) was increased by 68.93 and 141.75% in T2 and T3, respectively over T1. Polyunsaturated fatty acids are not synthesized by the tissue of ruminants, so their concentration in the milk strictly depends on the amount of the fat absorbed in the intestines and, therefore, on the amounts released in the rumen. Therefore, the increase in the roughage level proportionally decreases the concentrate contents and hence the availability of unsaturated fatty acids to be used by the mammary gland in the synthesis of milk lipids (Grummer, 1991; Chilliard et al., 2001b and Mesquita et al., 2008). Dairy cows on herbage-based diets derive fatty acids for milk fat synthesis from the diet and rumen microorganisms (400–450 g/kg), from adipose tissues (< 100 g/kg), and from de novo biosynthesis in the mammary gland (about 500 g/kg) (Kalač and Samkova, 2010). The relative contributions of these FA sources to milk fat production are highly
dependent upon feed intake, and diet composition. High intake of concentrate diet is associated with a higher level of de novo synthesis resulting in more saturated milk fat. In contrast, higher intakes of PUFAs from forage result in higher concentrations of oleic acid, vaccenic acid and CLA in milk fat (Walker et al., 2004).
Concentrations of CLA were significantly (P <0.05) affected by dietary treatment varying in the proportion of roughage: concentrate (Table 3.6). Total CLA yield (mg/g fat) averaged 10.31±0.28, 12.10±0.35, and 15.56±0.33 in T1, T2 and T3, respectively. Total CLA content (mg/g fat) in T3 increased by 50.92 and 17.36% over T1 and T2, respectively. Results from current study are in agreement with the previous reports of Tyagi et al.(2008) who reported that total CLA content averaged 18.0 and 6.6 mg/g in berseem and concentrate fed animals, respectively which showed 3 fold increases in total CLA content by green fodder feeding. Dhiman et al. (1999) also reported highest CLA content in the milk of cows fed solely on pasture than those fed on one third and two third pastures. Schroeder et al. (2003) recorded 2-3 fold higher milk CLA concentration in dairy cows fed pasture as compared with TMR.
4.4 Economics of feeding
Table 3.7 Economics of feeding for milk production and milk quality parameters in cows fed different ratios of roughage to concentrate
Attribute T1 T2 T3
Cost of feeding concentrate mixture (USD/d) 2.04±0.00 1.66±0.00 1.27±0.016 Cost of feeding roughage (USD/d) 0.50±0.018 b 0.52±0.022 b 0.58±0.00 a Total feeding cost (USD/d) 2.54±0.018 a 2.18±0.022 b 1.86±0.016 c
Total milk production (kg/d) 13.78a 12.96ab 12.28b
Feeding cost/ kg milk production (USD) 0.18±0.005 a 0.17±0.006 ab 0.15±0.007 b
Total fat yield (kg/d) 0.513 0.500 0.488
Feeding cost/ kg fat yield (USD) 4.95±0.127 a 4.35±0.182 b 3.81±0.177 c
PUFA yield (g/100g fat) 3.09c 5.22b 7.47a
PUFA yield (g/d) 15.84c 26.08b 36.31a
Feeding cost/g PUFA (USD) 0.16±0.004 a 0.08±0.004 b 0.05±0.002 c
Total CLA yield (mg/g fat) 10.31c 12.10b 15.56a
Total CLA yield (g/d) 5.27c 6.03b 7.56a
Feeding cost/ g CLA (USD) 0.49±0.006 a 0.36±0.014 b 0.26±0.008 c
Values bearing different superscripts in a raw differ significantly (P <0.05).
The feeding cost was lowest in group T3 cows fed on diet having 70% roughage and it was highest in group T1 in cows fed on the diet containing 50% roughage. The feeding cost (USD/d) was calculated by taking into account the cost of feed ingredients i.e. roughage and concentrate mixture. Total feeding cost was lowest (USD 1.86 /d) for cows fed on 70 % roughage, followed by the cows fed 60% roughage (USD 2.18/d) and (USD 2.54 /d) cows fed 50% roughage. Feeding cost per g PUFA production in group T3 was reduced by 68% and 48% as compared to T1 and T2, respectively. .Feeding cost per g CLA production was reduced by 47% in T3 as compared to T1. The feed cost per kg milk produced, per g PUFA and per g CLA production was lowest for the cows fed roughage and concentrate in the ratio of 70:30. It was inferred that cows producing 12-14kg of milk/d could be best maintained on a dietary regimen of 70% roughage and 30% concentrate to have the maximum human health beneficial conjugated linoleic acid without compromising on milk yield.
CONCLUSION
cow milk compared to concentrate-feeding. It may be inferred that cows producing 12-14kg of milk/d could be best maintained on a dietary regimen of 70% good quality roughage i.e. berseem hay and 30% concentrate to have the maximum production of human health beneficial fatty acids (PUFA including CLA) without compromising on milk yield.
REFERENCES
Agle, M., Hristov, A. N., Zaman, S., Schneider, C., Ndegwa, P. M. and Vaddella, V. K. 2010. Effect of dietary concentrate on rumen fermentation, digestibility and nitrogen losses in dairy cows. J. Dairy Sci.,
93:4211–4222.
AlZahal, O., Or-Rashid, M. M., Greenwood, S.L., Douglas, M. S. and McBride, B.W. 2008. The effect of dietary fiber level on milk fat concentration and fatty acid profile of cows fed diets containing low levels of polyunsaturated fatty acids. J. Dairy Sci., 92:1108-1116.
AOAC. 1995. Association of Official Analytical Chemists. Official methods of analysis. 16th ed. Arlington, VA. AOAC. 2005. Association of Official Analytical Chemists. Official Methods of Analysis. 18th ed. Washington
D.C.
Bauman, D. E., Perfield, J. W., Harvatine, K. J., and Baumgard, L. H.. 2008. Regulation of fat synthesis by CLA: Lactation and the ruminant model. J. Nutr.,138:403–409.
Beauchemin, K. A. and Beauchemin-Smith, J. G. 1989. Effect of dietary neutral detergent fibre concentratipn and supplementary long hay on chewing activities and milk production of dairy cows. J. Dairy Sci.,
72:2288-2300.
Beauchemin, K. A., Farr, B. I., Rode, L.M. and Schaalje, G. B. 1994. Effect of alfalfa silage chop length and supplementary long hay on chewing and milk production of dairy cows. J. Dairy Sci.,77:1326-1339.
Bector, B. S., Moti, R. and Singhal, O. P. 1998. Rapid platform test for the detection/ determination of added urea in milk. Indian. Dairyman,50(4): 59-62.
Berner, L. A. 1993. Round table discussion on milk fat, dairy foods and coronary heart disease risk. J. Nutri.,
123:1175.
Bindal, M. P. and Jain, M. K. 1973. Determination of cholesterol content of ghee. J. Ind. Chem. Soc.,50: 63.
Broster, W. H., Sutton, J. D., Bines, J. A., Broster, V. J., Smith, T., Siviter, J. W., Johnson, V. W., Napper, D. J. and Schuller, E.. 1985. The influence of plane of nutrition and diet composition on the performance of dairy cows. J. Agric. Sci., (Camb.) 102:535.
Chilliard, Y., Ferlay, A. and Doreau, M. 2001b. Contrôle de la qualité nutritionnelle des matières grasses du lait par l’alimentation des vaches laitières: acides gras trans, polyinsaturés, acide linoléique conjugué. INRA Productions Animales. 14: 323-335.
Dhiman, T. R., Anand, G. R, Satter, L. D. and Pariza, M.W. 1999. Conjugated linoleic acid content of milk from cows fed different diets. J. Dairy Sci.,82: 2146–2156.
Gaafar, H. M. A., Mohi El-Din, A. M. A., Basiuoni, M.I. and El-Riedy, K. F. A. 2009. Effect of concentrate to roughage ratio and baker’s yeast supplementation during hot season on performance of lactating buffaloes. Slovak J. Anim. Sci., 42 (4): 188-195.
Gerson, T., John, A. and King, A. S. D. 1985. The effects of dietary starch and fiber on the in vitro rates of lipolysis and hydrogenation by sheep rumen digesta. (Camb.) J. Agric. Sci.,105:27-30.
Goering, H. K. and Van Soest, P. J. 1970. Forage fibre Analysis (apparatus, reagents, procedures and some applications), Agricultural Hand book, No.379. USDA, Washington D.C.
Grant, R. J. and Mertens, D. R. 1992. Influence of buffer pH and raw corn starch addition on invitro fiber digestion kinetics. J. Dairy Sci., 75:2762–2768.
Grummer, R. R. 1991. Effect of feed on the composition on milk fat. J. Dairy Sci. 74: 3244-3257.
Halima, S., Takeshi, I., Toshilhiro, S., Shuhei, K. and Hisao, I. 2008. Effect of feeding Ca-salts of fatty acids from soybean oil and linseed oil on c9,t11-CLA production in ruminal fluid and milk of Holstein dairy cows. Asian-Aust. J. Anim. Sci., 21(9): 1262-1270.
Hansen, W. P., Otterby, D. E, Linn, J. G. and Donker, J. D. 1991. Influence of forage type, ratio of forage to concentrate, and methionine hydroxy analog on performance of dairy cows. J. Dairy Sci., 74
:1361-1369.
Huang, Y., Schoonmaker, J. P., Bradford, B. J. and Beitz, D. C. 2008. Response of Milk Fatty Acid Composition to Dietary Supplementation of Soy Oil, Conjugated Linoleic Acid, or Both. J. Dairy Sci., 91:260-270.
Kalač, P. and Samkova, E. 2010. The effects of feeding various forages on fatty acid composition of bovine milk
fat. Review Article. Czech J. Anim. Sci., 55(12): 521-537.
Kalscheur, K. F., Teter, B. B., Piperova, L. S. and Erdman, R. A. 1997. Effect of dietary forage concentration and buffer addition on duodenal flow of trans-C18:1 fatty acids and milk fat production in dairy cows. J. Dairy Sci., 80:2104-2114.
Sci., 78:23.
Kuoppala, K., Yrjanen, S., Jaakkola, S., Kangasniemi, R., Sariola J. and Khalili, H. 2004. Effects of increasing concentrate energy supply on the performance of loose-housed dairy cows fed grass silage-based diets. Livest. Prod. Sci.,85:15–26.
Loor, J. J., Ferlay, A., Ollier, A., Doreau, M. and Chilliard, Y. 2005. Relationship among trans and conjugated fatty acids and bovine milk fat yield due to dietary concentrate and linseed oil. J. Dairy Sci., 88
:726-740.
Macleod, G. K., Grieve, D. G. and McMillan, I. 1983. Performance of first lactation dairy cows fed complete rations of several ratios of forage to concentrate. J. Dairy Sci., 66:1668-1674.
Martini, M. Liponi, G. B. and Salari, F. 2010. Effect of forage:concentrate ratio on the quality of ewe's milk, especially on milk fat globules characteristics and fatty acids composition. J. Dairy Res., 77
(2):239-44.
McDonald, P., Edwards, R. A., Greenhalgh, J. F. D. and Morgan, C. A. 2002. Animal Nutrition. 6th ed., Pearson Education, Harlow. pp.182-187.
Mesquita, Í. V. U., Roberto, G. C., Rita de Cássia, R. E. Q., Ariosvaldo, N. M. and Alexandre, R. P. S. 2008. Profile of milk fatty acids from Moxotó goats fed with different levels of Manicoba (Manihot Glaziovii Muel Arg.) silage. Brazil. Archives Biol. and Technol.,51 (6): 1163-1169.
Moorby, J. M., Dewhurst, R. J., Evans, R. T. and Danelon, J. L. 2006. Effects of dairy cow diet forage proportion on duodenal nutrient supply and urinary purine derivative excretion. J. Dairy Sci., 89
:3552-3562.
Noble, R. C., Moore, J. H. and Harfoot, C. G.1974. Observations on the pattern on biohydrogenation of esterified and unesterified linoleic acid in the rumen. Br. J. Nutr., 31: 99-108.
NRC 2001. National Research Council. Nutrient of Requirement of Dairy Cattle. 6th ed. National Academy of Sciences, Washington, D.C. USA.
Parodi, P. W. 1994. Conjugated linoleic acid: An anticarcinogenic fatty acid present in milk fat. Aust. J. Dairy Technol.,49:93-97.
Randby, A. T. 1996. Nutritional effects of increased use of concentrate in dairy cows. Norsk Landbruksforsking 10:59-74. Cited by: Sanh M. V., Wiktorsson, H. and Ly, L. V. 2002. Effects of natural grass forage to concentrate ratios and feeding principles on milk production and performance of crossbred lactating cows. Asian-Aust. J. Anim. Sci., 15(5): 650-657.
Rode, L. M., Weakley, D. C. and Satter, L. D. 1985. Effect of forage amount and particle size in diets of lactating dairy cows on site of digestion and microbial protein synthesis. Can. J. Anim. Sci.,65
:101-111.
Sanh, M. V., Wiktorsson, H. and Ly, L. V. 2002. Effects of natural grass forage to concentrate ratios and feeding principles on milk production and performance of crossbred lactating cows. Asian-Aust. J. Anim. Sci.,
15(5): 650-657.
Sarwar, M., Firkins, J. L. and Eastridge, M. L. 1992. Effect of forage and concentrate carbohydrates on nutrient digestibilities and milk production by dairy cows. J. Dairy Sci., 75: 1533-1542.
Schroeder, G. F., Delahoy, J. E., Vidaurrete, I., Bargo, F., Gagliostro, G. A. and Muller, L. D. 2003. Milk fatty acid composition of cows fed a total mixed ration or pasture plus concentrates replacing corn with fat. J. Dairy Sci.,86: 3237-3248.
Soita, H. W., Fehr, M., Christensen, D. A. and Mutsvangwa, T. 2005. Effect of corn silage particle length and forage: concentrate ratio on milk fatty acid composition of dairy cows fed supplemental flaxseed. J. Dairy Sci., 88:2813-2819.
SPSS. 2007. Statistical Program for Social Sciences (SPSS) Version 16.0 for Windows.
Sutton, J. D., Bines, J. A., Morant, S.V., Napper, D. J. and Givens, D. I. 1987. A comparison of starchy and fibrous concentrates for milk production, energy utilization and hay intake by Friesian cows. J. Agric. Sci., (Camb.)109:375.
Sutton, J. D.1989. Altering milk composition by feeding. J. Dairy Sci.,72:2801-2814.
Sutton, J. D. and Morant S. V. 1989. A review of the potential of nutrition to modify milk fat and protein. Livest. Prod. Sci., 23:219-237.
Tamminga, S. 1981. Effect of the roughage/concentrate ratio on nitrogen entering the small intestine of dairy cows. Meth.J. Agric. Sci.,29:273.
Tuan, B. Q. 2000. Effects of Protein and concentrate levels on rumen digestion and milk production of crossbed dairy cattle in Hanoi. Ph.D Thesis. University of Agriculture, Hanoi, Vietnam.
Tyagi, A., Kewalramani, N., Kaur, H. and Singhal, K. K.. 2008. Effect of green fodder feeding on conjugated linoleic acid in milk and ghee (clarified butter oil) of Cows and Buffaloes. Pakist. J. Agri. Sci., 45(2):
342-352.
feed efficiency. Review Article. J. Dairy Sci.,46:204-216.
Walker, G. P., Dunshea, F. R. and Doyle, P. T. 2004. Effects of nutrition on the production and composition of milk fat and protein: Review Article. Aust. J. Agri. Res.,55: 1009-1028.
White, S. L., Bertrand, J. A., Wade, M. R. and Washburn, S. P. 2001. Comparison of fatty acid content of milk from Jersey and Holsteincows consuming pasture or a total mixed ration. J. Dairy Sci.,84:2295-2301.
Yang, W. Z., Beauchemin, K. A, and Rode, L. M. 2001. Effects of grain processing, forage to concentrate ratio, and forage particle size on rumen pH and digestion by dairy cows. J. Dairy Sci., 84:2203-2216.