An OLAP Tool Based on the Bitmap Join Index
Anderson Chaves Carniel1, Thiago Luís Lopes Siqueira2,31 São Paulo Federal Institute of Education, Science and Technology, IFSP, Salto Campus, 13.320-271, Salto, SP, Brazil
2 São Paulo Federal Institute of Education, Science and Technology, IFSP, São Carlos Campus, 13.565-905, São Carlos, SP, Brazil
3 Computer Science Department, Federal University of São Carlos, UFSCar, 13.565-905, São Carlos, SP, Brazil
[email protected], [email protected]
Abstract. Data warehouse and OLAP are core aspects of business intelligence environments, since the former store integrated and time-variant data, while the latter enables multidimensional queries, visualization and analysis. The bitmap join index has been recognized as an efficient mechanism to speed up queries over data warehouses. However, existing OLAP tools does not use strictly this index to improve the performance of query processing. In this paper, we intro-duce the BJIn OLAP tool to efficiently perform OLAP queries over data ware-houses, such as roll-up, drill-down, slice-and-dice and pivoting, by employing the bitmap join index. The BJIn OLAP tool was validated through a perfor-mance evaluation to assess its efficiency and to corroborate the feasibility of adopting the bitmap join index to execute OLAP queries. The performance re-sults reported that our BJIn OLAP tool provided a performance gain that ranged from 31% up to 97% if compared to existing solutions.
Keywords: bitmap join index, OLAP, drill-down, roll-up, slice-and-dice, pivoting.
1
Introduction
Business Intelligence solutions (BI) are widely adopted by management sectors of enterprises to aid processing, analysis and interpretation of their data, aiming at posi-tively impacting strategy, tactics, and operations. Data warehouse (DW) and Online Analytical Processing (OLAP) are core aspects of BI environments [20]. The DW is a subject-oriented, integrated, time-variant and non-volatile dimensional database [11], while OLAP provides tools to perform multidimensional queries over the DW and to support visualization and analysis of the DW [8]. Combining both the DW and OLAP enables a better monitoring of business. Therefore, many OLAP tools have been de-veloped to end users visualize and manipulate multidimensional data, such as Oracle BI (www.oracle.com/bi) [7] and Mondrian (mondrian.pentaho.com) [4].
The multidimensional operations commonly supported by OLAP tools are drill-down, roll-up, slice-and-dice and pivoting [5]. They force the OLAP tool to challenge performance issues, since costly joins among huge fact and dimension tables as well as groping operations are required together with predicates that filter the results. Aim-ing at reducAim-ing the query response time in DW, well-known methods as vertical fragmentation [9], view materialization [1][10] and indices [2][13][18] were pro-posed. However, none of the studied OLAP tools has investigated the feasibility of adopting exclusively the bitmap join index [13] to improve the query processing per-formance in DW, although this index avoids costly join operations. Providing such investigation is one of the contributions of this paper. In addition we introduce in this paper the BJIn OLAP Tool (Bitmap Join Index OLAP Tool) to efficiently perform
drill-down, roll-up, slice-and-dice and pivoting OLAP operations, as our main contri-bution.
The remaining of this paper is organized as follows. Section 2 summarizes the technical background necessary to comprehend this paper. Section 3 introduces the BJIn OLAP Tool. Section 4 discusses the experimental results. Section 5 surveys related work. Finally, Section 6 concludes the paper and addresses future work.
2
Technical Background
2.1 Data Warehouse and OLAP
Fig. 1 shows a star schema representing a retail application, which is derived from the Star Schema Benchmark (SSB) [14]. Lineorder is the fact table that measures sales and orders, while Customer, Supplier, Part and Date are dimension tables that redun-dantly store descriptive attributes that categorize the facts. Also, the dimension tables hold hierarchies that enable data aggregation according to different granularity levels, such as (c_region) (c_nation) (c_city) (c_address), which is held by the di-mension table Customer. An alternative to the star schema is the snowflake schema that normalizes the hierarchies, but introduces new costly join operations among di-mension tables in order to process queries [12].
Hierarchies are a core aspect for drill-down and roll-up OLAP operations. A drill-down operation decomposes data from the fact to lower levels of a defined hierarchy, then increasing data details. Inversely, a roll-up operation aggregates data from the fact to upper levels of a defined hierarchy, then summarizing data [5]. Fig. 2 shows examples of these queries adapted from [14], using existent hierarchies in tables Cus-tomer and Supplier. Considering that the user firstly issued the query of Fig. 2a and later issued the query of Fig. 2b, there was a drill-down operation based on both
(c_nation) (c_city) and (s_nation) (s_city). On the other hand, if the user had issued the queries inversely, there was a roll-up operation based also on those men-tioned hierarchies. The underlined attributes in Fig. 2 highlight these operations.
Both the queries of Fig. 2a and Fig. 2b also exemplify the slice-and-dice operation, which consists of applying filters to the resulting data [5], such as “c_region = 'ASIA'
AND s_region = 'ASIA' AND d_year >= 1992 AND d_year <= 1997”, shown in Fig.
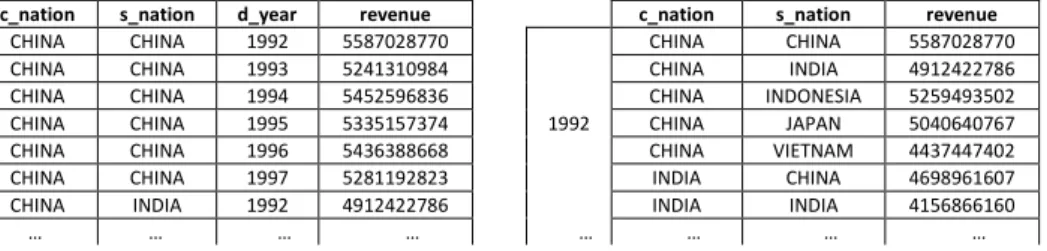
2a. Finally, the pivoting operation enables reordering results by switching columns and rows axis [5]. Fig. 3a shows the results for the query of Fig. 2a, whose column
d_year was pivoted to be a row, providing the results of Fig. 3b. The representation of results in Fig. 3 is also known as a cross table.
OLAP tools support OLAP operations that are executed over DW such as drill-down, roll-up, slice-and-dice and pivoting, and enables multidimensional visualiza-tion and analysis, by accessing the data cube through Multidimensional Expressions (MDX) [19]. For instance, Mondrian is an open source OLAP server that follows these characteristics and reports query results on Java Server Pages by rendering the cross table through JPivot [4]. Before enabling OLAP operations, Mondrian reads the XML data cube definition that the user had previously described using the Mondrian Schema Workbench. This definition ensures the proper access to fact and dimension tables when executing queries.
SELECT c_nation, s_nation, d_year, sum(lo_revenue) AS revenue FROM customer, lineorder, supplier, date WHERE lo_custkey = c_custkey AND lo_suppkey = s_suppkey AND lo_orderdate = d_datekey
AND c_region = 'ASIA' AND s_region = 'ASIA' AND d_year >= 1992 AND d_year <= 1997 GROUP BY c_nation, s_nation, d_year ORDER BY d_year ASC, revenue DESC;
SELECT c_city, s_city, d_year, sum(lo_revenue) AS revenue FROM customer, lineorder, supplier, date WHERE lo_custkey = c_custkey AND lo_suppkey = s_suppkey AND lo_orderdate = d_datekey
AND c_nation = 'JAPAN' AND s_nation = 'JAPAN' AND d_year >= 1992 AND d_year <= 1997 GROUP BY c_city, s_city, d_year ORDER BY d_year ASC, revenue DESC; (a) querying the nation granularity (b) querying the city granularity
Fig. 2. Roll-up and drill-down operations
c_nation s_nation d_year revenue c_nation s_nation revenue
CHINA CHINA 1992 5587028770
1992
CHINA CHINA 5587028770 CHINA CHINA 1993 5241310984 CHINA INDIA 4912422786 CHINA CHINA 1994 5452596836 CHINA INDONESIA 5259493502 CHINA CHINA 1995 5335157374 CHINA JAPAN 5040640767 CHINA CHINA 1996 5436388668 CHINA VIETNAM 4437447402 CHINA CHINA 1997 5281192823 INDIA CHINA 4698961607 CHINA INDIA 1992 4912422786 INDIA INDIA 4156866160
… … … …
2.2 Improving query processing performance over data warehouses
The costly way to process a query over a DW is to perform the star-join, by joining all tables of the star schema and then perform filters, groupings and sorting. In this sec-tion, some methods to provide a better query processing performance are described.
The bitmap index [18] builds one bit-vector to each distinct value v of the indexed attribute A. The attribute cardinality, |A|, is the number of distinct values of A and determines the quantity of bit-vectors. All bit-vectors have as many bits as the number of rows found in the indexed table. If for the i-th record of the table we have that A =
v, then the i-th bit of the bit-vector built for value v is set to 1. Otherwise, the bit is set to 0. Currently, the FastBit [15] is an efficient implementation of the bitmap index.
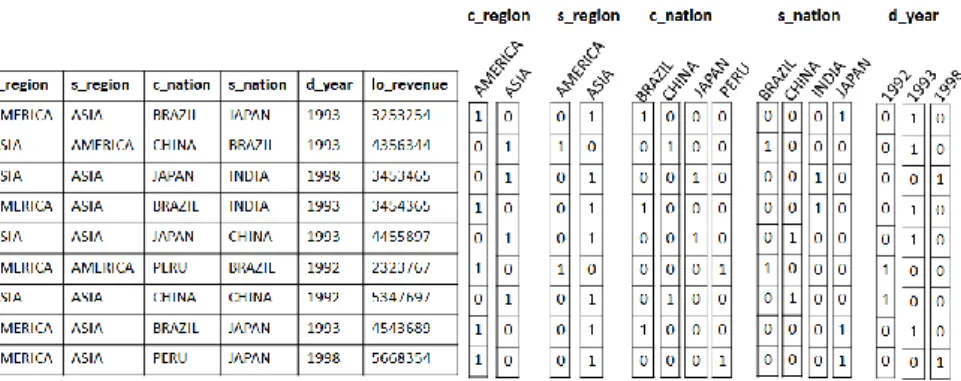
A bitmap join index [13] can be created on the attribute B of a dimension table in order to indicate the set of rows in the fact table to be joined with a certain value of B. Therefore, each bit determines the rows of the fact table where a given value of B exists. Fig. 4a shows the table obtained from applying Π c_region, s_region, c_nation, s_nation, d_year, lo_revenue (Customer Lineorder Supplier Date) on the star schema shown in Fig. 1, i.e. this table is fact table joined with the dimensions Customer, Supplier
and Date. In Fig. 4b, bitmap join indices were built on attributes c_region, s_region,
c_nation, s_nation and d_year to improve the performance when processing the query shown in Fig. 2a. As a result, these indices indicate the tuples of the fact table where a given value occurs. For instance, d_year = 1998 occurs in the 3rd and last tuples. Pred-icates involving logical operations are easily solved using bit-wise operations. For instance, consider “d_year >= 1992 AND d_year <= 1997”. This predicate is solved
by executing 000001100 OR 110110010, to obtain 110111110 and then exclude the 3rd and the last tuples from the result set. Joins among huge DW tables are necessary only once to build the bitmap join index. After the index is built, the queries can be processed by accessing the index, avoiding joins. High cardinality attributes may impair the performance of the bitmap index, but binning, encoding and compression techniques can minimize these losses [18].
The table shown in Fig. 4a is also known as a vertically fragmented view [9] and maintains the minimum set of columns of the star schema that are necessary to answer the query shown in Fig. 2a. Note that all necessary joins were computed when com-posing the view. Therefore, this view can be stored aiming at improving the query processing performance, since only filters and groupings need to be computed and joins are avoided. On the other hand, materialized views are another method to en-hance the query processing over DW, as they pre-compute the DW information that can be used to answer queries that are frequently issued. A materialized view is built by creating a fact table to report pre-computed data from another fact table that was joined to dimension tables, and whose measures were aggregated. Since a material-ized view stores pre-computed aggregated data, its query processing avoids joins and groupings, and drastically reduces the number of rows then benefiting the filters. For instance, a materialized view can be created as GSUM (lo_revenue) (Π c_region, s_region, c_nation, s_nation, d_year, lo_revenue (Customer Lineorder Supplier Date) ) to efficiently answer the query shown in Fig. 2a. Both vertically fragmented views and materialized views can be applied to OLAP tools to enhance the query processing performance.
(a) a vertically fragmented view (b) the corresponding bitmap join indices Fig. 4. How bitmap join indices are built
3
The Bitmap Join Index OLAP Tool
The Bitmap Join Index OLAP Tool (BJIn OLAP Tool) was developed as an open source OLAP server written in Java that accesses bitmap join indices to speed up the OLAP operations drill-down, roll-up, slice-and-dice and pivoting. On the server side, our tool operates both the DBMS and the FastBit in order to build the indices and to issue queries over them. On the client side, the user interacts with our tool through Java Server Pages, submits queries and analyzes multidimensional data that are ren-dered on cross tables and charts produced by the Open Ajax Toolkit Framework. The queries are submitted to the server, which accesses strictly the indices to provide the answer rapidly with high performance. Currently, our tool is compatible to the operat-ing systems Windows and Linux, to the DBMSs PostgreSQL, MySQL and IBM DB2®, and to the browsers Opera, Chrome, Firefox, IE8 and IE9. Sections 3.1 and 3.2 describe building and query processing operations of the BJIn OLAP Tool, re-spectively. We encourage the reader to access the BJIn OLAP Tool Portal at http://gbd.dc.ufscar.br/bjinolap.
3.1 Building the Bitmap Join Indices
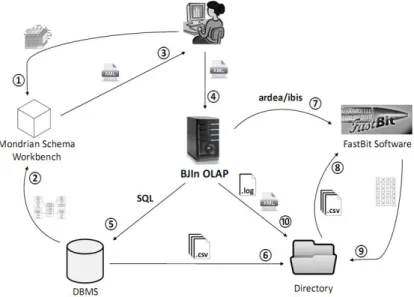
Fig. 5 illustrates the BJIn OLAP tool data flows to build the bitmap join indices. First-ly, the user installs and executes the Mondrian Schema Workbench to specify the attributes to be indexed, as well as dimension and fact tables, measures, and hierar-chies among attributes that exist in the DW schema (flow 1). The Workbench vali-dates these inputs by checking the DW schema, i.e., by accessing the DBMS, assuring that the DW was properly described by the user (flow 2). If the validation is success-ful, the Workbench generates a XML document that stores all the DW schema speci-fication and the attributes to be indexed (flow 3).
The reuse of Mondrian Schema Workbench promotes the interoperability between Mondrian OLAP Server and BJIn OLAP tool, since the produced XML document can
be used by both. While Mondrian reads the document to compose a data cube, our tool parses it in order to build the bitmap join indices on the specified attributes (flow 4). After specifying all parameters, the user should log in the server where BJIn OLAP tool is running and upload the corresponding XML document.
Once uploaded, the XML document is read by BJIn OLAP, which issues SQL and dump commands on the DBMS (flow 5) in order to compute joins and build a tempo-rary table. This table is dumped to a set of CSV files (comma-separated values) that are stored into the BJIn OLAP Directory (flow 6). Then, BJIn OLAP issues ardea and
ibis commands to the FastBit (flow 7). While the former reads CSV files to store data into the FastBit binary format (flow 8), the latter effectively builds the bitmap index and stores it into the Directory (flow 9). Finally, the BJIn OLAP writes a log file into the Directory with a complete description of the building operation, and writes a XML document that fully specifies the index, e.g. the names and types of the indexed columns and the available OLAP operations for that index (flow 10).
For instance, suppose that c_region, s_region, c_nation, d_year and lo_revenue
were specified by the user to be indexed. Clearly, they involve four different tables to be joined, i.e. Customer, Supplier, Date and Lineorder, as shown in Fig. 1. Therefore, the temporary table to be created by the SQL commands on flow 5 is exactly the one shown in Fig. 4a. Then, the bitmap join indices are created on the attributes of this temporary table on flows 6 to 9. Note that indexing such attributes would not enable
roll-up or drill-down operations.
Fig. 5. Building bitmap join indices using the BJIn OLAP Tool
3.2 Query Processing
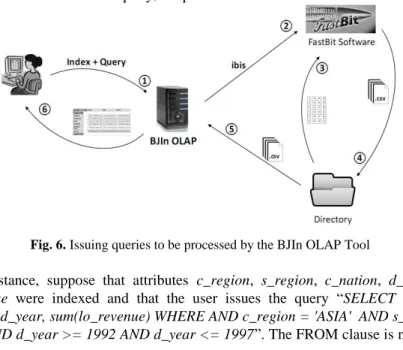
Whenever the user builds an index, a XML document is generated and then the index will be available to be queried, according to the data flows shown in Fig. 6. Firstly,
the user chooses the index to be used to process the queries among all available indi-ces, and types the desired query using a subset of the SQL (flow 1). This query lan-guage is defined by FastBit and does not require joins or groupings clauses. The col-umns listed in the SELECT clause are used to aggregate results. Therefore, writing the query is a straightforward task for the user, since only SELECT-WHERE clauses need to be written. Furthermore, the slice-and-dice operation should be described as restrictions in the WHERE clause.
Secondly, the BJIn OLAP tool writes the proper ibis command containing the que-ry and the chosen index, and submits it to FastBit (flow 2). Then, the Directoque-ry where the index is stored is accessed by FastBit in order to process the query (flow 3). After processing the query, FastBit writes a CSV file containing the query results in that Directory (flow 4). Then BJIn OLAP reads this file to build the cross table and render it on Java Server Pages (flow 5), which are displayed to the user (flow 6).
After a query execution, rather than typing another query the user is able to per-form OLAP operations as follows. Once the results were displayed, the pivoting oper-ation is allowed. All the user needs to do is to drag and drop columns or rows to switch the axis. This operation is computed on the client side, and therefore was not shown in Fig. 6. Drill-down and roll-up operations are also allowed for the user if there is at least one hierarchy of attribute involved in the previous query. For instance, if the previous query involved the s_nation attribute, a combo-box will enable the attribute s_region for the roll-up operation, and the attributes s_city and s_address for the drill-down operation. The user then selects the operation and the attributes of in-terest in the combo-box. Furthermore, roll-up and drill-down operations are executed on the server side, and correspond to issuing a new query (flows 1 to 6 shown in Fig. 6). However, since results of the previous query were cached by the server and con-tain partial results of the new query, the performance is benefited.
Fig. 6. Issuing queries to be processed by the BJIn OLAP Tool
For instance, suppose that attributes c_region, s_region, c_nation, d_year and
lo_revenue were indexed and that the user issues the query “SELECT c_nation, s_nation, d_year, sum(lo_revenue) WHERE AND c_region = 'ASIA' AND s_region =
neces-sary because the user had already selected the index to be queried (flow 1). The WHERE clause has filters that define the slice-and-dice OLAP operation. To submit a
roll-up operation on c_nation, instead of typing another query, the user should simply select the attribute s_nation in the combo-box. To perform a pivoting operation and switch the column d_year to a row, the user should simply drag and drop this item.
4
Experimental Evaluation
This section presents the validation of the BJIn OLAP Tool, which was done by run-ning performance tests. The results point out the remarkable performance of the BJIn OLAP Tool to process the following OLAP operations: drill-down, roll-up and slice-and-dice. We investigate the performance of our tool against the current technology of DBMS and against the Mondrian OLAP Server. Since the pivoting OLAP opera-tion is performed on the client side, it was not evaluated in our tests.
4.1 Experimental Setup
Regarding the datasets, we used the Star Schema Benchmark (SSB) [14] to create two star schemas identical to that in Fig. 1. The DW1 dataset was loaded according to the SSB scale factor 1 and produced 6 million tuples in the fact table, while the DW10 dataset used the SSB scale factor 10 and therefore was 10 times more voluminous than DW1. Both of them held attribute hierarchies such as (s_region) (s_nation) (s_city) (s_address) and (c_region) (c_nation) (c_city) (c_address), then enabling the experimental evaluation of drill-down and roll-up operations.
The workload was composed of SSB’s queries, which are organized in four groups of queries Q1, Q2, Q3 and Q4, which have increasing complexity [14]. Each group of query determines an intrinsic number of joins and filters, as well as groupings and sorting. Fig. 7 illustrates each query group template. Since these queries have filters in the WHERE clause, they enable slice-and-dice operations. Also, the group Q3 enable
drill-down and roll-up operations. Other datasets were created as vertically fragment-ed views and materialized views, similarly to those of Section 2.2. Their descriptions are properly provided in the next sections. In addition to low cardinality attributes, all queries involve at least one high cardinality attribute. For instance, lo_revenue attrib-ute has a cardinality of 3,345,588 in the DW1 dataset, and a cardinality of 5,841,774 in the DW10 dataset. These attributes were used in order to assess our OLAP Tool even when dealing with high cardinality attributes.
The hardware and software platforms used are described as follows. We utilized a computer with an Intel® Core™ 2 Duo processor with frequency of 2.80GHz, 320 GB SATA hard drive with 7200 RPM, and 3 GB of main memory. The operating system was CentOS 5.4 with Kernel Version 2.6.18-164.el5, and we also installed the following software: FastBit 1.2.2, PostgreSQL 8.4, JDK 1.6.0_21, Apache Tomcat 6.0.29, Open Ajax Toolkit 2.8, Mondrian Schema Workbench 3.2.0 and Mondrian OLAP Server 3.2.1.13885. All bitmap join indices were built with WAH compression
algorithm, equality encoding and no binning method. These features are enabled by FastBit to improve Bitmap indices over high cardinality attributes [18].
Q1
SELECT SUM(lo_extendedprice*lo_discount) AS revenue FROM Lineorder, Date
WHERE lo_orderdate = d_datekey AND d_year = [YEAR]
AND lo_discount BETWEEN [DISCOUNT] - 1 AND [DISCOUNT] + 1
AND lo_quantity < [QUANTITY];
Q2
SELECT SUM(lo_revenue), d_year, p_brand1 FROM Lineorder, Date, Part, Supplier WHERE lo_orderdate = d_datekey AND lo_partkey = p_partkey AND lo_suppkey = s_suppkey AND p_category = 'MFGR#12' AND s_region = 'AMERICA' GROUP BY d_year, p_brand1 ORDER BY d_year, p_brand1;
Q3
SELECT c_nation, s_nation, d_year, SUM(lo_revenue) AS revenue FROM Customer, Lineorder, Supplier, Date WHERE lo_custkey = c_custkey
AND lo_suppkey = s_suppkey AND lo_orderdate = d_datekey
AND c_region = 'ASIA' AND s_region = 'ASIA' AND d_year >= 1992 AND d_year <= 1997 GROUP BY c_nation, s_nation, d_year ORDER BY d_year asc, revenue DESC;
Q4
SELECT d_year, c_nation,
SUM(lo_revenue - lo_supplycost) AS profit FROM Date, Customer, Supplier, Part, Lineorder WHERE lo_custkey = c_custkey
AND lo_suppkey = s_suppkey AND lo_partkey = p_partkey AND lo_orderdate = d_datekey AND c_region = 'AMERICA' AND s_region = 'AMERICA' AND (p_mfgr = 'MFGR#1' OR p_mfgr = 'MFGR#2')
GROUP BY d_year, c_nation ORDER BY d_year, c_nation; Fig. 7. SSB’s queries templates [14].
4.2 Comparing the BJIn OLAP Tool to Vertically Fragmented Views
These experiments considered the following configurations to execute the queries: SJ
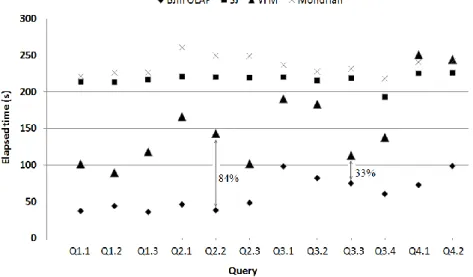
uses the DBMS to compute the star-join on the DW1 dataset; VFM uses the DBMS to avoid joins by accessing a specific vertically fragmented view that was built over the DW1 dataset; BJIn OLAP Tool avoids joins by accessing bitmap join indices that were built over the DW1 dataset; and Mondrian OLAP Server to access the DW1 dataset using MDX. Note that the VFM configuration demanded the creation of one vertically fragmented view for each SSB query, similarly to that view of Section 2.2. We performed all tests locally to avoid network latency. All the queries of the SSB were issued, and the system cache was flushed after the execution of each query. We gathered the elapsed time in seconds to process each query. The results were reported in Fig. 8.
Clearly, the BJIn OLAP Tool outperformed all the other configurations, corrobo-rating the use of the bitmap join index to process OLAP queries. On the other hand, the Mondrian configuration was the one that mostly impaired the query processing performance. In fact, OLAP servers access the star schema maintained by the DBMS in order to perform the queries, mapping MDX to SQL queries. Therefore, as the Mondrian configuration accessed DW1 just as the SJ configuration did, it was already expected that they would obtain similar results. Furthermore, there was an overhead that differed Mondrian and SJ configurations, since only the former needed to prepare
Java Server Pages and render cross tables to show them to the user. Both the SJ and the Mondrian configurations provided unacceptable query response times.
Moreover, the VFM configuration overcame the SJ configuration since the former avoids joins. The exceptions were queries Q4.1 and Q4.2, where the VFM configura-tion performed a sequential scan on the text attribute p_mfgr that introduced an over-head. However, the improvement provided by the VFM configuration was smaller than the improvement brought by our tool to process queries. Actually, the time re-duction imposed by the BJIn OLAP Tool over vertically fragmented views ranged from 33% in Q3.3 up to 84% in Q2.2. Finally, as every query of the workload had restrictions in the WHERE clause, the results corroborated the use of the bitmap join index in OLAP tools to improve the performance of the slice-and-dice query.
Fig. 8. Elapsed time obtained by each configuration to process SSB’s queries Regarding storage, the DW1 dataset occupied 838 MB, while the created vertical fragmented views occupied a sum of 5,193 MB, and the bitmap join indices occupied a sum of 5,652 MB. The construction of the bitmap join indices spent 1,896 seconds to be built, while the vertically fragmented views accessed by the DBMS spent 6,225 seconds to be built. Compared to vertically fragmented views, bitmap join indices re-quired 8.8% more disk space. However, these have reasonably improved the query processing performance and spent less time to be built.
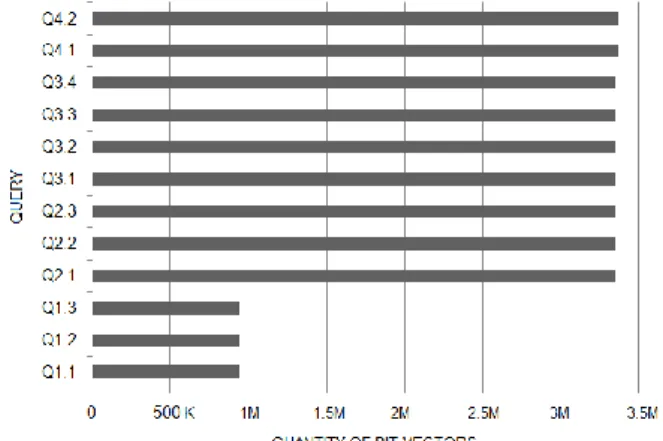
The attribute’s cardinality is a very important issue whenever dealing with bitmap indices, since it determines the quantity of bit-vectors built for the corresponding attribute. Fig. 9 illustrates, for the indices built for each query, the quantity of bit-vectors available, i.e. the sum of the cardinality of all indexed attributes. Only the indices of group Q1 have less than 3 million bit-vectors. According to our assess-ments, every query accessed more than 99% of the available bit-vectors. Therefore, the results revealed that the BJIn OLAP Tool efficiently performed queries even for very high cardinalities and accessing a huge number of bit-vectors.
Fig. 9. Quantity of bit-vectors available for the index of each query
4.3 Drill-down and Roll-up Operations
The drill-down and roll-up operations were evaluated following the SSB’s queries
Q3.1, Q3.2, Q3.3 and Q3.4. Executing them progressively determines a drill-down op-eration, while the inverse execution consists of a roll-up operation. In this test we used the Mondrian and the BJIn OLAP Tool configurations that were defined in Section 4.2. We executed the queries subsequently without flushing the system cache between each query. This strategy allows the cache to be used and therefore to rapidly fetch partial results of the query. We performed both the drill-down and roll-up operations and ga-thered the elapsed time of each specific query. Also, we calculated the total elapsed time of each OLAP operation and the time reduction provided by the BJIn OLAP Tool over the Mondrian configuration. These queries are shown in Fig. 10, and the attributes used for drill-down and roll-up operations are highlighted in bold.
Q3.1
SELECT c_nation, s_nation, d_year, sum(lo_revenue) AS revenue FROM customer, lineorder, supplier, date
WHERE lo_custkey = c_custkey AND lo_suppkey = s_suppkey AND lo_orderdate = d_datekey
AND c_region = 'ASIA' AND s_region = 'ASIA' AND d_year >= 1992 AND d_year <= 1997 GROUP BY c_nation, s_nation, d_year ORDER BY d_year ASC, revenue DESC;
Q3.2
SELECT c_city, s_city, d_year, sum(lo_revenue) AS revenue FROM customer, lineorder, supplier, date
WHERE lo_custkey = c_custkey AND lo_suppkey = s_suppkey AND lo_orderdate = d_datekey
AND c_nation = 'JAPAN' AND s_nation = 'JAPAN' AND d_year >= 1992 AND d_year <= 1997 GROUP BY c_city, s_city, d_year
ORDER BY d_year ASC, revenue DESC;
Q3.3
SELECT c_city, s_city, d_year, sum(lo_revenue) AS revenue FROM customer, lineorder, supplier, date
WHERE lo_custkey = c_custkey AND lo_suppkey = s_suppkey AND lo_orderdate = d_datekey
AND (c_city = 'JAPAN 1' OR c_city = 'JAPAN 5') AND (s_city = 'JAPAN 1' OR s_city = 'JAPAN 5') AND d_year >= 1992 and d_year <= 1997 GROUP BY c_city, s_city, d_year
ORDER BY d_year ASC, revenue DESC;
Q3.4
SELECT c_city, s_city, d_year, sum(lo_revenue) AS revenue FROM customer, lineorder, supplier, date
WHERE lo_custkey = c_custkey AND lo_suppkey = s_suppkey AND lo_orderdate = d_datekey
AND (c_city = 'JAPAN 1' OR c_city = 'JAPAN 5') AND (s_city = 'JAPAN 1' OR s_city = 'JAPAN 5') AND d_yearmonth = 'Dec1997'
GROUP BY c_city, s_city, d_year ORDER BY d_year asc, revenue DESC; Fig. 10. Adapted queries to evaluate drill-down and roll-up operations
The results were reported in Table 1, and revealed that the first query, i.e. the query Q3.1, was the costly query of the drill-down operation. This fact confirmed the im-portance of the cache whenever performing this OLAP operation, in order to rapidly fetch partial query results, and then provide a shorter elapsed time to process the sub-sequent queries. An important result derived from our experiments is that the BJIn OLAP Tool greatly outperformed the Mondrian configuration to execute the first query of both drill-down and roll-up operations, i.e. Q3.1 and Q3.4, respectively.
The experiments had also shown that the BJIn OLAP Tool drastically decreased the query response to process drill-down and roll-up operations. Actually, our tool provided a time reduction of at least 45% over the Mondrian configuration. This fact corroborated the use of the bitmap join index in OLAP tools in order to improve the query processing performance of drill-down and roll-up operations.
Table 1. Drill-down and roll-up operations performed by Mondrian and BJIn OLAP Drill-down (s): Q3.1 to Q3.4 Roll-up (s): Q3.4 down to Q3.1
Query Mondrian BJIn OLAP Mondrian BJIn OLAP
Q3.1 226.553 73.835 4.356 50.067 Q3.2 3.738 52.651 3.390 5.482 Q3.3 0.239 0.648 2.875 29.708 Q3.4 2.866 0.411 231.313 45.403 Total 233.396 127.545 241.934 130.660 Time Reduction (%) 45.35% 45.99%
4.4 Increasing Data Volume and Accessing Materialized Views
In order to assess our BJIn OLAP Tool for its efficiency and scalability, we performed experiments with a greater data volume (DW10) than those used in sections 4.2 and 4.3 (DW1). In addition, in this section we state four new configurations as follows:
DBMS+MV uses the DBMS to avoid joins by accessing specific materialized views that were built over the DW10 dataset; Mondrian+MV is the Mondrian OLAP Server accessing a specific materialized view using MDX and Aggregate Tables; FastBituses FastBit to avoid joins by accessing bitmap join indices that were built over the created materialized views; and BJIn OLAP Tool avoids joins by accessing bitmap join indices that were built over the created materialized views.
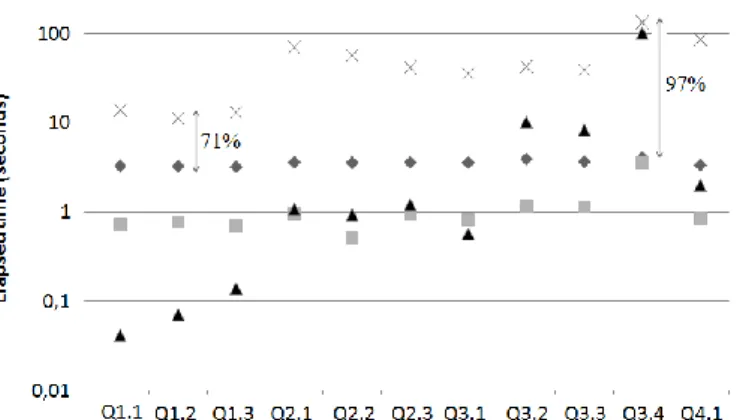
The new configurations demanded the creation of one materialized view for each SSB query, similarly to that one of Section 2.2. Although the DW10 had a greater vo-lume, materialized views drastically reduced the quantity of tuples. We performed all tests locally to avoid network latency. This test also compared the performance of the tool and its query engine. While the query engine of Mondrian is the DBMS, the query engine of the BJIn OLAP Tool is the FastBit. All queries of the SSB were issued, and the system cache was flushed after the execution of each query. We gathered the elapsed time in seconds to process each query. The results were reported in Fig. 11.
The results revealed that the BJIn OLAP Tool outperformed the Mondrian configu-ration in every query. Concerning the engines, FastBit outperformed the DBMS in most queries, except for group Q1, which has a very low volume (less than 100 tuples).
An-other interesting result showed that the BJIn OLAP Tool was capable of displaying the query results much more rapidly than the Mondrian configuration. Although the DBMS provides the query answer quickly, there is an overhead on the data cube caching, on MDX translation and on rendering the results that severely impaired the Mondrian con-figuration performance. This overhead was not observed on the BJIn OLAP Tool. Actu-ally, the time reduction imposed by the BJIn OLAP Tool over the Mondrian configura-tion ranged from 71% in Q1.2 up to 97% in Q3.4.
Fig. 11. Elapsed time to process SSB’s queries, in logarithmic scale (base 10) Regarding storage, the DW10 dataset occupied 10,540 MB, all bitmap join indices required 51 MB and all materialized views required 45.6 MB. The construction of the materialized views by the DBMS spent 174,416 seconds, while the indices spent 163 seconds to be built over these views. Although the indices added approximately 12% of storage requirements to materialized views, they have greatly improved the query pro-cessing performance over the DW10 dataset. Also, the time to build the indices over the materialized views added only 0.00094% to the elapsed time to build these views.
4.5 Memory usage
In the following tests, we upgraded the hardware to a computer with an Intel® Core™ i5 processor with frequency of 2.66GHz, 640 GB SATA hard drive with 7200 RPM, 4 GB of main memory, Ubuntu 10.10 with Kernel 2.6.35-27, FastBit 1.2.4, PostgreSQL 9.0, JDK 1.6.0_24, Apache Tomcat 7.0.14, Open Ajax Toolkit 2.8, Mondrian Schema Workbench 3.2.0 and Mondrian OLAP Server 3.2.1.13885. This test measured and compared the amount of main memory utilized by each OLAP tool and its query en-gine to execute the most costly queries previously assessed. Mondrian and BJIn OLAP Tool consumed the Java Virtual Machine heap (measured using the NetBeans Profiler), while PostgreSQL and FastBit utilized the main memory managed by the operating system (measured using the ps_mem.py library).
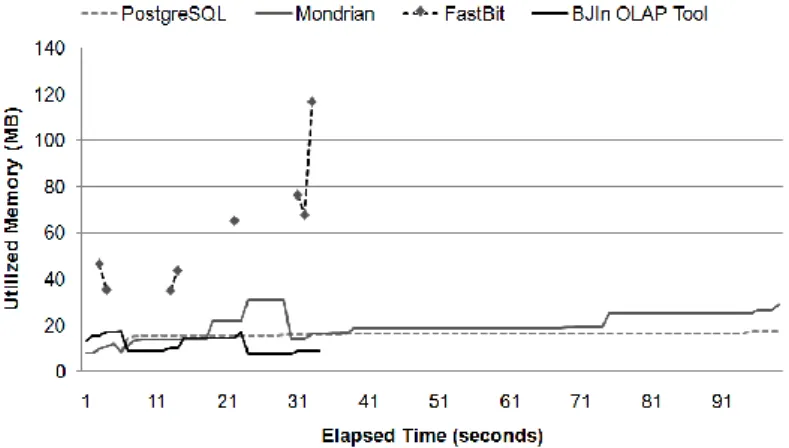
Firstly, we considered the Q3 roll-up operation issued over the DW1 dataset, where Mondrian used the PostgreSQL to perform the star-join and the BJIn OLAP
Tool managed FastBit to access bitmap join indices. Fig. 12 shows the results. The BJIn OLAP Tool consumed less heap space than Mondrian most of the time. FastBit consumed more memory than PostgreSQL during the four queries that compose the
roll-up operation (see the 4 black dashed lines with points). However, FastBit greatly spent a much shorter time than PostgreSQL to retrieve the query answer. This result revealed that our OLAP tool had a convenient memory usage on the roll-up operation.
Fig. 12. Memory usage for the roll-up operation over DW1 dataset
Secondly, we considered SSB’s query Q3.4 issued on the materialized view built over the DW10 dataset, as shown in Fig. 13. Although BJIn OLAP Tool has con-sumed more heap than Mondrian during the initial 6 seconds of execution, it has pro-vided a very shorter elapsed time than the latter. Also, Mondrian drastically increased its memory consumption after 6 seconds of execution. The FastBit had only a peak of memory consumption (approximately 38 MB) that lasted around 1 second. Again, our OLAP tool had a feasible memory usage.
5
Related Work
In Table 2 existing software are compared to the BJIn OLAP Tool. Oracle BI enables the bitmap join index, however its use is recommended only when indexing very low cardinality attributes [7]. Conversely, we have used our tool also to index attributes with higher cardinalities (e.g. lo_revenue whose cardinality is 3,345,588). Also, Oracle BI platform is not open source software and therefore was not employed in our perfor-mance evaluation. Regarding the Mondrian OLAP Server [4], although it supports ma-terialized views, it currently does not support the bitmap join index. Furthermore, the user must type MDX to issue queries. On the other hand, the BJIn OLAP Tool uses this index and supports a query language that is syntactically based on SQL. As a result, the BJIn OLAP Tool does not require knowledge about additional query languages, such as MDX that is commonly adopted by existing OLAP Tools [4][7][8][19].Moreover, the BJIn OLAP Tool interestingly extends the FastBit to be applied over DW and support
drill-down, roll-up, slice-and-dice and pivoting OLAP operations. Although the Fast-Bit supports the bitmap join index, building this index and reusing it to process queries require many long and complex instructions to be typed by the user, both in the operat-ing system and DBMS command lines. The BJIn OLAP Tool avoids these tasks (Sec-tion 3.1). Also, our tool extends the FastBit to work on the server side, while in the cli-ent side the results of queries are displayed to the user in cross tables and charts.
Table 2. Comparison among existing software and the BJIn OLAP Tool
Feature Oracle BI Mondrian FastBit BJIn OLAP
Supports the bitmap join index
Supports OLAP operations
Avoids typing complex OS commands
Avoids typing complex DBMS commands
Provides information visualization methods
Is open source software
The experimental evaluation presented in Section 4 aimed at validating the BJIn OLAP Tool. We investigated the feasibility of developing an OLAP tool exclusively based on the bitmap join index to process OLAP operations such as drill-down, roll-up,
slice-and-dice and pivoting, comparing it to existing software. Differently from [6], our goal was not to exhaustively assess the bitmap join index against other join indices.
6
Conclusions and Future Work
In this paper, we introduced the BJIn OLAP tool to efficiently perform drill-down,
roll-up, slice-and-dice and pivoting OLAP operations over DW, by employing the bitmap join index. The BJIn OLAP tool is Free Software and was validated through a performance evaluation to assess its efficiency and to corroborate the feasibility of adopting the bitmap join index to execute OLAP queries. The performance results reported that our BJIn OLAP tool provided a performance gain that ranged from 31% up to 97% if compared to existing solutions. Currently, the BJIn OLAP Tool is being applied to the Web-PIDE Project over DW containing real educational data from
Brazilian Government [3][17], to aid decision takers on planning Educational Poli-cies. As future work, we intend to investigate drill-across OLAP operations, apply update policies to the indices and adapt the tool for Spatial OLAP operations [16]. Also, the BJIn OLAP Tool will be formally registered as Free Software and its Portal will contain proper documentation.
Acknowledgements. The 1st author thanks the support of IFSP Undergraduate Research
Grant. The 2nd author thanks Projeto Web-PIDE (Observatório da Educação: CAPES/INEP).
References
1. Baikousi, E., Vassiliadis, P.: View usability and safety for the answering of top-k queries via materialized views. In: DOLAP, pp. 97-104. ACM, New York (2009)
2. Bellatreche, L., Woameno, K.Y.: Dimension table driven approach to referential partition rela-tional data warehouses. In: DOLAP, pp. 9-16. ACM, New York (2009)
3. Carniel, A.C., Siqueira, T.L.L.: The Bitmap Join Index OLAP Tool. To appear in: SBBD De-mos (2011)
4. Casters, M., Bouman, R., Dongen, J.: Pentaho® Kettle Solutions. Sybex (2010)
5. Chaudhuri, S., Dayal, U.: An overview of data warehousing and OLAP technology. SIGMOD Record 26, 65-74 (1997)
6. Datta, A., VanderMeer, D., Ramamritham, K.: Parallel Star Join+DataIndexes: efficient query processing in data warehouses and OLAP. IEEE TKDE 14(6), 1299-1316 (2002)
7. Fogel, S., Johnston, C., Moore, S., Morales, T., Potineri, P., Urbano, R., Ashdown, L., Green-berg, J.: Oracle 11g database administratorʼs guide (2010)
8. Golfarelli, M.: Open source BI platforms: a functional and architectural comparison. In: DaWaK, pp. 287-297. Springer (2009)
9. Golfarelli, M., Maio, D., Rizzi, S.: Applying vertical fragmentation techniques in logical design of multidimensional databases. In: DaWaK, pp. 11-23. Springer (2000)
10. Harinarayan, V., Rajaraman, A., Ullman, J.D.: Implementing data cubes efficiently. SIGMOD Record 25, 205-216 (1996)
11. Inmon, W.H.: Building the Data Warehouse. Wiley (2002).
12. Kimball, R., Ross, M.: The data warehouse toolkit: the complete guide to dimensional model-ing. John Wiley & Sons, Inc., Chichester (2002)
13. OʼNeil, P., Graefe, G.: Multi-table joins through bitmapped join indices. SIGMOD Record 24, 8-11 (1995)
14. O’Neil, P., O’Neil, E., Chen, X., Revilak, S.: The star schema benchmark and augmented fact table indexing. In: TPCTC, pp. 237–252 (2009)
15. Rübel, O., Shoshani, A., Sim, A., Stockinger, K., Weber, G., Zhang, W.M., Prabhat: FastBit: in-teractively searching massive data. J. of Physics: Conference Series 180, 12053 (2009)
16. Siqueira, T.L.L., Ciferri, C.D.A., Times, V.C., Ciferri, R.R.: The SB-index and the HSB-Index: efficient indices for spatial data warehouses. DOI: 10.1007/s10707-011-0128-5 (2011)
17. Siqueira, T.L.L., Ciferri, R.R., Santos, M.T.P.: Projeto, construção e manutenção de data warehouses para auxiliar o planejamento de políticas públicas de educação. In: XVI Jornadas de Jóvenes Investigadores AUGM, pp. 1016-1025 (2008).
18. Stockinger, K., Wu, K.: Bitmap indices for data warehouses. In: Wrembel, R., Koncilia, C. (eds.) Data Warehouses and OLAP, pp. 157-178. IRM Press (2006)
19. Whitehorn, M., Zare, R., Pasumansky, M.: Fast Track to MDX. Springer (2005)
20. Xu, L., Zeng, L., Shi, Z., He, Q., Wang, M.: Research on business intelligence in enterprise computing environment. IEEE SMC, 3270-3275 (2007)
![Fig. 1 shows a star schema representing a retail application, which is derived from the Star Schema Benchmark (SSB) [14]](https://thumb-us.123doks.com/thumbv2/123dok_us/1553338.2708177/2.892.309.581.721.995/shows-schema-representing-retail-application-derived-schema-benchmark.webp)