Identification of isomers in the gas phase and as adsorbate by near-edge X-ray absorption fine structure spectroscopy:
cis- and trans-stilbene
Ralph Püttner1, Philipp Schmidt-‐Weber2*, Thorsten Kampen3, Christine Kolczewski4, Klaus Hermann2, and Karsten Horn2
1 Department of Physics, Freie Universität Berlin, 14195 Berlin, Germany 2 Fritz Haber Institute of the Max Planck Society, 14195 Berlin, Germany 3 SPECS Surface Nano Analysis GmbH, 13355 Berlin, Germany
4 Deutsches Museum München, 80538 Munich, Germany *now at TDK Stahnsdorf, Germany
Abstract
Near-‐edge x-‐ray absorption fine structure spectra of the cis-‐ and trans-‐isomers of stilbene in the gas phase reveal clear differences, which are analyzed by results from density-‐functional theory calculations using the transition potential approach. The differences between the two species also occur in stilbene adsorbed on Si(100), opening the way towards studying structural changes in molecules in different
surface environments, and configurational switching in organic molecules on surfaces in particular.
I. Introduction
The effect of steric configuration of a molecule on its electronic structure is an interesting field of research, especially when dealing with small organic molecules that serve as model compounds for building blocks in larger, e.g. biological, systems. Studies of molecules in the gas phase by photoelectron (XPS) and X-‐ray emission and absorption spectroscopy (XES, XAS) have been particularly useful in this respect since they permit to investigate the energies of occupied and unoccupied molecular orbitals (MO) [1,2] . Here near-‐edge x-‐ray absorption spectroscopy (NEXAFS) is especially useful since it provides a sensitive atom-‐specific probe of the unoccupied electronic structure in the gas, adsorbed, and solid phases.
Distinguishing between the electronic structure of molecular isomers, which have the same sum formulae and thus the same mass but differ in their spatial atom arrangement in the molecular frame is a particularly challenging task because the small changes in steric configuration may result in only subtle changes in MO energies. Such studies in gas phase molecules may then serve as the basis to
investigate conformational changes in adsorbed molecules, as an important step in identifying and ultimately devising catalytic processes aimed at separating
stereoisomers of a specific molecule. This is also a key aspect in the emerging field of molecular electronics where conformational changes may be used to create switching devices at the molecular level [3] or in 2-‐dimensional systems [4]. Identification of isomers may be achieved by UV [5] and vibrational spectroscopies [6] in the gas phase. Here we apply NEXAFS, a sensitive method to probe unoccupied valence states, in order to study the cis-‐ and trans-‐isomers of stilbene, both in the gas phase and adsorbed on Si(100). By comparison with density functional theory (DFT) calculations using the transition potential (TP) approach in combination with a double basis set technique we are able to identify and assign specific transitions which are different in the two isomers. The comparison with the adsorbed state spectra suggests that their conformations survive in the new bonding situation on a Si(100) surface.
Stilbene (1,2 diphenylethylene, see sketches in Figure 1) is the shortest oligomer reproducing the basic structure of the conducting polymer poly-‐(p-‐phenylene
sides of the connecting C=C double bond bridge. It is, in contrast to azobenzene and its derivatives, stable at room temperature with respect to cis-‐ to trans-‐reactions and thus represents a simple and interesting molecular ”switch”. Adsorption of small organic molecules on silicon surfaces has been extensively studied using
photoelectron spectroscopy and other methods [7]. For silicon surfaces it has been shown that many organic molecules, especially with extended π electron systems, bind strongly with the substrate, causing clear changes in corresponding
photoemission spectra [8-‐13]. In contrast, the Si 2p photoelectron spectrum remains almost unchanged upon stilbene adsorption [14].
In the present study we report on experimental NEXAFS spectra of cis-‐ and trans-‐ stilbene in the gas phase as well as adsorbed at the Si(100) surface. In the gas phase, distinct differences are found between the two isomers for the energy regions of the lowest C 1s → π* transitions; they are explained by comparison with theoretical
spectra and can be traced back to the influence of the molecular geometry on the local π-‐system of the phenyl groups. The weak interaction between the stilbene molecules and the Si(100) surface allows us to readily identify each isomer also in the adsorbed state, since the differences are retained.
II. Experimental and theoretical background
All experiments were performed at the UE 56/2 PGM1 beamline of the synchrotron radiation facility BESSY II [15]. The gas phase NEXAFS spectra were obtained by detecting the total photoionization yield with a gas cell that contains two parallel plates for charged particle collection, separated from the beamline vacuum by a 1000 Å thick aluminum window; for details see Ref. [16]. Spectra were measured with a spectral resolution of better than 50 meV. Data for adsorbed stilbene were recorded using a stainless steel ultrahigh vacuum chamber described elsewhere [17]. Cis-‐ and trans-‐stilbene (Sigma-‐Aldrich ♯ 139939 and S 48808) were used without further purification, and were evaporated through a leak valve from an evacuated glass tube. For evaporation of the solid trans-‐isomer the glass tube was heated to about 80 C; evaporation of the liquid cis-‐isomer required no additional heating. The pressure of the stilbene isomers in the absorption cell was 35 µbar. No data
processing was applied to the spectra, except for a subtraction of a smooth
background for the adsorbate spectra. For the adsorption experiments, a sample of 2 x 5 mm cut from a p-‐doped Si(100) wafer (Virginia Semiconductor) was cleaned using standard procedures, in an ultra-‐high vacuum chamber with a base pressure of 2 x 10-‐ 10 mbar. The sample was cooled in the experiments to a temperature of about 100 K using liquid nitrogen. Both isomers were prepared using the same conditions as for the gas-‐phase measurements. NEXAFS spectra were recorded in the partial yield mode using a PHOIBOS 100 photoelectron spectrometer (SPECS Surface Nano Analysis GmbH, Berlin). Further details of the adsorption experiments including NEXAFS, core level, and valence level spectra are reported in [14].
The experimental spectra were analyzed by comparing with theoretical results from density-‐functional theory (DFT) calculations applying the transition potential (TP) approach in combination with a double basis set technique [18] as implemented in the StoBe [19] code. The calculations yield excitation energies and dipole transition moments which can be used, after correcting for relaxed ionization potentials and relativistic effects, to determine theoretical spectra for the interpretation. For further computational details see Refs. [16,20,21].
III. Results and Discussion
A. NEXAFS spectra of gas-phase stilbene
Fig. 1 compares measured carbon K edge NEXAFS spectra of the trans-‐ and cis-‐ stilbene isomers, in the gas phase (indicated by data points) with calculated C 1s core excitation spectra obtained from the present DFT calculations using the TP approach for excitation energies between 284 and 289 eV. The theoretical spectra reflect superpositions of contributions due to C 1s excitations from all carbon centers of the molecules. They are corrected for fully relaxed ionization potentials (determined self-‐ consistently for the corresponding C 1s core holes) and relativistic effects [21]. No additional heuristic shift was introduced.
The experimental spectra for the two isomers in the center of Fig. 1 reveal distinct differences which allow a clear discrimination between the two species. First,
there is a dominant structure near 285.0 eV with a clear peak doublet separated by 0.4 eV for trans-‐stilbene; cis-‐stilbene, on the other hand, shows an asymmetric single peak at 285.0 eV which from its asymmetry towards higher energies is likely to contain several peak components, however with a much smaller separation. Second, the two spectra show a three-‐peak structure between 286.0 eV and 289.0 eV which is more pronounced for trans-‐ than for cis-‐stilbene. These spectral differences can provide a clear fingerprint to distinguish between the two isomers and may also serve as a basis to identify the isomers in the adsorbed state. The theoretical spectra in Fig. 1 together with a detailed analysis of the calculated final state orbitals yield an explanation of the spectral features found in the experiment and allow an interpretation of the difference between the two isomers based on electronic structure theory.
Structure optimizations for trans-‐stilbene in its electronic ground state obtained by applying the present DFT methods reproduce the well known planar equilibrium geometry of symmetry group C2h , see ball-‐and-‐stick model in Fig. 1. This confirms results of earlier theoretical studies using Hartree-‐Fock and correlated CASSCF wavefunctions [22] where the interatomic distances and bond angles agree quite nicely with our data. The C2h symmetry allows, in particular, a classification of all molecular orbitals of trans-‐stilbene according to their symmetry behavior with respect to the molecular plane as σ type (symmetric) or π type (antisymmetric). Here
the ground state calculations show that the energetically lowest unoccupied orbitals are π type with 2pz contributions at the different carbon centers (assuming the
molecular plane to coincide with the x-‐y plane). As a consequence, the lowest C 1s core excitations must be due to transitions into low-‐lying π* final state orbitals which
can explain the overall dominant peak feature between 284.5 eV and 286.0 eV in the theoretical spectrum of trans-‐stilbene given in Fig. 1 (bottom). Further, C 1s core excitations involving higher lying π* and σ* final state orbitals with sizable 2p
contribution at corresponding carbon centers are possible candidates to interpret the three absorption peaks between 286.5 eV and 289.0 eV in the theoretical spectrum. However, further details of the spectral features require a full analysis of the final state orbitals. These orbitals need to be evaluated for 1s core holes at each carbon center separately. Not unexpectedly, they differ somewhat in shape and energy from
unoccupied orbitals obtained by ground state calculations (the latter shown in Fig. 2 of Ref. [23]), which ignore the presence of the core hole.
Fig. 2a shows, in its lower part, excitation energies evaluated for core excited final state orbitals involving all seven non-‐equivalent carbon centers of trans-‐stilbene where the core excitations can originate. The energies are given as color bars of heights representing excitation probabilities calculated from corresponding dipole matrix elements. The color of the bars discriminates between the different carbon centers and reflects the color scheme used for the non-‐equivalent carbon atoms in the ball-‐and-‐stick model of trans-‐stilbene at the top of Fig. 2a. The total C 1s excitation spectrum of trans-‐stilbene given above the color bars (and shown already in Fig. 1) represents a superposition of all excitation levels. The levels are weighted by their probabilities and are convoluted with a Gaussian function of 0.5 eV full width at half maximum (FWHM) in order to account for vibrational progressions present in the spectra of organic molecules [16,20,21,24,25] and to a much lesser extent for lifetime broadening and experimental resolution. This value was shown to be appropriate in studies of the related benzene and pyridine molecules [16,20]. The excitation of each of the C 1s core holes in trans-‐stilbene reduces its C2h orbital symmetry of the ground state to Cs where the global mirror plane (defined as x-‐y plane in the following) is conserved. Thus, the different C 1s core excited final state orbitals can still be
classified as σ* and π*type. The lowest unoccupied orbital (LUMO) of the trans-‐isomer
in its ground state, 4bg* (see Fig. 2 of Ref. [23]) is π* type and described as an anti-‐
bonding C 2pz mixture at the two carbon atoms forming the central C=C dimer with minor contributions of the peripheral phenyl rings. This orbital may be considered a final state orbital in C 1s core excitations where it is differently perturbed by the presence of a C 1s core hole on the specific carbon site, which affects the orbital shape but also its Kohn-‐Sham orbital energy. As a consequence, the lowest core excitations, determining the low-‐energy part of the double-‐peak near 285 eV in the theoretical spectrum (region I, sketched in Fig. 2a), are characterized qualitatively by π* final
state orbitals at the central C=C dimer relating to the seven non-‐equivalent C 1s core holes. The corresponding excitation energies range between 284.65 eV and 285.20 eV, see lower part of Fig. 2a. As an example, the final state orbital A refers to an excitation
at the central carbon atom no. 1 (dark blue) carbon atom of the isomer, see sketch at the top of Fig. 2, leading to the lowest excitation energy of 284.65 eV.
The final state orbital analysis of the high-‐energy part of the main double-‐peak (region II), between 285.35 eV and 285.70 eV, also yields π* orbitals which, with
increasing energy, contain larger amounts of anti-‐bonding C 2pz contributions at the peripheral phenyl rings. Final state orbitals B (1s excitation at the no. 2 (red) carbon and C (1s excitation at the no. 4 (yellow) carbon atom), are included as examples. They result in excitation energies of 285.35 eV and 285.70 eV, respectively.
At higher energies, the calculated total spectrum can be characterized by three broad peaks, region III, which are due to numerous core excitations with smaller excitation probability. Here the lowest peak originates mainly from a core excitation at the no.2 (red) carbon atom of the phenyl ring closest to the central C=C dimer at 286.90 eV where the corresponding final state orbital D is π* type extending over the
entire trans-‐stilbene isomer. The intermediate peak can be assigned to several core excitations at the central (no. 1, dark blue) carbon atom of the isomer between 287.45 eV and 287.70 eV. As an example of the similar final state orbitals, orbital E is π*-‐type
with a large diffuse contribution at the excitation center but also sizeable admixtures from carbon atoms of the peripheral phenyl rings. The highest peak of the three-‐peak structure is due to a superposition of many core excitations involving all carbon centers of the isomer without a clear emphasis. Here final state orbitals of π as well as σ symmetry with valence rather than Rydberg character are found, analogous to
observations for a number of similar hydrocarbon molecules [16,20]. As an example, orbital F of Fig. 2a, occupied by an excitation at the outer carbon atom (no. 5, yellow, at 288.30 eV), describes a σ* final state orbital.
For cis-‐stilbene, the structure optimizations in its electronic ground state
reproduce the non-‐planar equilibrium geometry, described by the symmetry group C2. The twofold rotational axis is perpendicular to the central C=C double bond and the two phenyl rings are bent and twisted with respect to each other in order to minimize their steric repulsion, see ball-‐and-‐stick model. This is consistent with results of theoretical studies using correlated wavefunctions [23] where interatomic distances and bond angles agree well with our data. The C2 symmetry does not offer a global
mirror plane which makes a strict distinction between σ and π orbitals unavailable.
However, the two phenyl groups in cis-‐stilbene are still planar and allow to classify orbital contributions according to their content of local carbon 2pz character with pz functions perpendicular to the phenyl planes, “π type”, and 2px,y along the planes, “σ
type”. This notation will be adopted in the following.
Fig. 2b shows the computed total C 1s excitation spectrum of cis-‐stilbene together with excitation energies evaluated for core excited final state orbitals involving all seven non-‐equivalent carbon centers, completely analogous to the data for trans-‐stilbene in Fig. 2a. The excitation of each of the C 1s core holes in cis-‐stilbene reduces its C2 orbital symmetry of the ground state to C1 (no symmetry) such that a symmetry classification of the different C 1s core excited final state orbitals is not possible. However, they can still be described qualitatively by their 2p character at the carbon centers where “2pz” in the discussion will refer to 2p functions pointing
perpendicular to the C=C bond of the central C=C dimer or perpendicular to the planes through the phenyl rings.
The lowest unoccupied orbital of cis-‐stilbene in its ground state, 4a* (see Fig. 2 of Ref. [23]) is described as an anti-‐bonding C 2pz mixture of the two carbon atoms forming the central C=C dimer with minor contributions of the peripheral phenyl rings which is completely analogous to the LUMO of trans-‐stilbene. This orbital, occupied as a final state orbital in a C 1s core excitation, is modified by the C 1s core hole at the different carbon sites which affects its shape and the corresponding Kohn-‐ Sham orbital energy. Therefore, the lowest core excitations, determining the broad low-‐energy peak near 285 eV in the theoretical spectrum, can be described by final state orbitals at the central C=C dimer perturbed by each of the seven non-‐equivalent C 1s core holes. The corresponding excitation energies lie between 284.85 eV and 285.25 eV (region I), see lower part of Fig. 2b and orbital A at 284.85 eV. This energy range (0.40 eV) is smaller than the corresponding value (0.55 eV) of region I for trans-‐ stilbene. Further, region I for cis-‐stilbene starts 0.2 eV above that for trans-‐stilbene.
At energies between 285.30 eV and 285.65 eV (region II) the final state orbitals are dominated by anti-‐bonding C 2pz contributions at the peripheral phenyl rings (see orbital B), again analogous the result for trans-‐stilbene where both energy ranges
agree. However, the separation between region I and region II is smaller by 0.1 eV for cis-‐ compared with trans-‐stilbene. This can be explained by the geometry differences between the two isomers. The trans-‐stilbene as a planar molecule forms a global π
electron system which couples the 2pz electrons of the central C=C dimer with those of the two phenyl rings to yield the final state orbitals of region I. This coupling is weakened by the torsion between the phenyl rings in cis-‐stilbene that perturbs the global π electron system, shifting the final state orbitals of region I to slightly higher
energies, as discussed in ref 23. In contrast, the local π electron systems of the two
phenyl rings, determining the final state orbitals of region II, are less affected by the torsion, such that region II is not shifted. In addition, the calculated excitation
energies within the two regions are found to be distributed more evenly for cis-‐ than for trans-‐stilbene. Altogether, this can explain the difference between the broad single peak for cis-‐stilbene and the double-‐peak structure for the trans-‐isomer near 285 eV found in the theoretical spectra.
The reduced separation between region I and II for cis-‐ compared with trans-‐ stilbene is reminiscent of the level splitting between the lowest unoccupied orbitals obtained for the ground states of the two isomers. As discussed in Ref. [23], the LUMOs, 4a* in cis-‐ and 4bg* in trans-‐stilbene, are both characterized by dominant anti-‐ bonding C 2pz mixtures at the two carbon atoms forming the central C=C dimer. On the other hand, the three higher orbitals, 5a* to 6b* in cis-‐ and 5bg* to 6au* in trans-‐ stilbene, are described by anti-‐bonding C 2pz contributions at the peripheral phenyl rings. The corresponding level splitting, 4a* to 6b*, in cis-‐stilbene is smaller by 0.65 eV compared to that, 4bg* to 6au*, in the trans-‐isomer in qualitative agreement with the present results from the final state orbital analysis.
In tetra-‐tert-‐butyl-‐azobenene (TBA), Schmidt et al. [26] observed a related effect, in that the N 1s → 1π* transition for trans-‐TBA is lower in energy by 0.45 ±
0.05 eV compared to cis-‐TBA. TBA has a conjugated π system which is very similar to that of stilbene, with a bridge between the two benzene rings formed by a N=N double bond instead of a CH=CH double bond, however. Hence we conclude that the observed energy shift in the NEXAFS spectra has the same origin as in stilbene. We also expect that the energy shift for the lowest 1π* orbital is a universal feature for all molecules with a similar conjugated π-‐system, i.e. stilbene, azobenzene, and imine derivatives.
At excitation energies above 286 eV, the total spectrum for cis-‐stilbene is characterized by three broad peaks, region III, of about equal intensity where many core excitations with smaller excitation probability contribute, in analogy to the findings for trans-‐stilbene but less pronounced. The lowest peak is mainly due to a core excitation at the carbon atom no. 2 (red) of the phenyl ring at closest to the central C=C dimer at 286.70 eV with its final state orbital C including sizeable C 2p character at the peripheral phenyl rings. In contrast, the intermediate and highest peaks originate mainly from several core excitations at the central carbon atom no. 1 (dark blue) of the isomer between 287.25 eV and 289.50 eV. The corresponding final state orbitals are described by anti-‐bonding valence contributions at the peripheral phenyl rings where orbitals D and E of Fig. 2b at 287.25 eV and 289.50 eV,
respectively, are included as examples.
Altogether, the detailed final state orbital analysis for the free molecules can serve as a good basis to explain the experimental C K-‐edge NEXAFS spectra measured for the trans-‐ and cis-‐isomers of stilbene, yielding a reliable interpretation of their spectral features. The main peak structure near 285 eV in both spectra can be understood essentially by two different types of carbon core 1s excitations. The first type is described by final state orbitals of dominant anti-‐bonding C 2pz character at the central C=C dimer while the second at slightly higher energy involves final state orbitals of anti-‐bonding C 2pz character at the peripheral phenyl rings. The energetic separation between the two types of core excitations is smaller for cis-‐compared with trans-‐stilbene, yielding 0.4 eV and 0.6 eV, respectively, in the calculations. This is explained by the electronic consequence of the torsion of the two phenyl rings in the cis-‐isomer which perturbs the global π electron system existing in the planar trans-‐ isomer. Because of the different energetic separation, the experimental NEXAFS spectrum shows a broad single-‐peak structure near 285 eV for cis-‐ and a double-‐peak structure for trans-‐stilbene, which allows a spectral discrimination between the two isomers. While the experimental double peak-‐structure with a 0.25 eV splitting is reproduced qualitatively by the present calculations the theoretical core excitation spectrum of trans-‐stilbene yields a larger peak splitting near 285 eV. The origin of this quantitative difference may be due to the theoretical equilibrium geometries of the two isomers which are obtained by DFT optimizations rather than using more
accurate correlated wave function methods. This will affect the spectroscopic results to a lesser extent whereas larger errors are expected to be introduced by the use of the transition potential (TP) approximation to evaluate core excitation energies. Here the evaluation of specific core excited final states self-‐consistently may improve the agreement with experiment. This approach has been applied successfully in earlier studies of small hydrocarbon molecules Kolczewski 2001; Püttner 2004, but has not been considered so far for the present work due to its considerable computational effort. Improved calculations along these lines may also result in better agreement with experiment for the three-‐peak structure above 286 eV in the spectra of the two stilbene isomers, where in the experiment the peak structure is clearly visible for trans-‐ but washed out and shifted by 0.5 eV (compared with theory) for cis-‐stilbene.
B. Experimental NEXAFS spectra of stilbene adsorbed on Si(100)
Let us now turn to an identification of the stilbene isomers in the adsorbed state. Schmidt et al. have investigated trans-‐ and cis-‐stilbene adsorbed on Si(100) using photoemission and photoabsorption [14]. Small differences in the width of the carbon 1s core level line between the two isomers were observed, and differences in the valence band spectrum refer mostly to corresponding intensities but not to binding energies [14].
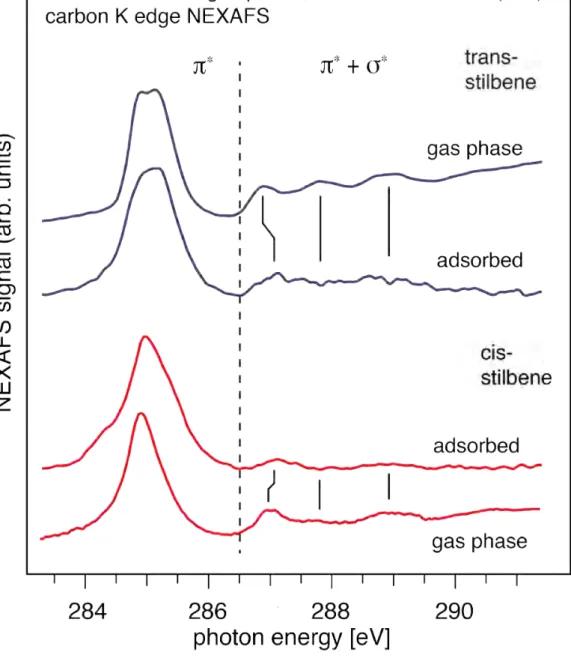
The NEXAFS spectra of one monolayer of cis-‐ and trans-‐stilbene are shown in Fig. 3, recorder under an angle of 55 °, together with the results from the gas phase. The polarization dependence of the strength of the NEXAFS signal suggests specific adsorption geometries as shown in Fig. 5 or ref. 14. The differences in the NEXAFS spectra shown in Figure 3 are much clearer than those in the carbon 1s core level photoemission line; while a single sharp line (with shoulders on either side indicating contributions from several transitions) is observed for the cis-‐isomer, the trans isomer exhibits a much wider line width, and the shape near the top suggests a (barely resolved) doublet. The three features between 286.5 eV and 289.5 eV are not sufficiently pronounced in the adsorbed state. This is not relevant since we have seen above that even under the favorable conditions of gas-‐phase experiments the energies of the corresponding peak structure are similar for trans-‐ and cis-‐stilbene, and only
the intensities, hard to analyze in the adsorbed state, may be used to distinguish between the isomers in this region.
The comparison between gas and adsorbed phase NEXAFS spectra shows that there are clear similarities between the two: especially for the cis-‐isomer, the dominating peak between 284 eV and 286 eV of stilbene adsorbed on Si(100) is almost identical to the gas phase signal, except for a shift of the entire spectrum by 0.2 eV to lower photon energies which we assign to the changes in reference level in the adsorbed state; the same shift actually occurs for trans-‐stilbene. The clear peak splitting for trans-‐stilbene is less resolved in the adsorbed state, most likely due to line broadening and small energy shifts induced by the interaction with the substrate. In particular, the spectrum of adsorbed trans-‐stilbene (lower blue curve) shows a weak shoulder at 284.7 eV which goes along with a possible slight decrease of the intensity of the lower-‐energy component of the double-‐peak structure. Moreover, the spectrum of adsorbed cis-‐stilbene (upper red curve) shows an additional shoulder at 284.3 eV. These shoulders are likely to be due to the bonding to the surface of cis-‐ and trans-‐stilbene, inducing a shift; in fact, both cis-‐ and trans-‐stilbene bind via the C=C-‐ bridge to the Si dimer atoms of the Si(100) surface, as determined from the angular dependence of π* transitionsSchmidt 2007b, and confirmed by calculations Carbone
2007. In the energy region where the shoulders are found, the gas phase calculations for both isomers predict significant contributions from the transition of the bridge carbon atom to the lowest unoccupied orbital 1π*, see blue vertical bars in region I of Fig. 2. The latter contains significant contributions from the π* orbital of the central C=C dimer, such that a shift of the transition caused by the interaction with the surface can be expected.
The less pronounced peaks at binding energies between 286.5 eV and 289.5 eV are less intense than in the gas phase such that statements concerning energy shifts have to be made with care. Nevertheless, the low-‐energy peaks around 287 eV of both isomers show evidence for a shift towards higher energies. According to theory, in this energy region contributions from the bridge carbon atoms to the final state orbitals are expected; these are also formed significantly by the π* orbital of the central C=C dimer, so that in summary the observed peak shifts support an interaction of the stilbene and the silicon substrate isomers via the C=C double bond of the
central bridge. Contrary to this, no energy shift is observed for the two high-‐energy peaks between 287.5 eV and 289.5 eV, suggesting that the σ* orbitals do not
contribute to the bond with the surface.
IV. Summary
In summary, our data show that the isomers of stilbene may be readily
distinguished by NEXAFS spectroscopy. The gas-‐phase spectra are interpreted on the basis of theoretical results and the differences in the isomers are explained on the basis of differences in interaction strength of the π* systems in the peripheral phenyl rings and the central C=C dimer due to the loss of the planar geometry by the trans-‐ to cis-‐transformation. A similar effect can be found in the N 1s NEXAFS spectrum of the isomers of TBA [26]. This suggests that the effect is more general and should be present not only in the NEXAFS spectra of stilbene and azobenzene derivatives, but also in those of imine derivates. Most importantly for the study of configurational changes in adsorbed species is the observation that such a distinction can also be achieved in the adsorbed state. This finding opens the way towards applying NEXAFS to the exciting field of molecular configurational analysis in different environments and in observing configurational switching processes in organic molecules on surfaces in particular.
Acknowledgments
We gratefully acknowledge the help of the BESSY staff, Birgit Zada and Willi Mahler. WE also thank Dr. C. Gahl for a critical reading of the manuscript. This work was partially supported by the German Research Foundation (DFG) via its SFB 658 (Elementary processes in molecular switches at surfaces).
Fig. 1. Experimental carbon K edge NEXAFS spectra of the trans-‐ and cis-‐stilbene isomers in the gas phase (indicated by data points), and calculated C 1s core excitation spectra. Ball-‐and-‐stick models of the corresponding molecules with their geometries optimized for the ground state are shown in the insets.
Fig. 2. Calculated C 1s core excitation spectra of free (a) trans-‐stilbene and (b) cis-‐ stilbene for excitation energies between 284 and 289 eV; total spectra (full lines) and C 1s excitation energies (painted vertical bars) for all non-‐equivalent carbon centers with corresponding excitation probabilities, see text. The bar colors distinguish
between the excitation centers labeled from 1 to 7, and reflect the colors used to paint the C atoms in the molecular sketches. Characteristic final state orbitals are included for illustration. The bottom shows the energy regions I, II, and III discussed in the text.
284 286 288
(a) trans-stilbene theory
photon energy [eV]
intensity [arb. units]
1 I II III A B C D E F 2 1 2 3 4 5 6 7 3 4 5 6 7
photon energy [eV]
intensity (arb. units)
284 286 288 (b) cis-stilbene theory 1 2 3 4 5 6 7 A B C D E 1 2 3 4 5 6 7 I II III
Fig. 3. Carbon K-‐edge NEXAFS spectra of trans-‐ and cis-‐stilbene adsorbed at the Si(100) surface compared with those from gas phase stilbene; see text.
References
1. T. Kobayashi, K. Yokota, and S. Nagakura, Bull.Chem.Soc.Japan 48, 412(1975). 2. A.P. Hitchcock, and C.E. Brion, J. Elec. Spec. Relat. Phenom. 19, 231(1980). 3 Ben L Feringa, Molecular Switches (Wiley Online Library, 2001).
4. J.K. Gimzewski, and C. Joachim, Science 283, 1683(1999).
5. T.R. Rizzo, Y.D. Park, L.A. Peteanu, and D.H. Levy, J. Chem. Phys. 84, 2534(1986). 6. J.M. Bakker, L.M. Aleese, G. Meijer, and G. von Helden, Phys. Rev. Lett. 91,
203003(2003).
7. M.A. Filler, and S.F. Bent, Prog. Surf. Sci. 73, 1(2003).
8. A. Fink, W. Widdra, W. Wurth, C. Keller, M. Stichler, A. Achleitner, G. Comelli, S. Lizzit, A. Baraldi, and D. Menzel, Phys. Rev. B 64, 045308(2001).
9. M.N. Piancastelli, J.J. Paggel, C. Weindel, M. Hasselblatt, and K. Horn, Phys. Rev. B 56, R12737(1997).
10. M.P. Casaletto, R. Zanoni, M. Carbone, M.N. Piancastelli, L. Aballe, K. Weiss, and K. Horn, Phys. Rev. B 62, 17128(2000).
11. M.N. Piancastelli, Z. Bao, F. Hennies, O. Travnikova, D. Ceolin, T. Kampen, and K. Horn, Appl. Surf. Sci. 254, 108(2007).
12. M.N. Piancastelli, N. Motta, A. Sgarlata, A. Balzarotti, and M. De Crescenzi, Phys. Rev. B 48, 17892(1993).
13. M.P. Casaletto, M. Carbone, M.N. Piancastelli, K. Horn, K. Weiss, and R. Zanoni, Surf. Sci. 582, 42(2005).
14. P.M. Schmidt, K. Horn, J.H. Dil, and T.U. Kampen, Surf. Sci. 601, 1775(2007). 15. M.R. Weiss, R. Follath, K.J.S. Sawhney, F. Senf, J. Bahrdt, W. Frentrup, A. Gaupp, S.
Sasaki, M. Scheer, H.-‐C. Mertins, D. Abramsohn, F. Schäfers, W. Kuch, and W. Mahler, Nucl.Instr. Methods A 467, 449(2001).
16. C. Kolczewski, R. Püttner, M. Martins, A.S. Schlachter, G. Snell, M.M. Sant'Anna, K. Hermann, and G. Kaindl, J. Chem. Phys. 124, 034302(2006).
18. L. Triguero, and L. Pettersson, Phys. Rev. B 58, 8097(1998).
19. K. Hermann, L.G.M. Petterson, M.E. Casida, C. Daul, A. Goursot, A. Koester, E. Proynov, A. St-‐Amant, D.R. Salahub, and V. Caravetta, StoBe software, http://www.fhi-‐berlin.mpg.de/KHsoftware/StoBe/index.html
20. R. Püttner, C. Kolczewski, M. Martins, A.S. Schlachter, G. Snell, M. Sant'Anna, J. Viefhaus, K. Hermann, and G. Kaindl, Chem. Phys. Lett. 393, 361(2004).
21. C. Kolczewski, R. Püttner, O. Plashkevych, H. Ågren, V. Staemmler, M. Martins, G. Snell, A.S. Schlachter, M. Sant'Anna, and G. Kaindl, J. Chem. Phys. 115, 6426(2001). 22. V. Molina, M. Merchán, and B.O. Roos, Journal of Physical Chemistry A 101,
3478(1997).
23. V. Molina, M. Merchán, and B.O. Roos, Spectrochim. Acta Part A 55, 433(1999). 24. M.G. Zahl, V. Myrseth, T.H. Andersen, J. Harnes, A. Borg, L.J. Sæthre, and K.J. Børve,
Journal of Physical Chemistry C 114, 15383(2010).
25. L.J. Sæthre, K.J. Børve, and T.D. Thomas, J. Elec. Spec. Relat. Phenom. 183, 2(2011). 26. R. Schmidt, S. Hagen, D. Brete, R. Carley, C. Gahl, J. Dokić, P. Saalfrank, S. Hecht, P.
Tegeder, and M. Weinelt, Phys. Chem. Chem. Phys 12, 4488(2010).