Page 1
E
xEcutivES
ummaryNew Hackett research indicates that the manufacturing competitiveness of China compared to advanced economies and low-cost geographies is eroding. Stagnant or declining manufacturing wages in the West, rising transportation costs, con-cerns about intellectual property protection, and Chinese wage-rate inflation have brought traditional calculations about global manufacturing sourcing strategies to a tipping point, encouraging companies to reshore some manufacturing capac-ity while moving additional capaccapac-ity from China to other low-cost geographies. Companies need to stay abreast of this trend and develop sophisticated analytical models to improve manufacturing sourcing decision-making processes.
In a departure from our usual focus on the impact of globalization on business services organizations (IT, finance, procurement and HR), in this research we turn our attention to the operations side of the business, specifically on manufacturing sourcing strategies. In these pages, we analyze the ways that companies are adapt-ing their business strategies to changadapt-ing global and regional market conditions. Additionally, using hard data from our 2012 Supply Chain Optimization study, we were able to closely analyze the trend in “reshoring” of manufacturing capac-ity. Our findings debunk a myth about the future of manufacturing that has been much discussed in the press recently: that manufacturing capacity is returning in a big way to Western countries as a result of rising costs in China.
The reality is that the net amount of capacity coming back barely offsets the amount that continues to be sent offshore. Our study confirms that China’s rela-tive competirela-tive position is indeed eroding rapidly, to the detriment of its overall economy. However, few of the low-skill Chinese manufacturing jobs will ever return to advanced economies; most will simply move to other low-cost countries. Finally, we offer recommendations on how companies should plot their manufac-turing sourcing strategies in light of these and other study findings.
By Michel Janssen, Erik Dorr and David P. Sievers
E
ntErprisE
s
tratEgy
Study Results Analysis
r
Eshoring
g
lobal
M
anufacturing
:
M
yths
and
r
EalitiEs
By next year, China’s cost advantage over manufacturers in industrialized nations and competing low-cost destinations will evaporate.
Complimentar
y R
esear
t
hEE
conomici
mpact ofG
lobalm
anufacturinGS
ourcinG It has been several decades since globalization of manufacturing sourcing began with movement of low-value-added activities from developed economies to emerging economies. For many companies, the trend brought about a complete rethinking of the manufacturing footprint, including changes in suppliers and sourcing locations.The transition to a global supply chain has been a hugely important engine of economic growth around the world. Between 1990 and 2010, the nominal value of global exports of manufactured goods more than quadrupled (Fig. 1). When adjusted for inflation, this equates to a near tripling of value and a compound annual growth rate of 5.5%. To put this into perspective, during the same period, the combined GDP of North America, Europe, Japan and the BRIC countries grew at a compounded rate of around 3.0%, resulting in real GDP growth of about 80%. China has been the biggest beneficiary of these developments. Between 1990 and 2010, its share in global manufacturing exports grew from 1.8% to 14.4%.
FIG. 1 Global manufacturing exports and China/BRIC share, 1990-2010
Source: World Trade Organization
OFFICE AND TELECOM EQUIPMENT CHEMICALS TEXTILES AND CLOTHING OTHER MANUFACTURING BRIC SHARE CHINA SHARE 0.0 1990 1991 1992 1993 1994 1995 1996 1997 1998 1999 2000 2001 2002 2003 2004 2005 2006 2007 2008 2009 2010 0.0% 2.0% 4.0% 6.0% 8.0% 10.0% 12.0% 14.0% 16.0% 18.0% 20.0% 2.0 4.0 6.0 8.0 10.0 12.0 US$ (trillions) 3.0% 3.4% 3.7% 4.9% 5.3% 5.3% 5.1% 5.6% 5.6% 5.7% 6.4% 7.0% 7.9% 9.0% 10.2% 11.8% 13.0% 14.0% 15.2%15.8% 17.2% 1.8% 2.2% 2.4% 2.7% 3.2% 3.3% 3.2% 3.7% 3.8% 3.9% 4.5% 5.1% 6.0% 7.0% 7.9% 9.3% 10.5%11.6% 12.4%13.1% 14.4%
Page 3
m
anufacturinGS
ourcinGD
EciSionD
rivErSThe macro trend discussed above is the outcome of the business strategies and manufacturing and sourcing decisions of individual companies. These are guided by specific criteria and an evaluation of market and other conditions in different geographies against these criteria.
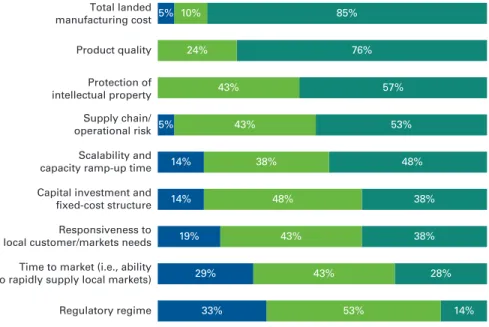
Our study confirmed that the most important decision driver in the development of a manufacturing sourcing strategy is total landed cost (Fig. 2). Product quality, protection of intellectual property rights and supply chain risk trail in importance. Regulatory regime ranks as the least important criterion.
The relative importance of individual criteria varies by industry. Factors like scal-ability, time to market and capacity ramp-up speed tend to be more important in highly dynamic industries with short product life cycles and high levels of demand variability. Consumer electronics is an example of this type of industry. Conversely, less dynamic but highly price-sensitive industries such as furniture manufacturing ascribe more importance to total landed cost. The success of Chinese manufacturing can be explained largely by the fact that for many indus-tries the country offers the highest value proposition when measured against the various criteria illustrated above. Other geographies may be more attractive in one or two criteria for manufacturers that especially value those specific factors. However, with the possible exception of protection of intellectual property, China historically has offered the most balance among the range of key decision drivers. FIG. 2 Level of importance of manufacturing sourcing strategy decision driver
Source: Supply Chain Optimization Study, The Hackett Group, 2012
Regulatory regime Time to market (i.e., ability to rapidly supply local markets) Responsiveness to local customer/markets needs Capital investment and fixed-cost structure Scalability and capacity ramp-up time Supply chain/ operational risk Protection of intellectual property Product quality Total landed manufacturing cost
NO OR MINOR IMPORTANCE IMPORTANT VERY IMPORTANT
0.00000016.66666733.33333350.00000066.66666783.333333100.000000 85% 10% 24% 43% 57% 76% 5% 5% 14% 14% 48% 38% 38% 48% 43% 53% 19% 29% 33% 53% 14% 43% 28% 43% 38%
“Total landed cost” defined Total landed cost is the set of end-to-end supply chain costs to transform raw materials and components into a finished good ready for sale. Key components include: • Raw material and component
costs
• Manufacturing costs (fixed and variable)
• Transportation and logistics • Inventory carrying cost • Taxes and duties
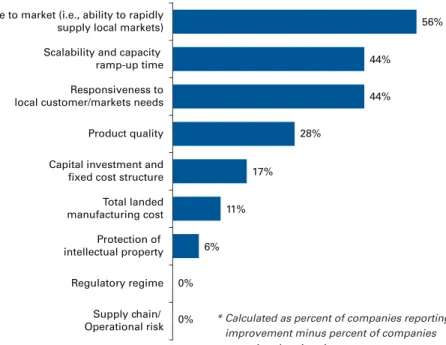
Changes in manufacturing sourcing strategy can be brought about by changes in the performance of low-cost manufacturing destinations against these deci-sion drivers. At present, the overall picture reveals a gradual maturing of low-cost manufacturing destinations (Fig. 3). The three most-improved areas are all related: time to market, responsiveness and scalability. Quality has improved for most manufacturers.
However, in the first, third and fourth-highest-ranked criteria in terms of impor-tance (as shown in Fig. 2) – cost, intellectual property rights and supply chain risk – the number of companies reporting deterioration is about equal to those reporting improvement. This is an indication that improvements are becoming increasingly difficult to achieve, and in turn, more companies are starting to evaluate alternative sourcing options for manufacturing.
FIG. 3 Net improvement experienced in manufacturing operations in low-cost countries over the last 5 years*
Source: Supply Chain Optimization Study, The Hackett Group, 2012
* Calculated as percent of companies reporting improvement minus percent of companies reporting deterioration
0 10 20 30 40 50 60
Time to market (i.e., ability to rapidly
supply local markets) 56%
44% 44% 28% 17% 11% 6% 0% 0% Scalability and capacity
ramp-up time Responsiveness to local customer/markets needs Product quality Capital investment and fixed cost structure Total landed manufacturing cost Protection of intellectual property Regulatory regime Supply chain/ Operational risk
Page 5
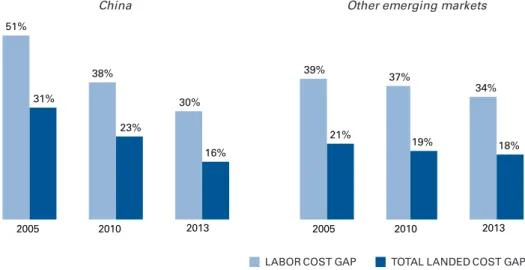
A more detailed inspection of trends in total landed cost (Fig. 4) and its two main underlying drivers, productivity and labor cost, reveals that the total landed cost gap with China is shrinking rapidly, primarily due to wage-rate inflation1. Other
con-tributors are higher fuel prices and the resulting rise in transportation costs. In a testament to the extremely rapid maturing of Chinese manufacturing industries, companies in our study project that by 2013, the productivity gap with China will have disappeared. However, by then, total landed cost will have shrunk to 16%. During the same period, the total landed cost differential in other low-cost geog-raphies is expected to remain relatively stable, at around 20%, due to improved productivity and more-moderate increases in labor cost. In conclusion, China’s cost advantage is eroding, both relative to domestic manufacturers in advanced economies, and relative to competing low cost destinations.
Projections vary widely depending on company and industry. In industries with a high labor-cost component in total landed cost, the financial advantages of off-shore manufacturing continue to be extremely compelling and sustainable. But in many others, companies must constantly reevaluate manufacturing sourcing decisions based on changes in regional market conditions. There are also some instances where, regardless of the cost gap, domestic manufacturing is simply not feasible due to a lack of capacity and scalability (see sidebar).
FIG. 4 Manufacturing cost gaps
Source: Supply Chain Optimization Study, The Hackett Group, 2012 0
10 20 30 40 50 60 0 10 20 30 40 50 60 18% 19% 21% 16% 23% 31% 34% 37% 39% 30% 38% 51% 2013 2010 2005 China 2013 2010 2005
Other emerging markets
TOTAL LANDED COST GAP LABOR COST GAP
Apple’s iPad® assembly sourcing strategy
The Chinese labor-cost compo-nent of an entry-level iPad retail-ing for $500 is estimated at $10, or 2% of revenue, while the profit margin is estimated at $150, or 30% of revenue.
If Apple were to move production to the USA, and if one assumes that assembly costs would triple (to $30), it is conceivable that Apple could convince customers to pay for a large portion of the price increase based on the appeal of a “made in the USA” product. The impact on margins of any cost that could not be passed on would be modest.
Furthermore, in light of recent negative publicity about Chinese labor conditions, and considering the high unemployment rate in the U.S., such a move could sub-stantially boost Apple’s corporate image.
However, the U.S. lacks the sheer labor capacity that would be required in order to ramp up production of iPads at the speed needed to maintain the company’s edge in the hyper-competitive tablet and mobile device market. Also, U.S. regulations on working conditions, as well as cultural fac-tors, would make it impossible for domestic manufacturing facilities to achieve the productivity levels of Chinese facilities.
Thus one may assume that Apple’s manufacturing sourcing strategy is primarily motivated by scalability and supply chain risk, and only secondarily by total landed cost.
u
nDErStanDinG thED
ynamicS ofm
anufacturinGS
ourcinGS
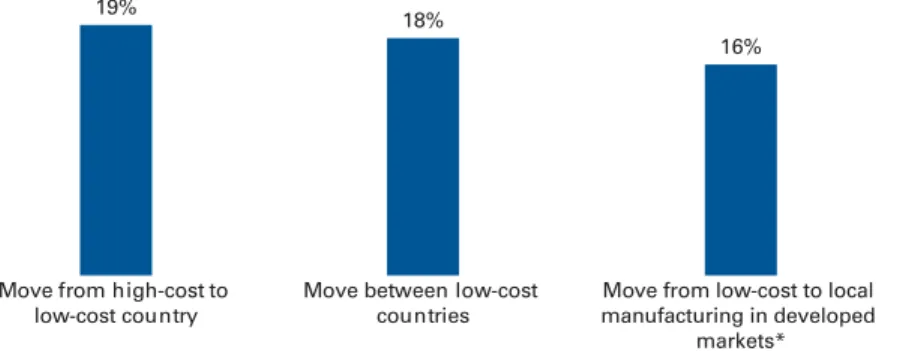
tratEGiESAn important factor explaining the dynamics of manufacturing sourcing strate-gies is the cost threshold for companies to move capacity in and out of geographies (Fig. 5). According to our research, companies begin to consider moving capacity out of high-cost industrialized economies when the cost gap approaches 20%. Of course, in practice, extensive financial modeling is required to build the business case, including factoring in the costs of transition cost and operational risk.
A second important parameter is the threshold at which it makes sense to move capacity from one low-cost geography to another. Not surprisingly, the decision point is about the same. This implies that when the rate of inflation (usually driven by wage rates) in a given geography begins to exceed that of a competing geography, the situation will trigger substantial movement of manufacturing capacity from one to the other. A third threshold metric relates to the much-discussed phenomenon of “reshoring.” According to study participants, when the total landed cost gap nar-rows to 16%, moving capacity out of low-cost geographies and back into domestic markets becomes a viable option. In Fig. 4, we saw that the total landed cost gap with China is expected to reach 16% by 2013. (It is important to recall that total landed cost is an important consideration for many manufacturers, but scalability and ramp-up time factors may trump this factor for others.)
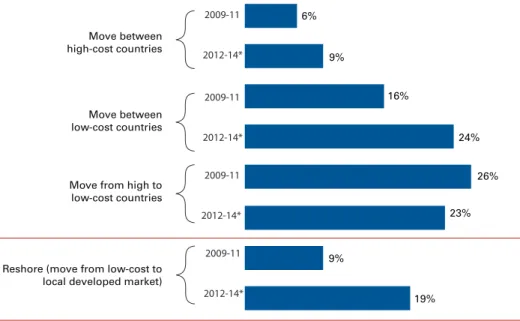
There are a number of conclusions that can be drawn based on our study data. First, reshoring will accelerate and reach an inflection point over the next few years, grow-ing from impactgrow-ing 9% of manufacturgrow-ing capacity (2009-12) to a projected 19% (2012-14) (Fig. 6). At 24%, movement between low-cost countries will impact the highest percentage of capacity, closely followed by the ongoing movement of capac-ity away from high-cost countries into low-cost geographies.
FIG. 5 Total landed cost gap threshold to trigger change in manufacturing sourcing strategy
Source: Supply Chain Optimization Study, The Hackett Group, 2012
0 5 10 15 20 16% 18% 19%
Move from low-cost to local manufacturing in developed
markets*
* The level at which the cost gap needs to narrow for companies to consider moving work out of low-cost countries and into local developed markets.
Move between low-cost countries Move from high-cost to
Page 7
However, the analysis also shows that the continued outflow of capacity from advanced economies will more than offset any capacity being reshored. This find-ing is further confirmed by data about the life-cycle stage of the different types of manufacturing sourcing strategies discussed. Thirty-five percent of manufacturers studied are actively involved in moving capacity from high-cost to low-cost coun-tries (Fig. 7), far more than the 20% actively undergoing reshoring initiatives. In fact, there is no dominant movement of capacity in any single direction. Rather, companies are continuously optimizing their manufacturing footprint in response to changing conditions.
FIG. 6 Percent of manufacturing capacity impacted by change in sourcing strategy
Source: Supply Chain Optimization Study, The Hackett Group, 2012
0 5 10 15 20 25 30 6% 9% 16% 24% 26% 23% 9% 19% Move from high to
low-cost countries Move between high-cost countries 2009-11 2012-14* * projected Move between low-cost countries 2009-11 2012-14* 2009-11 2012-14*
Reshore (move from low-cost to local developed market)
2009-11 2012-14*
FIG. 7 Life-cycle stage of current manufacturing sourcing strategies
Source: Supply Chain Optimization Study, The Hackett Group, 2012
THEORETICAL - DISCUSSION HAS OCCURRED; NO INVESTIGATION INVESTIGATIVE - COMPANY INVESTIGATING COST/BENEFITS PLANNING - FORMAL PLANS FOR EXECUTION BEING ESTABLISHED IMPLEMENTATION - TRANSITION UNDERWAY
Move between high-cost countries Move between low-cost countries Move from high-cost to low-cost countries Reshoring - Moving capacity from low-cost to local developed markets
0.00000016.66666733.33333350.00000066.66666783.333333100.000000 54% 12% 12% 27% 46% 7% 20% 41% 12% 35% 46% 18% 24% 38% 8%
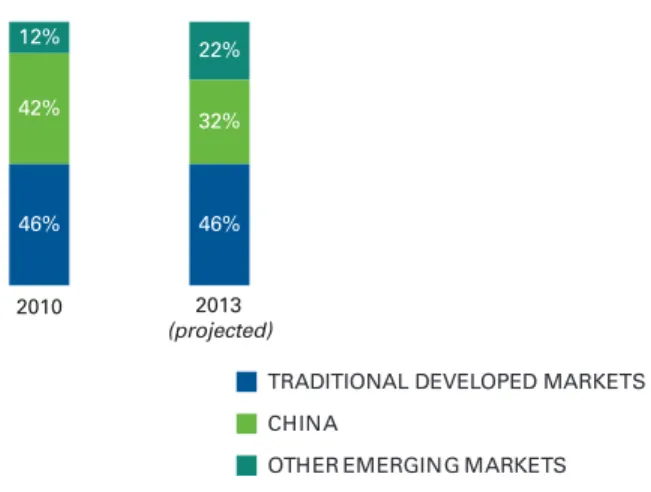
China is affected the most, given a net decline in the total capacity share both through reshoring-driven outflows and movement of capacity to other low-cost geographies (Fig. 8). While the data on which this finding is based is solely from companies participating in our study – a self-selected group that already has substantial manufacturing capacity in low-cost geographies – the projection of China’s declining share of global capacity remains statistically relevant.
As domestic demand rises in China and other fast-growing markets, additional manufacturing capacity will be needed. At present, China excels in low-skill manufacturing work, making products developed elsewhere and shipped out for Western consumption. To stay competitive and maintain growth in the face of its eroding cost competitiveness, China will need to modernize and spur innovation in its manufacturing industries.
a
ctioni
tEmSThere are a number of things that executives can do to optimize their manufactur-ing sourcmanufactur-ing strategy. These involve developmanufactur-ing a clear picture of the company’s global supply and demand dynamics; gaining an understanding of total landed costs – both current-state and longer-term trends; and establishing a process for conducting ongoing manufacturing sourcing reviews supported by strategic, cost and performance triggers. Action items include:
1. Develop a global manufacturing review process: With so many factors
affecting global manufacturing, we recommend that companies establish a systematic, forward-looking process to drive decision making (e.g., make-vs.-buy, core competencies). This should integrate the views of manufacturing, procurement, finance and business-unit leadership.
FIG. 8 Estimated share of total manufacturing capacity by region, based on cost of goods sold
Source: Supply Chain Optimization Study, The Hackett Group, 2012
0 20 40 60 80 100 46% 46% 32% 42% 22% 12% 2013 (projected) 2010
TRADITIONAL DEVELOPED MARKETS CHINA
Page 9
2. Clarify the global demand picture: Critical inputs to manufacturing strategy
are demand by region and possible approaches for satisfying this demand. Create a model that considers demand forecast, differentiated product needs, supply-base capabilities and local competitive threats.
3. Embrace supply chain analytics: Interest in this area is growing, yet for a
number of reasons, companies have difficulty establishing this capability. To allow greater focus, create a Center of Excellence for analytics and develop a capability that includes scenario modeling and financial analysis to support decision making.
4. Build a strategy for talent management: Being competitive requires a
delib-erate strategy for acquiring, developing and retaining manufacturing opera-tions talent with needed skills. Ensure that ongoing investment in talent is prioritized as a critical element of the operations strategy.
5. Establish a game plan to deal with risk:Geopolitical, supply base,
envi-ronmental and commodity risks are a given. Establish a proactive approach to anticipate risks, creating mitigation plans with clear triggers for imple-mentation.
6. Broaden the decision making approach beyond total landed cost: Changes
in supply/demand characteristics and risk profiles can impact profitability from a revenue perspective. Revise the decision-making methodology to include an evaluation of supply-chain responsiveness, opportunistic demand, and revenue at risk due to changing supply-assurance considerations.
7. Identify the dominant factors and prioritize programs accordingly:
Determine the factors to which your organization is most sensitive, based on an assessment of impact to profitability, risk and responsiveness. Establish a long-term roadmap tailored to address the areas where the potential impact is greatest.
r
ElatEDh
ackEttr
ESEarch“Job Losses from Offshoring and Productivity Improvements Far Outpace Gains from Economic Growth,” March 2012
“New Data: 2.8 Million Business-Support Jobs Eliminated Since 2000; One Million More to Disappear by 2014,” November 2010
a
bout thEa
DviSorSMichel Janssen
Principal and Chief Research Officer
Mr. Janssen is responsible for developing The Hackett Group’s core intel-lectual property, including thought leadership. He works with the com-pany’s Executive Advisory Council to understand the strategic impact of new and emerging trends on the business functions. He also heads Hackett’s team of researchers and analysts in the US, Europe and India in the design and implementation of research studies; analysis of results; and production of result-ing findresult-ings. Previously Mr. Janssen was president of Supplier Solutions for Everest Group and co-founded the Everest Research Institute. In addition, he provided strategic oversight for Everest’s Outsourcing Center, the world’s largest outsourcing community and vehicle for identifying early industry trends. He was also a senior director in Gartner Group’s Strategic Sourcing practice and held numerous manage-ment positions with EDS.
Erik Dorr
Senior Research Director, Finance and EPM Executive Advisory Programs
Mr. Dorr started his professional career of over 20 years as an IT con-sultant, and then moved on to a CIO position at a large manufactur-ing company. Next, he worked as a research analyst covermanufactur-ing enterprise business applications and technology strategy. Leveraging the extensive experience he gained working with financial organizations and optimizing financial processes, he was named to his present role in early 2010.
David P. Sievers
Principal, Archstone Consulting
Mr. Sievers has over 15 years consulting experience, specializing in defining business improvement strategies and implementing opera-tional improvement programs. He has worked with consumer products, service, retail, and general manufacturing companies throughout North America and Europe. Prior to co-founding Archstone Consulting, now a division of The Hackett Group, Mr. Sievers was a partner at Deloitte Consulting, where he was led sales and marketing services within the company’s Consumer Business group. He also launched and led Roundarch Europe, a joint venture between Deloitte and WPP. Mr. Sievers began his career with General Electric.
About The
Hackett Group
The Hackett Group (NASDAQ: HCKT), a global strategic advisory firm, is a leader in best practice advisory, bench-marking, and transformation consulting services including strategy and opera-tions, working capital management, and globalization advice. Utilizing best practices and implementation insights from more than 4,000 benchmarking engagements, executives use The Hackett Group’s empirically based approach to quickly define and implement initia-tives to enable world-class performance. Through its REL group, The Hackett Group offers working capital solutions focused on delivering significant cash flow improvements. Through its Archstone Consulting group, The Hackett Group offers strategy and operations consulting services in the Consumer and Industrial Products, Pharmaceutical, Manufacturing and Financial Services industry sectors. Through its Hackett Technology Solutions group, The Hackett Group offers business application consulting services that help maximize returns on IT investments. The Hackett Group has worked with 2,700 major corporations and government agen-cies, including 97% of the Dow Jones Industrials, 80% of the Fortune 100, 80% of the DAX 30 and 49% of the FTSE 100. Founded in 1991, The Hackett Group was acquired by Answerthink, which was renamed The Hackett Group in 2008. The company has offices in the United States, Europe and India and is publicly traded on the NASDAQ as HCKT. Email: [email protected] Amsterdam + 31 36 535 00 82 Atlanta +1 770 225 3600 Frankfurt am Main +49 69 900 217 0 London +44 20 7398 9100 Paris +33 1 53 43 0400 Sydney +61 2 9299 8830 Zurich