DISCUSSION PAPER SERIES
Forschungsinstitut zur Zukunft der Arbeit Institute for the Study
Does Experience Rating Reduce Disability Inflow?
IZA DP No. 7344
April 2013
Tomi Kyyrä
Juha Tuomala
Does Experience Rating Reduce
Disability Inflow?
Tomi Kyyrä
Government Institute for Economic Research, Helsinki, University of Helsinki and IZA
Juha Tuomala
Government Institute for Economic Research, Helsinki
Discussion Paper No. 7344
April 2013
IZA P.O. Box 7240 53072 Bonn Germany Phone: +49-228-3894-0 Fax: +49-228-3894-180 E-mail: [email protected]Anyopinions expressed here are those of the author(s) and not those of IZA. Research published in this series may include views on policy, but the institute itself takes no institutional policy positions. The IZA research network is committed to the IZA Guiding Principles of Research Integrity.
The Institute for the Study of Labor (IZA) in Bonn is a local and virtual international research center and a place of communication between science, politics and business. IZA is an independent nonprofit organization supported by Deutsche Post Foundation. The center is associated with the University of Bonn and offers a stimulating research environment through its international network, workshops and conferences, data service, project support, research visits and doctoral program. IZA engages in (i) original and internationally competitive research in all fields of labor economics, (ii) development of policy concepts, and (iii) dissemination of research results and concepts to the interested public. IZA Discussion Papers often represent preliminary work and are circulated to encourage discussion. Citation of such a paper should account for its provisional character. A revised version may be available directly from the author.
IZA Discussion Paper No. 7344 April 2013
ABSTRACT
Does Experience Rating Reduce Disability Inflow?
*This study explores whether the experience rating of employers’ disability insurance premiums affects the inflow of older employees to disability benefits in Finland. To identify the causal effect of experience rating, we exploit a pension reform that extended the coverage of the experience-rated premiums. The results show that a new disability benefit claim can cause substantial cost to the former employer through an increased premium. Nonetheless, we find no evidence of the significant effects of experience rating on the disability inflow. The lack of the behavioral effects may be due to the complexity of experience rating calculations and/or limited employer awareness.
JEL Classification: J14, J26, H32
Keywords: experience rating, disability insurance, early retirement
Corresponding author: Tomi Kyyrä
Government Institute for Economic Research Valtion taloudellinen tutkimuskeskus
Arkadiankatu 7 PO Box 1279 00101 Helsinki Finland E-mail: [email protected]
*
1 Introduction
Disability benet programs have attracted considerable interest among economists on both sides of the Atlantic. This is not surprising, given the economic importance of these pro-grams. For example in 2005, 26 million people in the European Union countries were on disability benets, while in the United States 7.7 million people received benets through the Social Security Disability Insurance program and 4.4 million through the Supplemen-tary Security Income program (Benítez-Silva et al., 2010). Most economic studies of dis-ability programs have focused on estimating the eects of benet levels or eligibility criteria on labor supply (e.g. Gruber, 2000; Black et al., 2002; Campolieti, 2004; Autor & Duggan, 2003, 2006; Karström et al., 2008; Kyyrä, 2010; Staubli 2011). Far less eort has been devoted to analyze the role of employers and their incentives, which is the topic of this study.
When a worker applies for a disability benet, the employer typically has no direct control over the decision that the medical professionals make. Nonetheless, the employer can inuence disability outcomes indirectly. For example, the employer may reduce the onset of disabling illnesses at the workplace by investing in workplace health and safety, and by allocating the workload appropriately between employees. When the worker anyway develops a medical condition that reduces his or her working capacity, the employer has the discretion of whether to provide physical aid or retraining or whether to modify the worker's job tasks, which may enable the worker to remain at work. The problem is that the employer's incentives to implement these types of measures can be weak even if their costs to the employer were considerably less than the costs of a new disability benet claimant to the society.
One policy option that may mitigate this problem is to require individual employers to bear some of the costs of their employees' disability benet claims through experience-rated disability insurance (DI) premiums. With experience rating, the employer's premium is adjusted to reect the costs of its workers' disability benet claims in comparison to other employers. Employers with high disability costs are penalized through a surcharge on top of the base premium, while employers with low disability costs are rewarded by giving a discount on the base premium. If successful, experience rating induces employers to improve their workplace health and safety, and encourages them to implement cost-eective accommodations that enable those employees who have health problems to remain on the job. This should result in fewer individuals claiming disability benets. However, there is no compelling evidence to what extent, if at all, the experience rating of the DI premiums aects the disability inow.1 We address this question by quantifying the eect of the
experience rating on the disability inow of the older workers in Finland.
1There is an extensive literature on the eects of experience rating in other forms of social security, including workers' compensation for on-the-job injuries (e.g. Ruser, 1991; Bruce & Atkins, 1993; Kralj, 1994; Thomason & Pozzebon, 2002), unemployment insurance (e.g. Topel, 1983; Meyer, 2002, Anderson & Meyer, 1993, 2000) and unemployment-related pensions (Hakola & Uusitalo, 2005). Given that the employer has less control over disability outcomes than layos and workplace injuries, these studies do not oer much guidance for understanding the role of experience rating in DI.
This topic is of considerable interest, as reforming disability programs are high on the policy agenda of many governments and experience rating is viewed as a potentially eec-tive policy. For instance, Autor (2011) and Burkhauser & Daly (2011) have recently sug-gested that the U.S. Social Security DI program should be nanced by an experience-rated payroll tax. To motive this policy proposal, these authors rely on anecdotal evidence from the Netherlands. Over the past two or three decades, the Netherlands has implemented a series of disability program reforms, including the introduction of experience-rated DI premiums in 1998. These reforms have been followed by sharp declines both in the dis-ability inow and in the share of the Dutch population on disdis-ability benets (for example, see García-Gómez et al., 2011). However, due to the number of simultaneous changes that confound the eects of individual policy measures, it is not clear to what extent adopting the experience rating explains these outcomes.2 The analysis of the Finnish DI system
pro-vides an alternative - perhaps one that is even better point of reference - for the discussion of the eciency of experience rating in DI.
In Finland, employers are subject to various degrees of experience rating depending on the size of the rm. To identify the eects of experience rating, we utilize a reform that unied the major pensions Acts in the private sector in 2007. This reform had nothing to do with experience rating, but it accidentally extended the coverage of experience rating to certain new groups of workers and their employers. After this reform, medium-sized and large rms began to pay experience-rated DI premiums for their employees who used to be insured under specic pension Acts. In contrast, the smaller rms in the same industries were not aected but continued to pay at-rate DI premiums. As a consequence, we can compare disability outcomes under the experience rating and at-rate schemes in a dierence-in-dierences type of setting.
Using linked employer-employee data, we construct various measures of disability in-ows and compare their changes between the pre-reform and post-reform periods in the rms of dierent size. This analysis conducted at the rm level does not support the hy-pothesis that experience rating reduces disability inow. In the next stage, we compute marginal costs for all the employees who were at risk of being awarded a disability benet. The marginal cost is dened here as the expected increase in the employer's future DI premium that would result if a disability benet would have been awarded to the worker. Before the 2007 reform, the marginal cost was zero for all the employees in all rms. In the post-reform period, the marginal costs for the employees of medium-sized and large rms became positive and increased over time due to the gradual adoption of the
experi-2Koning (2009) found that the disability inow decreased in the Dutch rms that experienced a change in the DI premium when compared to the rms with unchanged premiums. Koning interpreted this as evidence that employers were not completely aware of experience rating and therefore the premium change served as a wake-up call, which induced preventative measures that reduced the disability events in the subsequent years. Since his data only covered the post-reform years, there were no exogenous changes in the rms' premiums but all the changes were driven by the past change in the disability benet claims made by the rm's own employees. While the results point to some behavioral responses and information imperfections, the results do not describe the causal eects of experience rating as compared to the counterfactual case of the at-rate DI premiums, which we analyze in this study.
ence rating system. The resulting exogenous variation in the marginal costs allows us to estimate the causal eects of experience rating. We rst demonstrate that the marginal cost can be high, being comparable in size to a worker's annual salary in many cases. The marginal costs are particularly high for relatively young employees in large rms. Then we add the marginal cost as an explanatory variable to various probability models for transitions out of work. Consistently with our ndings from the rm-level analysis, the results from these models imply that experience rating has no eect on the transition rate to disability benets. Thus, in the light of our analysis, the eciency of experience rating as a disability prevention device seems questionable. This is perhaps an unexpected result, given the size of the costs the employers are liable for. The lack of the behavioral eects may be due to the complexity of the premium calculations, limited employer awareness and/or the transitional provisions associated with the pension reform.
This paper will proceed as follows: In the next section we discuss the disability benet schemes and DI premiums in Finland. In Section 3 we describe the pension reform that extended the coverage of experience rating. In Section 4 we describe the data and report some descriptive statistics. Section 5 presents the results of our rm-level analysis. In Section 6 we discuss the computations of the marginal costs and report the results for the individual-specic transition rates. The nal section concludes.
2 Institutional framework
2.1 Sickness and disability benetsAn employee who is unable to perform his or her job due to illness or injury is entitled to compensation for income loss. In order to receive this compensation, the applicant needs a statement by a doctor certifying that he or she is not capable of work. For the rst weeks (typically one to three months), the applicant is fully compensated by the employer, after which he or she can claim a sickness benet. The sickness benet can be received for a maximum of about one year (300 working days, Saturdays included). Depending on the illness or the injury, the applicant's rehabilitation needs are assessed in a more extensive medical examination during the sickness benet period. In case of prolonged disability, an individual between the ages of 16 and 62 can qualify for one of four possible disability benets: (i) a partial disability pension, (ii) a full disability pension, (iii) a partial rehabilitation benet, or (iv) a full rehabilitation benet.
When it is unlikely that an applicant will return to work, he or she is awarded a disability pension for an indenite period of time. Otherwise the applicant is entitled to a rehabilitation benet (also known as a temporary disability pension), which is granted only for a specic period. The receipt of this benet also requires that a rehabilitation plan has been drafted. For both benet types, a full benet is conditional on a loss in the working capacity of at least 60% and a partial benet for a loss of at least 40% but below 60%. Disability evaluations are always made by trained professionals. When determining
eligibility, the individual's age, education, occupation, place of residence and capability to support herself or himself by regular work are all taken into account along with the medical assessment. A disability pension may also be discontinued if the working capacity of the recipient improves, which rarely happens among older recipients. There is no automatic retesting of the disability status, except for new periods of the rehabilitation benet. The disability benets can be received until the age of 63 when the entitlement to an old-age pension begins.
2.2 Disability insurance premiums
A major part of disability benet costs is nanced by partially experience-rated premiums (or payroll taxes). The degree of experience rating depends on the rm size, as measured by a rm's payroll two years earlier. Small rms are not subject to experience rating and they only pay base premiums. The base premium is calculated by taking the sum of the age-specic DI taxes over all employees:
Qkt= X
j
ζt(xjt)wjt, (1)
wherekindexes the rm andtindexes the year,ζtis the DI tax rate,3 andxjt andwjt are
the age and annual salary of employeej, respectively.
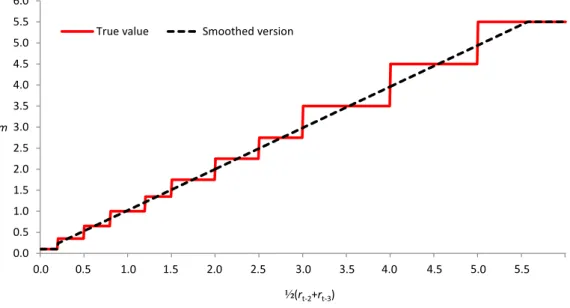
Large rms pay experience-rated premiums, which are calculated by multiplying the base premium by the experience multiplier m rk(t−2), rk(t−3)
. This multiplier takes a value between 0.1 and 5.5, depending on the costs of the disability pension claims made by the rm's former employees two to three years earlier. These costs are measured by risk ratios rk(t−2) and rk(t−3), which are dened below. On the basis of the average of
these risk ratios, the rm is allocated to one of 11 possible contribution categories, each of which corresponds to a particular value of m. See the solid line in Figure 1.4 The
experience-rated premium mQkt can dier substantially from the base premium Qkt. In
principle, a large rm can obtain a 90% discount on the base premium or be obligated to pay a 450% surcharge on top of the base premium.
In contrast to small and large rms, medium-sized rms pay a weighted sum of the base and experienced-rated premiums, and are thus only partially covered by the experience rating. In general, the DI premium is calculated as
Ckt= 1−α(Wk(t−2))
Qkt+α(Wk(t−2))m rk(t−2), rk(t−3)
Qkt, (2)
whereWk(t−2) is the payroll in year t−2 and α is the degree of experience rating; α is 0
for small rms withWk(t−2) ≤Wt and 1 for large rms with Wk(t−2)≥Wt,and between
3The age variation in the DI tax rate reects the dierences in the disability risk and the benet levels across the age groups.
4A smoothed version of the multiplier (the dashed line in Figure 1) is used in our calculations. The reasons for this will be explained later in Section 6.
Figure 1: The experience multiplier in year t, m rk(t−2), rk(t−3)
, as a function of the
average of the risk ratios in yearst−2and t−3, 12 rk(t−2)+rk(t−3) Ϭ͘Ϭ Ϭ͘ϱ ϭ͘Ϭ ϭ͘ϱ Ϯ͘Ϭ Ϯ͘ϱ ϯ͘Ϭ ϯ͘ϱ ϰ͘Ϭ ϰ͘ϱ ϱ͘Ϭ ϱ͘ϱ ϲ͘Ϭ ŵ ½;ƌƚͲϮнƌƚͲϯͿ dƌƵĞǀĂůƵĞ ^ŵŽŽƚŚĞĚǀĞƌƐŝŽŶ
Wt and Wt it increases linearly from 0 to 1 withWk(t−2). The threshold values for small
and large rms are updated annually, and they correspond approximately to the rm sizes of 50 and 800 employees with the average salary.
The risk ratio is computed as
rkt= P
j∈Dktejt
Rkt
, (3)
where ejt is the present value of a (full or partial) disability pension awarded in year t,
andDkt denotes the set of individuals who worked for the rm one to two calendar years
prior to the year of the retirement event.5 The retirement event refers to the day when
the individual was diagnosed with the disability leading to the disability pension. Due to periods of sickness and rehabilitation benets, the retirement event is often one or two years before the disability pension is awarded. The present valueejt equals the expected
amount of disability pension benets until the age of 63, i.e. the age when an old-age pension begins. The numerator of the risk ratio is referred to as the realized disability cost, as it is a measure of the expected present value of the disability pension claims made by the rm's former employees during the yeart. The denominator Rkt is the theoretical
disability cost and it corresponds to the average disability costs in the rms with the same age and wage structure (see the Appendix). This means that if the new claims for disability pension in a rm cause higher than the average costs to the pension system,rkt>1, which
tend to push the experience multiplier above one with the delay of two to three years.
5If the individual had more than one employer during these two years, the contribution ofe
jtis divided between the employers according to the share of salaries they have paid during that two-year period.
It is noteworthy that the risk ratio only depends on the disability pension claims, not on the rehabilitation benet claims. This may induce the employer to encourage those employees with health problems to apply for a rehabilitation benet rather than for a disability pension. Another important point is that only the rst disability pension of each person is taken into account. In particular, if a worker collects a partial disability pension and this is followed by a full disability pension, only the present value of the partial pension has an eect on the rm's risk ratio in the year when that pension was awarded. To minimize the impacts on the risk ratio, the employer may thus encourage those workers who have health problems to apply for a partial disability pension rst (i.e. by providing part-time work for a short period of time). These two features of the risk ratio calculations suggest that the eect of the experience rating on the partial disability pension claims and on the rehabilitation benet claims is ambiguous. To the extent that experience rating leads to general improvements in the rm's health and safety policy, it should reduce the transitions to all types of disability benets. However, the experience rating may also increase the inow to partial disability pension as well as the rehabilitation benets in some cases through the substitution eects.
Experience rating may also aect the relative risk of becoming a disability pension recipient between the employees of dierent ages within large rms. This is because the eect of a new disability pension claim on the risk ratio is determined by the present value of the pension benets, which is larger for young claimants who still have many years before being eligible for old-age pensions. Thus, the employer has an incentive to devote extra eort to prevent its young employees from claiming disability pension benets.
3 TyEL reform and experience rating for former LEL
em-ployers
To estimate the eects of the experience rating, we exploit a pension reform that unied the private-sector Pension Acts in 2007. As a by-product of this reform, the experience rating of the DI premiums was extended to cover new groups of workers and their employers. Before the reform, all private-sector employees were covered either by the Employees' Pension Act (TEL), the Temporary Employee's Pensions Act (LEL), or by the Pension Act for Performing Artists and Certain Groups of Employees (TaEL). Whereas a vast majority of these employees were insured under the TEL, the LEL covered dock workers and blue-collar workers in the elds of construction, agriculture and forestry while the TaEL covered artists, journalists and those who worked for households. The employers paid the experience-rated DI premiums for their workers who were insured under the TEL.6 But 6The experience rating system changed in 2006 when the current system came into eect for the TEL workers. Before this reform, those rms employing more than 50 workers were required to pay a given share of the present value of a new disability benet claim as a lump sum payment to the pension provider at the time when the disability pension (or rehabilitation benet) was awarded to their former employee who was insured under the TEL. The medium-sized rms paid only a small share of this present value. However, in addition to the lump sum disability costs, they also paid the at-rate base premiums on an annual
for those workers insured under the LEL and the TaEL, the employers paid the at-rate base premiums. That is, the experience rating system was only applied to the employers of the TEL workers.
On January 1, 2007, these three pension Acts were unied into a single Employees Pensions Act (TyEL). While this reform did not aect the eligibility criteria or benet levels, i.e. the content of DI from the employees' perspective, it did extend the experience-rated DI premiums to also cover those worker groups who used to be insured under the LEL and the TaEL. As a consequence, the former LEL employers and TaEL employers whose payroll exceeded the threshold value ofWt became subject to experience rating for
the rst time, whereas the smaller employers continued to pay only the base premiums. This provides a dierence-in-dierences type of setting, which we exploit to identify the causal eects of experience rating. In what follows, we focus on the workers insured under the LEL and their employers.
In practice, due to specic rules for the transition period, the transition of the former LEL employers to the experience rating scheme occurred gradually over time. The guiding principle for the transitional provisions was that the present value of the new disability pension claim aects the risk ratio of the former LEL employer only to the extent the underlying employment relationship falls in the TyEL period. Since the present value is assigned to the rms in which the claimant worked one to two calendar years prior to the year of the retirement event, only disability pensions with the retirement event in the year 2008 or later have an eect on the risk ratio of the former employer. The costs of disability pensions that were awarded during the TyEL period but were not assigned to any particular employer are pooled, i.e. collectively covered by all the former LEL employers. To account for this pooling, the risk ratios of the former LEL employers in the transition period were adjusted by adding a calculatory term to the numerator. Namely, the adjusted risk ratio for rmkin year t≥2008 is computed as
rktA =
P
j∈Dktejt+Ekt
Rkt
, (4)
where ejt is accounted only to the extent that the underlying employment relationship
fell in the TyEL period, and Ekt is the calculatory term, which is positive in the years
2008-2010 (see the Appendix for details).
Figure 2 illustrates how the present value of a new disability pension claim ejt is
assigned to the former employers in dierent cases. For example, let us consider worker A who was awarded a disability pension in year 2008 due to an illness diagnosed in 2007 at the beginning of his or her sickness period. The year of the retirement event is 2007, suggesting that the present value would have aected the risk ratios of the rms for which she worked in the years 2006 and 2005 (i.e. rmk), had the TyEL been in force for a longer
basis. In other words, prior to 2006, there were no experience-rated DI premiums but the medium-sized and large rms paid lump sump payments for the disability benet claims made by their former employees insured under the TEL. Korkeamäki & Kyyrä (2012) discuss this old system and provide evidence for its behavioral eects.
Figure 2: Illustration of the allocation of disability pension costs for the former LEL employers ZĞƚŝƌĞŵĞŶƚĞǀĞŶƚ >>ͲƉĞƌŝŽĚ dLJ>ͲƉĞƌŝŽĚ ŚĂŶŐĞŝŶƌŝƐŬƌĂƚŝŽ tŽƌŬĞƌ͗ Ͳ tŽƌŬĞƌ͗ ϮϬϭϭ͕ϮϬϭϮ tŽƌŬĞƌ͗ ϮϬϭϮ͕ϮϬϭϯ tŽƌŬĞƌ͗ ϮϬϭϯ͕ϮϬϭϰ tŽƌŬĞƌ͗ ϮϬϭϭ͕ϮϬϭϮ ϮϬϬϰ ϮϬϬϱ ϮϬϬϲ ϮϬϬϳ ϮϬϬϴ ϮϬϬϵ ϮϬϭϬ ϮϬϭϭ ϮϬϭϮ ŵƉůŽLJĞĚ ŝŶĨŝƌŵŬ ^ŝĐŬŶĞƐƐďĞŶĞĨŝƚ &ƵůůĚŝƐĂďŝůŝƚLJƉĞŶƐŝŽŶ ŵƉůŽLJĞĚ ŝŶĨŝƌŵŬ ^ŝĐŬŶĞƐƐďĞŶĞĨŝƚ &ƵůůĚŝƐĂďŝůŝƚLJƉĞŶƐŝŽŶ ŵƉůŽLJĞĚ ŝŶĨŝƌŵŬ ŵƉůŽLJĞĚ ŝŶĨŝƌŵƐ ^ŝĐŬŶĞƐƐďĞŶĞĨŝƚ &ƵůůĚŝƐĂďŝůŝƚLJƉĞŶƐŝŽŶ ŵƉůŽLJĞĚ ŝŶĨŝƌŵŬ ^ŝĐŬŶĞƐƐ ZĞŚĂďŝůŝƚĂƚŝŽŶďĞŶĞĨŝƚ &ƵůůĚŝƐĂďŝůŝƚLJƉĞŶƐŝŽŶ ŵƉůŽLJĞĚ ŝŶĨŝƌŵŬ WĂƌƚŝĂů ĚŝƐĂďŝůŝƚLJ &ƵůůĚŝƐĂďŝůŝƚLJƉĞŶƐŝŽŶ zĞĂƌƐŽĨ ƉŽƐƐŝďůĞ ŝŶĐƌĞĂƐĞƐŝŶ ĚŝƐĂďŝůŝƚLJ ĐŽŶƚƌŝďƵƚŝŽŶƐ͗
time. But, as both 2005 and 2006 are LEL years, the present value is not assigned to her employer but is jointly covered by all the former LEL employers. Next, let us consider workers B and D who retired one year later from the same rm but with dierent sickness and rehabilitation benet proles. The year of the retirement event for both workers is 2008. Assuming they earned the same salary in the years 2006 and 2007, only one-half of the present values of their disability pensions (i.e. 2007 share) is accounted for when calculating the risk ratios for rmk.In the case of worker B (D) the risk ratio is aected
in the year 2009 (2011), which aects the experience-rated premium for the years 2011 and 2012 (2013 and 2014). A two-year period of rehabilitation benets for worker D causes a rather long gap of three years between the retirement event and the change in the risk ratio.
In general, only disability pensions with the retirement event in 2009 or later (workers C and E in Figure 2) have a full impact on the former employer's risk ratio. In the case of worker C the present value is split between rmskandsaccording to the wages these rms
paid to the worker in years 2007 and 2008. It is worth noting that the present value of worker E's disability pension is based on the assumption that a partial disability pension
would have lasted from 2009 until the time when the worker reaches the age of 63, so that only a (possibly very small) portion of the actual disability costs is assigned to rmkwhen
computing its risk ratio for the year 2009, whereas a transition to a full disability pension in 2011 has no eect at all.
It is obvious that the calculatory term dominates the numerator of the adjusted risk ratio in 2008. This is becauseej08>0 only if the retirement event was in the same year
when the disability pension was awarded, which is applicable to only 17% of the cases. Furthermore, the relative weight of the calculatory term declines gradually to zero by 2010.
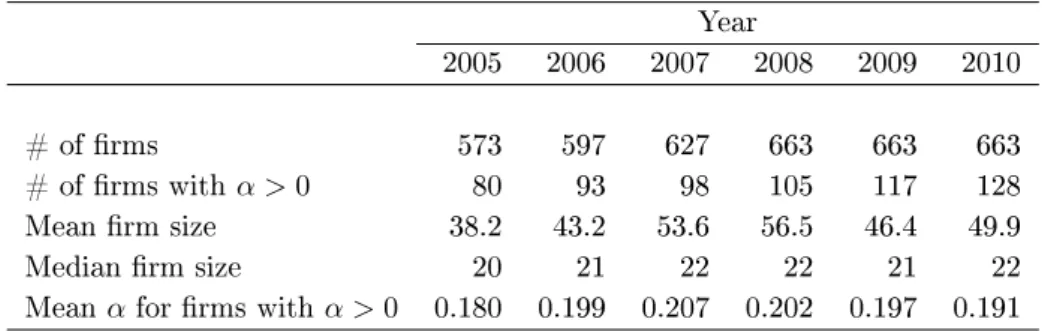
Table 1: Sample statistics for rm data Year 2005 2006 2007 2008 2009 2010 # of rms 573 597 627 663 663 663 # of rms withα >0 80 93 98 105 117 128 Mean rm size 38.2 43.2 53.6 56.5 46.4 49.9 Median rm size 20 21 22 22 21 22 Meanαfor rms withα >0 0.180 0.199 0.207 0.202 0.197 0.191
Notes: Firm size is the number of all employees, regardless of the pension Act under which they are insured.
4 Data and descriptive statistics
The data were compiled by merging various administrative registers of the Finnish Centre for Pensions, which co-ordinates the entire pension system in Finland. The data include comprehensive records on employment periods and the wages for all the Finns who had some work history, as well as the detailed pension information for all retirees. Each em-ployment relationship can also be matched to the rm records on the industry, payroll and the number of employees. However, apart from age, the data do not contain background information for individuals, nor is there information on the receipt of sickness benets. But we do observe the retirement events, that is, the days when a diagnosis was made for the illness or disability that eventually led to a rehabilitation benet or disability pension. This is important because the disability pension costs are assigned to the employers on the basis of the year of the retirement event.
Our analysis covers the period 2005-2010, but in order to compute the risk ratios and marginal costs, information is also needed from earlier years. First, we selected all workers insured under the LEL in 2005 and 2006. From the years 2007 to 2010, we included workers who would presumably have been insured under the LEL in the absence of the TyEL reform. Next, we traced the employers of these workers. The smallest employers were excluded by requiring that the rm employed at least 10 LEL workers each year during the period 2005-2010. For each rm in a given year we also need the payroll from two years earlier (to determine the value of α) as well as the information on the wages
and ages for its LEL employees over the past four-year period (to compute the risk ratios). Due to some missing records, the rms included in the analysis do not necessarily appear in the data each year.
The resulting panel includes 663 rms, of which 573 are continuously observed over the period 2005-2010. On average, these rms are rather small. The mean size of the workforce varies over time, ranging from 38 to 57 workers (Table 1). The median rm size, however, is much smaller, being around 21 workers every year. About one-sixth of the rms have positiveα, and thereby transferred gradually from the at-rate scheme to
the experience-rated scheme during the years 2007-2010. As these rms are by denition relatively large, a much larger share of the workers than the rms in the sample became
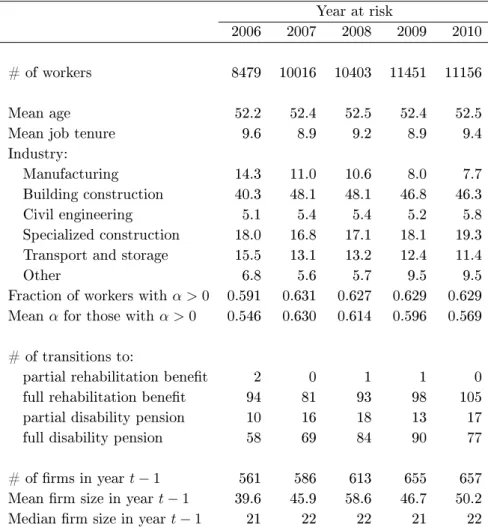
Table 2: Sample statistics for worker data
Year at risk
2006 2007 2008 2009 2010 # of workers 8479 10016 10403 11451 11156 Mean age 52.2 52.4 52.5 52.4 52.5 Mean job tenure 9.6 8.9 9.2 8.9 9.4 Industry:
Manufacturing 14.3 11.0 10.6 8.0 7.7 Building construction 40.3 48.1 48.1 46.8 46.3 Civil engineering 5.1 5.4 5.4 5.2 5.8 Specialized construction 18.0 16.8 17.1 18.1 19.3 Transport and storage 15.5 13.1 13.2 12.4 11.4 Other 6.8 5.6 5.7 9.5 9.5 Fraction of workers withα >0 0.591 0.631 0.627 0.629 0.629 Meanαfor those withα >0 0.546 0.630 0.614 0.596 0.569 # of transitions to:
partial rehabilitation benet 2 0 1 1 0 full rehabilitation benet 94 81 93 98 105 partial disability pension 10 16 18 13 17 full disability pension 58 69 84 90 77 # of rms in yeart−1 561 586 613 655 657 Mean rm size in yeart−1 39.6 45.9 58.6 46.7 50.2 Median rm size in yeart−1 21 22 22 21 22
Notes: Firm characteristics are for the rm for which the individual worked for the two years prior to the present year. Firm size is the number of all employees, regardless of the pension Act under which they are insured.
exposed to experience rating after the TyEL reform (over 60%, see Table 2).
In the individual-level analysis we focus on an older subgroup of LEL workers who fulll certain conditions. To be included in the risk set in yeart∈ {2006,2007, ...,2010},
we require that the individual (i) was between the ages of 45 and 61, (ii) had not received any pension benets before the yeart, and (iii) had been working during the years t−1
andt−2(or in the TyEL period would have been working) under the LEL scheme for the
same employer that was included in the rm panel. The younger workers are excluded from the analysis due to their very small risk of disability. The tenure restriction is required in order to detect employer whose risk ratio will be aected if a disability pension is awarded to the worker. It is noteworthy that the individual at risk in yeart does not necessarily
work during that year (for example, due to a sick leave or layo).
The worker data include 18,197 individuals in 661 rms. The average age of the worker at risk is slightly higher than 52 years each year (see Table 2). On average, the workers had worked at their current rms for 9 to 10 years. Approximately two-thirds of these
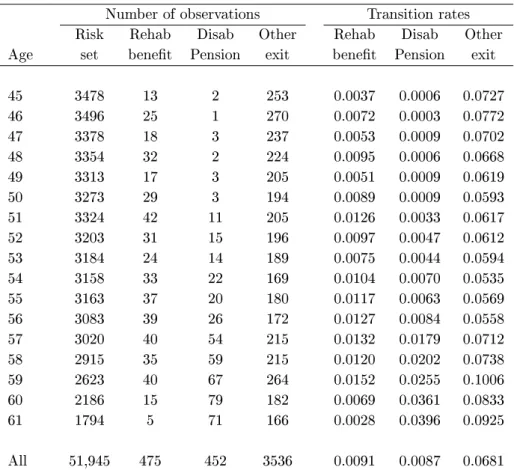
Table 3: Risk set and transitions out of work by age
Number of observations Transition rates Risk Rehab Disab Other Rehab Disab Other Age set benet Pension exit benet Pension exit 45 3478 13 2 253 0.0037 0.0006 0.0727 46 3496 25 1 270 0.0072 0.0003 0.0772 47 3378 18 3 237 0.0053 0.0009 0.0702 48 3354 32 2 224 0.0095 0.0006 0.0668 49 3313 17 3 205 0.0051 0.0009 0.0619 50 3273 29 3 194 0.0089 0.0009 0.0593 51 3324 42 11 205 0.0126 0.0033 0.0617 52 3203 31 15 196 0.0097 0.0047 0.0612 53 3184 24 14 189 0.0075 0.0044 0.0594 54 3158 33 22 169 0.0104 0.0070 0.0535 55 3163 37 20 180 0.0117 0.0063 0.0569 56 3083 39 26 172 0.0127 0.0084 0.0558 57 3020 40 54 215 0.0132 0.0179 0.0712 58 2915 35 59 215 0.0120 0.0202 0.0738 59 2623 40 67 264 0.0152 0.0255 0.1006 60 2186 15 79 182 0.0069 0.0361 0.0833 61 1794 5 71 166 0.0028 0.0396 0.0925 All 51,945 475 452 3536 0.0091 0.0087 0.0681
Notes: The risk set consists of all individuals who worked in the same rm for the past two calender years. Other exits include transitions to all other destinations than disability benets. Transition rates are obtained by dividing the number of transitions to the state into question by the number of individuals in the risk set.
workers were employed in one of three construction industries, and thus the data represent only a narrow sector of the economy. Over 60% of the individuals were employed in a rm withα > 0 and consequently, they were aected by the experience rating system during
the TyEL period. Furthermore, the average degree of experience rating within this group varies between 0.57 and 0.63 during the TyEL years.
By the end of the observation period, 927 workers had left the labor market to collect disability benets. Most of these workers were awarded a full disability pension. The numbers of the recipients of partial benets is relatively small: 74 workers were awarded a partial disability pension and only 4 were awarded a partial rehabilitation benet. This makes a distinct analysis of the transitions to partial benets infeasible, and for this reason we do not usually make a distinction between those receiving partial and those receiving full benets.
Table 3 shows the size of the risk set and the number of transitions to the dierent exit destinations as well as the corresponding transition rates by age. Not surprisingly, the number of people at risk declines sharply with age. Only a small part of that decline can be explained by transitions to disability benets. While the average transition rates
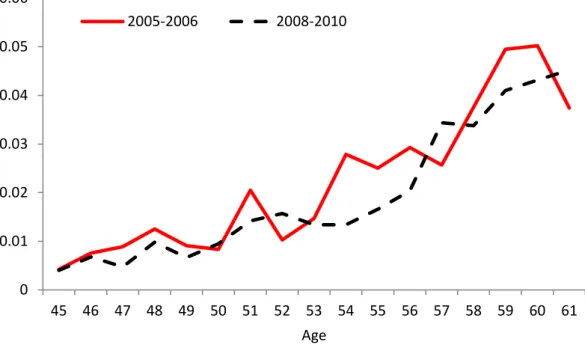
Figure 3: The transition rate to disability benets (rehabilitation benet or disability pension) as a function of age in the pre-reform and post-reform periods
Ϭ Ϭ͘Ϭϭ Ϭ͘ϬϮ Ϭ͘Ϭϯ Ϭ͘Ϭϰ Ϭ͘Ϭϱ Ϭ͘Ϭϲ ϰϱ ϰϲ ϰϳ ϰϴ ϰϵ ϱϬ ϱϭ ϱϮ ϱϯ ϱϰ ϱϱ ϱϲ ϱϳ ϱϴ ϱϵ ϲϬ ϲϭ ŐĞ ϮϬϬϱͲϮϬϬϲ ϮϬϬϴͲϮϬϭϬ
to rehabilitation benets and disability pension are of the same level, being about 0.009, the age pattern is rather dierent. Workers who are 56 years and under are much more likely to be granted a rehabilitation benet than a disability pension, whereas the opposite occurs for the older age group, which is more likely to be granted a disability pension, not a rehabilitation benet. The likelihood of becoming a disability pension recipient is particularly pronounced at ages 60 and 61. These observations are not surprising, given that the cost-benet analysis of rehabilitation measures favors the younger workers who have a longer potential working career.
The other exit refers to the case where the individual left the rm without becoming a recipient of disability benets. This outcome is a kind of residual state, which includes layos, employer changes and all states outside the labor force other than being on disability benets. On average, 7% of workers leave their rm each year without claiming disability benets. This rate varies less with age than does the transition rates to the disability benets.
Figure 3 plots the overall transition rate to disability benets as a function of age for the years 2005-2006 (pre-reform period) and 2008-2010 (post-reform period). The year 2007 is excluded, which was the rst TyEL year but that particular year was when the experience rating did not yet have an eect. In both periods, the disability risk is rst very low but increases with age, reaching the level of about 0.04 by age 60. Compared to the pre-reform period, the disability risk in the post-reform period is similar until the age of 53 years, but is slightly lower at older ages (except at ages 57 and 61). As a result, the average disability risk declined from 0.021 to 0.018 between the pre-reform and post-reform
periods. This decline is not necessarily related to the adoption of experience rating because the overall disability risk has been declining since 2003.
5 Risk ratios and disability inow rates
The risk ratios measure the relative costs of the disability pension claims accounting for dierences in the age structure of the workforce between rms. The risk ratios also de-termine the experience-rated premiums during the TyEL period, and hence should be of direct economic interest for the rms that were aected by the reform. The TyEL reform in 2007 may have encouraged large rms to adopt measures to reduce their risk ratios in order to gain from a lower DI premium in the future. Since the reform did not aect the incentives of the small rms that kept on paying at-rate base premiums, the risk ratios of the large rms should have declined in comparison to those of the unaected small rms. Moreover, as the nancial gain from a lower risk ratio is positively related to the degree to which the DI premium is experience-rated in the TyEL period (as measured byα), the
relative drop in the risk ratio among the larger rms is expected to be proportional to the rm'sα.7
These hypotheses are tested by applying the following two-period model:
rkt=ψ+λ·t+η·W¯kt+µ·Xkt+θ·( ¯αkt·t) +εkt, (5)
wherekindexes the rm and tindexes the time period, being 0 for the LEL-period
2005-2006 and 1 for the TyEL-period 2008-2010 (excluding the rst TyEL year of 2007 when the experience rating had no eect yet). The outcome variablerkt is the average unadjusted
risk ratio during a periodt,8 which is a measure of the relative disability pension costs that
were caused to the pension system by the rm's former employees. On the right-hand side,
Xktis the vector of industry dummies,W¯ktis the average payroll,α¯ktis the average degree
of experience rating during periodt, and εkt is the error term. Because α¯kt is a function
of the payroll, and because the rm size (for whichW¯kt is a proxy) may also have a direct
eect on the disability outcomes, it is important that the possible payroll eect is controlled for. WithW¯ktheld constant, the eect of the experience rating is captured byθ. Sinceα¯kt
does not occur during the period 0, the eects ofW¯kt and α¯kt are easily sorted out. The
change in the average risk ratio from period 0 to period 1 that is unrelated to experience rating is captured by λ, which is identied from the data on the small rms for which
7Comparing the changes in the risk ratios may seem odd because the risk ratio is a relative measure. However, the reference level of disability pension costs, i.e. the theoretical disability cost in the risk ratio formula, describes the average disability pension cost across all similar rms in the private sector. Because the former LEL employers are a relatively small group, this reference level is mainly determined by disability outcomes in other rms.
8The unadjusted risk ratio refers to the risk ratio that has been computed as if the TyEL would have been in force for a long time. That is, we do not include the calculatory term in the risk ratio but instead also assign the realized disability costs that are associated with the employment relationships that occurred during the LEL period to the employer. Due to some outliers for a few small rms, the year-specic risk ratios were top coded at the 99th percentile.
Figure 4: The change in the average unadjusted risk ratio from 2005-2006 to 2008-2010,
rk1−rk0, (y-axis) versus the average degree of experience rating,α¯k1, (x-axis).
-4 0 -2 0 0 2 0 4 0 c h a n g e i n t h e r is k r a ti o 0 .2 .4 .6 .8 1
average degree of experience rating
¯
αkt= 0in both periods. Under the plausible assumption thatα¯ktis uncorrelated with the
error term, the Ordinary Least Squares (OLS) estimate ofθ has a causal interpretation.
Before turning to the regression results, it is illustrative to consider the scatter plot in Figure 4 that depictsα¯k1againstrk1−rk0.9The change in the average risk ratio is strikingly
large for several small rms withα¯k1 = 0. This is because the small rms generally have
a much wider range of the risk ratios than the large rms do. It is dicult to detect any relationship between the change in the risk ratio and the degree of experience rating in the graph. In particular, we do not see a negative association between these variables that would support our hypothesis. The OLS estimates ofθin Table 4 conrm this observation.
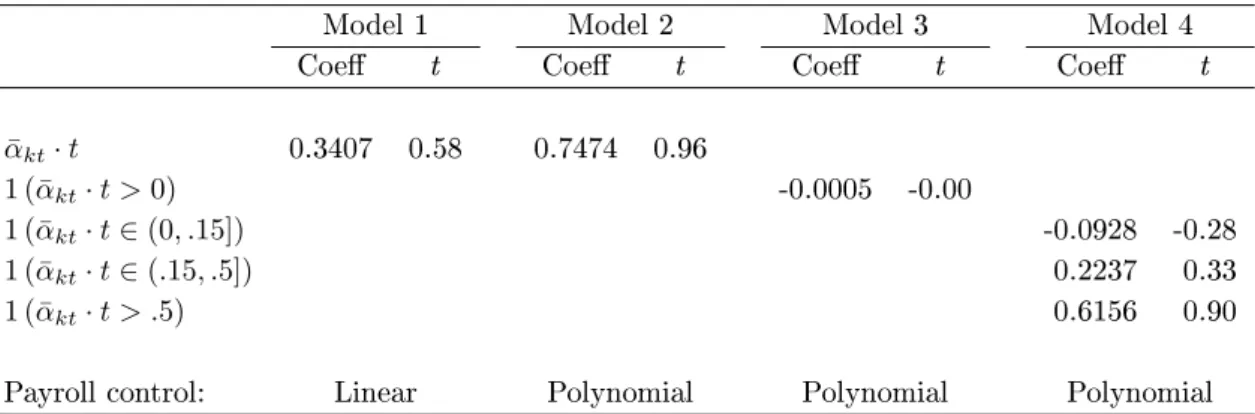
Model 1 corresponds to the baseline specication in (5). This is followed by a model with a more exible specication of the rm-size eect (the 3rd order polynomial for the payroll). The eect of experience rating in both models is statistically insignicant (with a wrong sign). In the last two models we relax the restriction that the change in the risk ratio among the large rms is linearly related to the degree of experience rating. The coecient on the dummy variable for the experience-rated rms in Model 3 suggests that the risk ratios changed identically in both those rms that became subject to experience rating and in those rms that were not aected by the TyEL reform. In Model 4, a non-monotone eect for the degree of the experience rating is allowed for by using dummy
9For expositional purposes, the graph does not include those four small rms withα¯
k1 = 0 for which the absolute change in the average risk ratio is greater than 50.
Table 4: The eect of the degree of experience rating on the average unadjusted risk ratio
Model 1 Model 2 Model 3 Model 4 Coe t Coe t Coe t Coe t ¯ αkt·t 0.3407 0.58 0.7474 0.96 1 ( ¯αkt·t >0) -0.0005 -0.00 1 ( ¯αkt·t∈(0, .15]) -0.0928 -0.28 1 ( ¯αkt·t∈(.15, .5]) 0.2237 0.33 1 ( ¯αkt·t > .5) 0.6156 0.90
Payroll control: Linear Polynomial Polynomial Polynomial Notes: Models were estimated by Ordinary Least Squares. The data contains 1146 observations on 573 rms. 1 (A)is 1 ifAis true and 0 otherwise. All models include industry dummies. Model 1 also includes
the payroll, whereas Models 2 to 4 include the 3rd order polynomial for payroll. The t statistics are based on the robust standard errors clustered at the rm level.
variables for the three distinct intervals ofα¯k1 (these intervals were chosen on the basis of
the number of the available observations). The coecients on these dummy variables do not exhibit a clear pattern, nor do they dier from zero at the conventional risk levels.
None of the models that were considered provides support for the hypothesis that the realized disability costs in the TyEL period would have declined in the rms that were exposed to experience rating as compared to the non-aected rms.10 However, the
changes in the risk ratios may not reveal the whole story. This is because the risk ratio reects only the disability pension costs, but the experience rating may also aect the rehabilitation benet claims. For these reasons, to complete our analysis, we also examine the relationship between the degree of experience rating and the inow rates of older workers to dierent disability benets.
The dependent variable here is the share of 45 to 61 years old workers who were awarded a given type of disability benet. We include only those rms that employed at least ve workers in the relevant age category each year, even though the results are not sensitive to this restriction. The outcome variable is bounded between zero and one, and its distribution has a mass point at zero. To address with these data features, we follow Papke & Wooldridge (1996) and specify a fractional logit model of the form
E y¯kt W¯kt,Xkt,α¯kt, t = Λ ψ+λ·t+η·W¯kt+µ·Xkt+θ·( ¯αkt·t) , (6)
wherey¯ktis the average annual inow rate in period t(the years 2005-2006 or 2008-2010)
and Λ(z) ≡ exp(z)/[1−exp(z)] is the logistic function. The annual inow rate equals
the fraction of the older employees who were awarded a certain type of disability benet (disability pension or rehabilitation benet). To be included in the rm's risk set in a given year, the worker had to be employed by the rm for the past two calender years (but not necessarily during the current year). This denition allows a one-year sickness benet
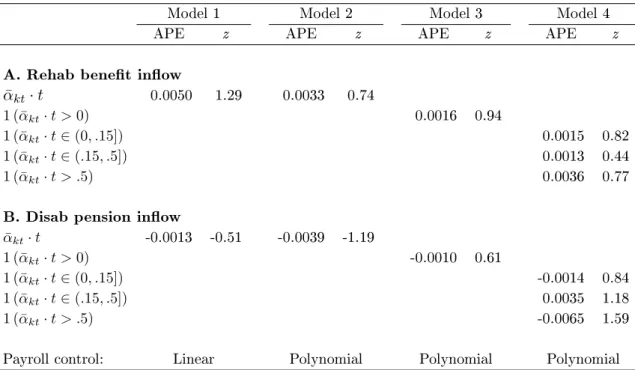
Table 5: The average partial eect of the degree of experience rating on the average inow rates to rehabilitation benets and disability pension
Model 1 Model 2 Model 3 Model 4 APE z APE z APE z APE z A. Rehab benet inow
¯ αkt·t 0.0050 1.29 0.0033 0.74 1 ( ¯αkt·t >0) 0.0016 0.94 1 ( ¯αkt·t∈(0, .15]) 0.0015 0.82 1 ( ¯αkt·t∈(.15, .5]) 0.0013 0.44 1 ( ¯αkt·t > .5) 0.0036 0.77
B. Disab pension inow ¯ αkt·t -0.0013 -0.51 -0.0039 -1.19 1 ( ¯αkt·t >0) -0.0010 0.61 1 ( ¯αkt·t∈(0, .15]) -0.0014 0.84 1 ( ¯αkt·t∈(.15, .5]) 0.0035 1.18 1 ( ¯αkt·t > .5) -0.0065 1.59
Payroll control: Linear Polynomial Polynomial Polynomial Notes: The models were estimated by maximizing the Bernoulli quasi-likelihood function. The sample includes 664 observations on 332 rms employing at least 5 workers aged 45-61 in each year between 2005 and 2010. 1 (A)is 1 if Ais true and 0 otherwise. All models include industry dummies and the average
age of the employees between age 45 and 61. Model 1 also includes the payroll, whereas Models 2 to 4 include the 3rd order polynomial for payroll. Reported estimates are average partial eects (APEs) or average marginal eects. In Model 1 the APE is the partial derivative of the expected inow rate, averaged across rms subject to experience rating in period 1. In Models 2, 3 and 4 the APE is the dierence in the expected inow rate compared to the case of no experience rating, averaged across rms subject to experience rating in period 1. The z statistics are based on the robust standard errors clustered at the rm level.
period between the worker's exit from work and his or her receipt of a disability benet. Here Xkt does not only include the industry dummies, but also the average age of the
rm's relevant workforce (i.e. employees aged 45 to 61 with at least two years of tenure). We estimate the model by maximizing the Bernoulli quasi-likelihood function. The resulting estimator is consistent regardless of the conditional distribution of y¯kt. That is,
we only specify the conditional expectation but leave the conditional distribution of the outcome variable unspecied. Apart from the logit transformationΛ(·)and one additional
control variable, the modeling setting and the considered specications are similar to the linear risk ratio models that were discussed above.
The results are shown in Table 5. We only report the average partial eect (APE) of the experience rating variable, which is dened as the eect on the expected value of
¯
ykt averaged across the rms subject to experience rating during period 1. That is, we
consider the average eect of the experience rating on the disability inow during the TyEL period among the rms that became exposed to experience rating. When interpreting the
estimates, one should note that the average inow rates are rather low. For example, during the TyEL period, these are approximately 0.008 and 0.010 for rehabilitation and disability pension benets, respectively.
Panel A shows the eects on the rehabilitation benet claims. These eects appear to be positive in all the model specications, but none of them is statistically signicant. The eects on the disability pension inow (Panel B) are negative except for the rms with 0.15 < α¯k1 ≤ 0.5 in the last specication, but they do not dier from zero at the
conventional risk levels. These results are not sensitive with respect to our decision to combine partial benets and full benets. The distinct models for the inows into partial and full benets also did not produce signicant eects (not reported here). We thus conclude that the disability inow rates of the older employees in the TyEL period did not change dierently in the rms that became subject to experience rating and in those smaller rms that were not aected by the reform.
6 Marginal costs of disability pension claims
In this section, we examine the economic incentives at the employer-employee level. We dene the marginal cost of a new disability pension claim as the expected increase in the employer's future DI premium. This can be computed for each worker who is at the risk of becoming disabled. The marginal cost measures the cost of a new disability pension claimant to his or her former employer, and how this cost varies across workers and rms. The distribution of these costs is of obvious interest. In addition, the marginal costs provide an alternative way to examine the potential eects of experience rating. Using the marginal cost as a regressor in various probability models, we test whether the disability cost risk explains job tenure and the transitions from work to disability benets.
6.1 Computing marginal costs
Let us assume that a disability pension is awarded in yeart≥2008to workerjwho worked
in rmk. The marginal cost of this event to the former employer is cjkt=Et
h
δ2(Ckj(t+2)−Ck(t+2)) +δ3(Ckj(t+3)−Ck(t+3)) i
, (7)
where δ is the annual discount factor, Cjks is the DI premium in year s given that the
pension was awarded to workerj in year t, and Cks is the counterfactual premium, had
the worker continued to work without receiving disability benets until the end of year
t+ 3. At the beginning of year t, the employer does not know the future values of the
components of the DI premium formula, which explains the expectation operator in (7). Let us further assume that the employer knows all the historical values, and uses the latest realized values of the payroll and base premium, Wk(t−1) and Qk(t−1), to predict their
their expected values, we nd that cjkt = α(Wk(t−1))Qk(t−1) δ2hmˆrktA+4rˆktAj, rkA(t−1)−mˆrktA, rAk(t−1)i +δ3 h m ˆ rAk(t+1),rˆAkt+4ˆrAjkt −m ˆ rAk(t+1),rˆAkt i , (8)
whererˆktA andrˆAk(t+1) are the expected counterfactual risk ratios, had the worker continued
to work until the end of yeart+ 3,and 4rˆAjkt is the expected change in the risk ratio that
would result from worker j's disability pension claim in year t.11 In what follows, we set δ= 1/1.03but compute all the other parameters in (8) from the data. Here we discuss the
most important aspects of these computation. The details are provided in the Appendix. It is evident that the key parameter is the expected change in the risk ratio, 4rˆktAj.
A disability pension awarded in year t may or may not increase the numerator of the
employer's risk ratio in that year, depending on the year of the retirement event (the year when the disabling illness was diagnosed). If the year of the retirement event is 2009 or later, the expected increase in the numerator equals eˆjt, the expected present value of
disability pension benets until the age of 63. If the year of the retirement event is 2008, only a part ofeˆjt (we assume one-half) is accounted for when determining the employer's
risk ratio. And if the year of the retirement event is 2007 or earlier, the disability event has no eect on the employer's risk ratio. We estimateeˆjt using data on the disability pension
benets of the workers who retired at dierent ages. Note that the year of the retirement event is a latent variable as it is only observed if the disability pension was actually awarded in yeart. However, we need to computecjkt for all the individuals. To address this issue,
we assume that with a certain probability the impact of a new disability pension on the risk ratio is only partial (corresponding the case when the year of the retirement event is 2008) or non-existent (the case when the retirement event is before the year 2008). We estimate these probabilities using the observed dierences in the years of the retirement event and the pension receipt among those who were awarded a disability pension. Let
ˆ
φt denote the probability thateˆjt is assigned to the former employer (taking into account
the case when only one-half of ˆejt is assigned to the employer) if a disability pension is
awarded to workerj in yeart. Now, we can write
4rˆktAj= ˆ φteˆjt ˆ Rkt , (9)
whereRˆkt is the expected theoretical disability cost andφˆtˆejt is the expected realized cost
of a new disability pension. The expected change in the risk ratio decreases with age (as
ˆ
ejt decreases with age) and rm size (as Rˆkt increases with rm size), and increases with
11We assume that the disability pension awarded to worker j in year t does not aect ˆrAk(t+1). In principle, it may have an eect through a change in the age and wage structure of the workforce aecting the theoretical disability cost and calculatory term (see the formula in the Appendix). Nonetheless, such an eect is negligible for large rms, while it is of no consequence for the smaller rms that are not subject to a notable degree of experience rating.
time (asφˆtincreases witht).
It is not obvious what we should assume about the expected counterfactual risk ratios,
ˆ
rAktandˆrAk(t+1). The latest realized value,rAk(t−1),would be a problematic choice. It ignores
the gradually diminishing role of the calculatory term in the risk ratio formula, and it would be a particularly poor predictor for relatively small rms because disability events among their employees are rare and their risk ratios are volatile. The risk ratio in the small rm soars at a high level in the year when the disability pension is awarded, but usually declines in the next year. Instead of using the latest realized value, we use the collective risk ratio of all LEL employers (the average risk ratio computed by the pension provider), which we then adjust for the transitional provisions.12 The resulting estimates
ofrˆAktand rˆAk(t+1) are independent of the rm's own disability experience, which enhances
the identication of the causal eects of the marginal costs in the econometric analysis. We have computed two versions of the marginal costs using dierent versions of the experience multiplier m.The rst is based on the step-function version of the experience
multiplier (the solid line in Figure 1), while the second is based on the smoothed function (the dashed line). In the former case, the marginal cost is often zero for the employees of large rms, as the impact of a new pension claim on the risk ratio, 4rˆAjkt, is typically
too low to raise m. This feature is problematic and unrealistic for two reasons. First, a
disability pension for one worker increases the probability that the next disability event in the same year will increase m. The rational employer should take this into account.
Second, the employer does not know the relevant risk ratios.13 The employer probably
knows the current value ofm and perhaps its determinants rk(t−2) and rk(t−3),but does
not know the risk ratios that determine the value ofmin years t+ 2and t+ 3. Therefore
the employer cannot accurately assess whether or not a new pension claim made by a given worker this year will increase the futurem. Due to this uncertainty about the number of
new disability pension claims within the year and about the future values of the risk ratios, the employers should worry each possible disability case and this should also be reected in our incentive measure.
Additional problem that arises with the step-function version ofmis that the marginal
costs become very sensitive with respect to the assumed values of rˆAkt and rˆAk(t+1). To
illustrate this, let us consider a large rm, so that4rˆktAj is very small for all its
employ-ees. Now, suppose that the average of ˆrA
kt and ˆrAk(t+1) (or that of ˆrAkt and rkA(t−1)) is only
marginally below the threshold value after which mrises to the next level. In this case, a
new disability pension claim, despite its modest eect on the risk ratio, invariably raisesm,
resulting in high marginal costs for all employees of the rm (as the eect of the increase inm is proportional to the payroll). However, with slightly dierent values assumed for
ˆ
rAkt and rˆkA(t+1), this situation may not happen in which case the marginal cost is zero for 12Another alternative was considered where the counterfactual risk ratios are based on the rm's own three-year disability history. However, the results were not altered when these counterfactual risk ratios were used.
13The employer may ask the past values of its risk ratios from the pension provider. However, the marginal cost depends on the future risk ratios, which are not yet dened at the beginning of yeart.
all these employees. Because there are no obvious values for these risk ratios, the marginal costs based on the step-function version ofm are essentially arbitrary.
For these reasons we prefer the smoothed version ofmto the step-function version. The
use of the smoothed version provides a less extreme alternative by placing positive values for many otherwise zero marginal costs and by cutting extremely high values of marginal costs. A major advantage of this approach is that the marginal costs are not sensitive with respect to the assumed values of ˆrktA and rˆkA(t+1). In fact, the only role of these risk ratios
is to restrict the value of m to the interval [0.1,5.5], which boundaries are rarely binding
for large rms. It follows that the marginal cost is determined primarily by a worker's age, rm size and time period. By using the smoothed version of m, we mimic the situation
in which the employer knows its currentmand the likely increase in the risk ratio,4rˆktAj,
but is uncertain of the counterfactual risk ratios and hence the distance to the threshold value for the next level ofm. In the subsequent analysis, we report only the results for the
marginal costs that are based on the smoothed version ofm.
6.2 Descriptive evidence
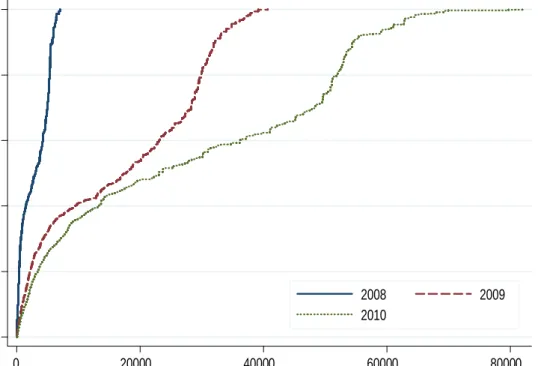
Figure 5 shows the cumulative distribution function of marginal costs for the employees of experience-rated rms during the last three years of the observation period (before 2008 the marginal costs are zero by construction). In 2008, there are no considerably high values, and the mass of the marginal costs are close to zero. This was expected since a disability pension awarded in 2008 aects the employer's risk ratio only if the retirement event occurred in the same year, which probability is about 0.17. Even in that case, the eect is relatively small because one-half of the present value of the disability cost is ignored and pooled among all the employers. In the next two years, both the average level and the dispersion of the marginal costs increase, and in many cases the marginal costs are of considerable size.
Figure 6 depicts the average marginal cost by age and α category in 2010 when the
transitional provisions no longer played a role anymore but when the employers' risk ratios were solely determined by their own disability expenditures. Not surprisingly, the average costs are rather low in relatively small rms with0< α≤0.25.The average level is almost
threefold for the next size group with0.25< α≤0.5, but it is considerably higher for the
two largest groups. Furthermore, the average marginal costs of workers around age 50 in the rms withα >0.5are comparable in size to the annual salary. In all cases, the average
marginal cost begins to decline near the age of 54.14
Overall, there is considerable variation in the marginal costs across individuals and rms at least during the years 2009 and 2010. Often these marginal costs are also rather high, which is why the employers should respond to experience rating. Yet no evidence of such behavioral eects were found in the analysis of the risk ratios and the inow rates in Section 5. In the following subsection, we estimate the eect of the marginal
14This is due to the age patterns of the benet level and multiplierγ, which jointly determine the present value of a new pension claim (see the Appendix).
Figure 5: The cumulative distribution function of the marginal costs for the employees of rms withα >0in the years 2008, 2009 and 2010
0 .2 .4 .6 .8 1 0 20000 40000 60000 80000 2008 2009 2010
Figure 6: Average marginal cost (¿1000) as a function of age byα group in the year 2010
Ϭ ϭϬ ϮϬ ϯϬ ϰϬ ϱϬ ϲϬ ϳϬ ϴϬ ϰϱ ϰϲ ϰϳ ϰϴ ϰϵ ϱϬ ϱϭ ϱϮ ϱϯ ϱϰ ϱϱ ϱϲ ϱϳ ϱϴ ϱϵ ϲϬ ϲϭ ŐĞ ϬфɲчϬ͘Ϯϱ Ϭ͘ϮϱфɲчϬ͘ϱ Ϭ͘ϱфɲфϭ ɲсϭ
cost on the transition rates out of work to dierent exit destinations. The larger number of observations and within-rm variation in the cost measure allow us to estimate more accurately the eects of the experience rating than is possible in the rm-level analysis. With the individual-level data, we can also examine whether the eect of experience rating varies with age and job tenure.
6.3 Eects of marginal costs
Consider a worker who has worked in a given rm for the past two calendar years. In the current year, the worker may still be employed in the same rm, may have stopped working due to a disability, in which case he or she receives either rehabilitation or disability pension benets,15 or this worker may have left the rm without becoming a disability benet
recipient. To test whether experience rating aects these outcomes, we apply a standard logistic regression. Specically, we estimate a number of the binary logit models of the form ln p s jkt 1−psjkt ! =λt+µ·Xjkt+θ·cjkt, (10)
wherepsjkt is the probability that worker j occupies state sin yeart, given that he or she
worked in rm k in years t−1 and t−2. The vector of control variables Xjkt includes
the worker's age xjt, lagged payroll Wk(t−1), job tenure and the industry dummies. The
variable of primary interest is the marginal cost, cjkt, which we dened above. In some
models, we also add interactions ofcjkt with the age and job tenure.
The marginal cost varies along with a number of dimensions. To make this explicit we write
cjkt =gt xjt, Wk(t−1), Qk(t−1), Qk(t−2), Qk(t−3);Ωt
,
where Ωt denotes the set of the pension system parameters and ˆejt. The marginal cost
is a function of worker's age (through the expected present value of a disability pension
ˆ
ejt), the lagged payroll (throughα) and the lagged base premiums (through the expected
calculatory term and theoretical costs), all of which vary over time. In addition, the underlying technical parameters Ωt change annually. However, the most signicant point
is thatgt(·)changes over time, which indicates that the mapping of the inputs of gt(·)into
the marginal cost changes over time. This occurs due to the gradual implementation of experience rating, which is captured by the increasing probability of employer's liability for the costs of a new disability pension (i.e. φˆt and φˆt+1) and by the diminishing role of
the calculatory term in the risk ratio formula. It should be emphasized that, apart from the worker's age and the lagged payroll (if interpreted as a proxy for rm size), the inputs ofgt(·) cannot have a direct eect on the outcome probability.
Becausecjkt only depends on the worker's age, rm characteristics, system parameters
15Due to the small numbers of transitions to partial benets, we do not make a distinction between full and partial rehabilitation benets, nor do we dierentiate between full and partial disability pension benets. Our results are not sensitive with respect to this.
and time, it is independent of unobserved individual characteristics such as health and preferences for work. We should not be concerned about unobserved rm characteristics either. As the collective risk ratio of the LEL employers was used for the expected coun-terfactual risk ratios, cjkt is independent of rm-specic shocks that aect the rm's past
and current disability inow. Conditional on the age and lagged payroll, the variation in
cjkt stems from the gradual implementation of experience rating, i.e. changes ingt(·),and
to some extent from changes in the lagged base premiums and from the changes in the technical parameters over time. Since these sources of variation are exogenous from the perspectives of both the employer and employee, we can estimate the causal eect ofcjkt
from the model (10).
Using the data pooled over the years 2006-2010, we have estimated several model variants. For the sake of brevity, we focus on the eects of the marginal cost, which are reported in Table 6. In addition to the coecients oncjkt and its possible interactions, we
report the average partial eect (APE), which is dened as the average eect ofcjktonpsjkt
(accounting for the possible interactions with age and/or job tenure) across the employees of rms with α > 0 in 2010. This gives the average response after the transition period
on workers whose employers were subject to experience rating. The reported z statistics are based on the robust standard errors accounting for heteroscedasticity and cross-section dependence within rms.16
The results in Panel A are from the baseline specication that is outlined in (10). These estimates indicate no eect on the probability of being awarded a disability benet because the APE on the receipt of both types of disability benets is zero up to the third decimal place. On the other hand, the eects on the probability of continuing to work in the current rm and on that of other exits are statistically signicant at the 5% and 10% levels, respectively. These imply that an increase of ¿10,000 in the marginal costs among all the employees whose employers were subject to experience rating in 2010 would raise the average exit rate out of work for reasons other than disability by 0.005. This means a less than 10% increase in the exit probability for the average worker (see Table 3). This would also reduce the average probability of remaining employed in the current rm for one additional year by 0.006. This is a very small eect in relative terms because the average probability of remaining employed in the current rm is as high as 0.93.
In Panels B, C and D, we allow the eect of the marginal cost to change with age and/or job tenure. Adding these interactions does not change the average eect on the disability benet claims as the APE remains robustly zero for both types of benets. However, the age interaction on the probability of claiming a rehabilitation benet is signicant at the 10% level (Panels B and D), indicating that experience rating may have some positive eect
16For the corresponding linear probability models, we computed one-way clustered (i.e. clustering on rm or individual) and two-way clustered (i.e. clustering on both rm and individual) covariance-variance matrices using the method by Cameron et al. (2011). Comparison of these estimates suggested that ignor-ing the cross-sectional dependence in the unobservables would lead to clearly downward-biased standard errors. By contrast, we found no evidence of signicant time-dependence in the unobservables for the same individual. Thus it suces to cluster the standard errors at the rm level.
Table 6: The eects of marginal costs in logit models
Outcome:
Stay employed Rehab benet Disab pension Other exit Estimate z-value Estimate z-value Estimate z-value Estimate z-value A. Baseline model MC -0.0629** -2.11 0.0295 0.77 0.0012 0.02 0.0629* 1.85 APE -0.0062** -2.02 0.0003 0.77 0.0000 0.02 0.0053* 1.79 B. Age interaction MC -0.0407 -1.07 0.0771 1.52 0.0031 0.05 0.0426 0.90 MC×(Age - 55) 0.0043 1.19 0.0132* 1.68 0.0112 0.61 -0.0037 -1.07 APE -0.0049 -1.45 0.0006 1.25 0.0003 0.36 0.0044 1.25 C. Tenure interaction MC -0.0490* -1.76 0.0275 0.72 0.0017 0.03 0.0458 1.30 MC×(Tenure - 8) 0.0089** 1.97 0.0041 1.19 -0.0010 -0.19 -0.0089* -1.90 APE -0.0056** -2.19 0.0003 0.84 0.0000 0.00 0.0049* 1.86 D. Age and tenure interactions
MC -0.0330 -0.90 0.0746 1.45 0.0036 0.06 0.0316 0.67 MC×(Age - 55) 0.0032 1.03 0.0131* 1.65 0.0112 0.61 -0.0027 -0.87 MC×(Tenure - 8) 0.0086** 2.00 0.0040 1.14 -0.0009 -0.18 -0.0087* -1.92 APE -0.0047 -1.59 0.0006 1.31 0.0003 0.36 0.0043 1.36 E. Level dummies 1 (0<MC≤1) -0.0333 -0.43 -0.0792 -0.52 0.0790 0.48 0.0485 0.54 1 (1<MC≤2) -0.0966 -0.80 0.3594 1.41 0.3875 1.31 0.0199 0.15 1 (2<MC≤3) -0.1703 -1.30 -0.1778 -0.61 0.1173 0.41 0.2281 1.45 1 (3<MC≤4) -0.3017** -2.11 0.3434 1.11 -0.0095 -0.02 0.3033** 1.98 1 (4<MC≤5.5) -0.2224 -1.02 0.0593 0.20 -0.2139 -0.63 0.2556 1.03 1 (MC>5.5) -0.3894** -2.24 0.3617 1.03 -0.0133 -0.01 0.3343* 1.81 APEs: 1 (0<MC≤1) -0.0030 -0.42 -0.0007 -0.52 0.0006 0.48 0.0037 0.54 1 (1<MC≤2) -0.0089 -0.79 0.0038 1.30 0.0036 1.22 0.0015 0.14 1 (2<MC≤3) -0.0161 -1.28 -0.0015 -0.63 0.0010 0.40 0.0186 1.42 1 (3<MC≤4) -0.0298** -1.96 0.0036 1.00 -0.0001 0.00 0.0254* 1.89 1 (4<MC≤5.5) -0.0214 -0.98 0.0005 0.20 -0.0015 -0.67 0.0211 0.99 1 (MC>5.5) -0.0396** -2.12 0.0039 0.93 -0.0001 0.00 0.0283* 1.77 Notes: Marginal cost (MC) was computed using the smoothed experience multiplier, measured in 2010 euros and divided by 10,000. All models includes age dummies, industry dummies, and the 3rd order polynomials for lagged payroll and job tenure. 1 (A)is 1 ifAis true and 0 otherwise. All models were estimated by Maximum
Likelihood. Unless otherwise stated, the estimates are the coecients of marginal cost and its interactions with age/tenure. In Panels A to D, the average partial eect (APE), or average marginal eect, is the partial derivative of the outcome probability accounting for possible interactions, averaged across the distribution of the covariates for workers employed in experience-rated rms in 2010. In Panel E it is the similarly averaged discrete change in the probability compared to the case of zero marginal cost. The z-values are based on the robust standard errors clustered at the rm level. Statistical signicance: ***p <0.01, **p <0.05, *p <0.10.