Idaho Energy Efficiency and
Peak Reduction Annual
Report
January 1, 2014 – December 31, 2014
Issued April 30, 2015
Page 2 of 37
Rocky Mountain Power Idaho Report Table of Contents
TABLE OF CONTENTS
List of Abbreviations and Acronyms ... 5
Executive Summary ... 6
2014 Performance ... 9
Regulatory History ... 10
Schedule 191, Customer Efficiency Services Rate Balancing Account Summary ... 12
Planning Process ... 13
Integrated Resource Plan ... 13
Irrigation Load Control ... 16
Program Management ... 16
Program Administration ... 17
Load Control Events and Performance ... 17
Evaluation ... 17
Energy Efficiency Programs ... 18
Residential Programs ... 18
Home Energy Saver Program ... 18
Program Management ... 20
Program Administration ... 20
Infrastructure ... 20
Program Changes ... 21
Evaluation ... 21
Home Energy Reports ... 21
Program Management ... 21 Program Administration ... 22 Refrigerator Recycling ... 22 Program Management ... 23 Program Administration ... 23 Infrastructure ... 23 Evaluation ... 24
Low Income Weatherization ... 24
Program Management ... 25
Program Administration ... 25
Rocky Mountain Power Idaho Report Table of Contents
Page 4 of 37
Low Income Energy Conservation Education ... 26
Non-Residential Energy Efficiency ... 29
Program Management ... 30
Program Administration ... 31
Infrastructure ... 31
Evaluation ... 33
Communications, Outreach and Education ... 34
Customer Communications ... 34
Program Specific ... 34
FinAnswer Express and Energy FinAnswer/wattsmart Business ... 35
Rocky Mountain Power Idaho Report Abbreviations and Acronyms
L
IST OFA
BBREVIATIONS ANDA
CRONYMSCFL Compact Fluorescent Lighting
CAPAI Community Action Partnership Association of Idaho DSM Demand-Side Management
EICAP Eastern Idaho Community Action Plan
GWh Gigawatt-hour
HVAC Heating, Ventilation and Air Conditioning IDHW Idaho Department of Health and Welfare IRP Integrated Resource Plan
kWh Kilowatt hour
LED Light-emitting Diode
LIHEAP Low Income Home Energy Assistance
MW Megawatt
PCT Participant Cost Test
PTRC Total Resource Cost Test with 10 percent adder RIM Ratepayer Impact Measure Test
Schedule 191 Customer Efficiency Services Rate
SEICAA SouthEastern Idaho Community Action Agency TRC Total Resource Cost Test
Rocky Mountain Power Idaho Report Executive Summary
Page 6 of 37
E
XECUTIVES
UMMARYRocky Mountain Power (“Company”) working in partnership with its retail customers and with the approval of the Idaho Public Utilities Commission (“Commission”) acquires energy efficiency and peak reduction resources as cost-effective alternatives to the acquisition of supply-side resources. These resources assist the Company in efficiently addressing load growth and contribute to the Company’s ability to meet system peak requirements. Company energy efficiency and peak reduction programs provide participating Idaho customers with tools that enable them to reduce or assist in the management of their energy usage while reducing the overall costs to the Company’s customers. These resources are relied upon in resource planning as a least cost alternative to supply-side resources.
This report provides details on program results, activities, expenditures, and Customer Efficiency Service Charge - Schedule 191 (“Schedule 191”) - revenue for the performance period from January 1, 2014, through December 31, 2014. The Company, on behalf of its customers, invested $3.2 million in energy efficiency resource acquisitions during the reporting period. The investment yielded approximately 12.7 gigawatt-hours in first year savings1 and approximately 2.6 megawatts of capacity reduction from energy efficiency2. Net benefits based on the projected value of the energy efficiency program savings over the life of the individual measures are estimated at $2.2 million3. The cost effectiveness of the energy efficiency portfolio from various perspectives is provided in Table 1.
The Company also offers an irrigation load management program to agricultural customers in the state of Idaho. The Idaho Public Utilities Commission ordered that the costs for this program should be system allocated therefore, these costs are not recovered through Schedule 191. Additional information on the irrigation load management program is provided later in this report.
1
Reported savings at generation
2
See Appendix 1 for explanation on how the capacity contribution savings values are calculated.
3
Rocky Mountain Power Idaho Report Executive Summary
Table 1 – Cost Effectiveness Energy Efficiency Portfolio (Including Non-Energy Benefits)
Benefit/Cost Ratio
Net Benefits Total Resource Cost Test plus 10 percent (“PTRC”) – total resource cost with
the addition of environmental and non-energy benefits4 1.59 $2,323,305
Total Resource Cost Test (“TRC”)5 1.45 $1,777,650
Utility Cost Test (“UCT”)6 1.69 $2,234,424
Participant Cost Test (“PCT”)7 4.10 $8,461,876
Ratepayer Impact (“RIM”)8 0.54 ($4,734,470)
The energy efficiency portfolio was cost effective based on four of five standard cost effectiveness tests for the reporting period. The ratepayer impact measure test was less than 1.0 indicating near-term upward pressure was placed on the price per kilowatt-hour given a reduction in sales. Annual performance information for 2014 cost effectiveness is provided in detail in Appendix 2.
On November 13, 2014, the Commission approved the consolidation of Electric Service Schedule No. 140, Non-Residential Energy Efficiency and canceled Electric Service Schedules: No. 115 - FinAnswer Express; No. 125 – Energy FinAnswer; and No. 155 – Agricultural Energy Services. This report consolidates the program results previously reported separately under each of these three programs into one program hereafter referred to as wattsmart® business.
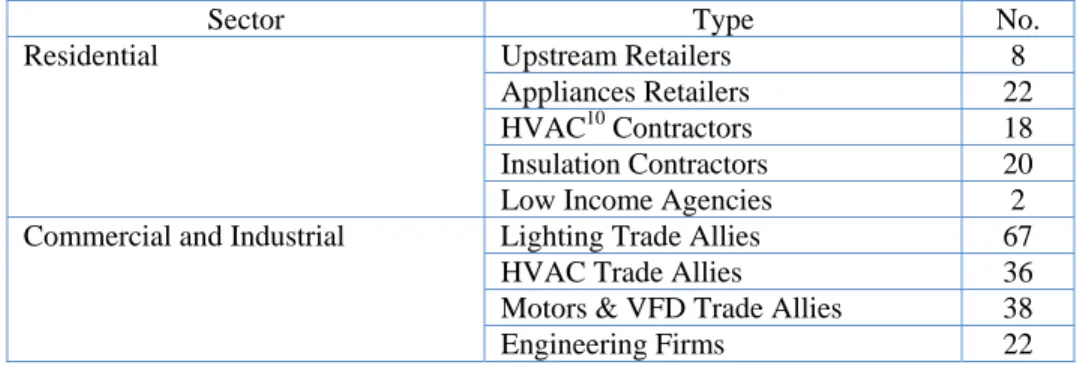
The Company, working with its third-party delivery administrators9 collaborates with the following number of retailers, contractors, and vendors in the delivery of its energy efficiency programs in the state of Idaho:
4
The TRC plus 10 percent includes a benefit adder to account for non-quantified environmental and non-energy benefits of conservation resources over supply-side alternatives.
5
The TRC compares the total cost of a supply-side resource to the total cost of energy efficiency resources, including costs paid by the customer in excess of the program incentives. The test is used to determine if an energy efficiency program is cost effective from a total cost perspective.
6
The UCT compares the total cost incurred by the utility to the benefits associated with displacing or deferring supply-side resources.
7
The PCT compares the portion of the resource paid directly by participants to the savings realized by the participants.
8
The RIM examines the impact of energy efficiency on utility rates. Unlike supply-side investments, energy efficiency programs reduce energy sales. Reduced energy sales lowers revenues (see UCT) putting upward pressure on rates as the remaining fixed costs are spread over fewer kilowatt-hours.
9
Rocky Mountain Power Idaho Report Executive Summary
Page 8 of 37
Table 2 - Energy Efficiency Infrastructure
Sector Type No.
Residential Upstream Retailers 8
Appliances Retailers 22 HVAC10 Contractors 18 Insulation Contractors 20 Low Income Agencies 2 Commercial and Industrial Lighting Trade Allies 67
HVAC Trade Allies 36
Motors & VFD Trade Allies 38
Engineering Firms 22
10
Rocky Mountain Power Idaho Report Executive Summary
2014
P
ERFORMANCEProgram and Sector level results for 2014 are provided in Table 311.
Table 3
Idaho Program Results for January 1, 2014 – December 31, 201412
See Appendix 3 for breakdown of program expenditures by category.
11
Program development for the Home Energy Report program occurred during 2014 in parallel to gaining general support for offering the program in Idaho. No reports were mailed in 2014, therefore no savings were claimed and only minimal costs were incurred.
12
The values at generation include line losses between the customer site and the generation source. The Company’s line losses by sector for 2014 are 11.47 percent for residential, 10.75 percent for commercial, 7.52 percent for industrial and 11.45 percent for irrigation.
Program kWh/Yr Savings (at site ) kWh/Yr Savings (at ge ne rator) Program Expe nditure s Low Income Weatherization (21) 52,320 58,319 $ 182,097 Refrigerator Recycling (117) 652,505 727,321 $ 110,601
Home Energy Reporting $ 20,473
Home Energy Savings (118) 4,864,284 5,422,023 $ 922,206 Total Re side ntial 5,569,109 6,207,663 $ 1,235,376 wattSmart Business Agricultural 1,771,625 1,974,441 $ 489,578 wattSmart Business Commercial 3,793,140 4,200,865 $ 837,589 wattSmart Business Industrial 276,492 297,290 $ 397,201 Total wattsmart Busine ss 5,841,257 6,472,595 1,724,368 Total Ene rgy Efficie ncy 11,410,366 12,680,258 2,959,744 Commercial & Industrial Evaluation Costs $ 110,685
Residential Evaluation Costs $ 93,900 Low Income Energy Conservation Education $ 25,000 Outreach & Communications $ 4,989 Technical Reference Library $ 14,488 DSM Central $ 13,309 Total Syste m Be ne fit Expe nditure s - All Programs $ 3,222,115
Rocky Mountain Power Idaho Report Regulatory History
Page 10 of 37
R
EGULATORYH
ISTORYDuring the reporting period the Company filed a number of compliance and/or informational reports, updates and requests with the Commission in support of the Company programs. The following is a list of those filings:
On November 7, 2013, in Case No. PAC-E-13-15, the Company filed for approval of a one-time customer credit to refund over collection of Schedule 191 Customer Efficiency Services rate (“Schedule 191”). The refund was approved by the Commission in Order No. 32967 on January 23, 2014 and the refund to customers was completed in February 2014.
On February 28, 2014 the Company posted the public notice for updates to the Home Energy Savings Program after reviewing changes with Idaho Staff. The changes were effective April 13, 2014.
On April 28, 2014, pursuant to Order No. 29976, the Company submitted its 2013 Idaho Energy Efficiency and Peak Reduction Annual Report.
On May 22, 2014, in Advice No. 14-01, the Company filed for approval of tariff modifications to Schedule 117 – Residential Refrigerator Recycling Program. The Commission approved the request on June 23, 2014 with an effective date of July 1, 2014.
On July 7, 2014, in Case No. PAC-E-14-07, the Company filed an application requesting the Commission rule on the prudency of the Company’s demand-side management (“DSM”) expenditures for calendar years 2010 through 2013. Commission Order No. 33188 issued December 3, 2014 found that the Company’s DSM expenditures for 2010-2013 were prudently incurred.
On August 22, 2014, in Case No. PAC-E-14-08, the Company filed an application requesting authorization to consolidate Electric Service Schedules: No. 115 - FinAnswer Express; No. 125 – Energy FinAnswer; and No. 155 – Agricultural Energy Services, with modification, under a new Electric Service Schedule No. 140, Non-Residential Energy Efficiency, and cancel these three Electric Service Schedules effective November 1, 2014. Commission Order No. 33178 issued November 13, 2014 approved the Company’s application effective the date of the order.
On December 9, 2014, pursuant to Order No. 33188 in Case No. PAC-E-14-07, the Company filed compliance tariffs to remove Schedule 8 from Schedule 191.
Meetings with Idaho Staff
The Company consulted with Idaho Staff throughout 2014 on the following matters: February 18, 2014
Reviewed the one-time bill credit which began February 1, 2014; Provided an overview of program performance;
Rocky Mountain Power Idaho Report Regulatory History
Presented residential program updates (See ya later, refrigerator® and Home Energy Savings);
Presented a proposal to consolidate business programs into one wattsmart Business program;
Discussed the possible introduction of a Home Energy Reports program in Idaho. July 28, 2014 – Phone Conference
Discussed the proposal to cancel Schedules 115, 125, and 155 and to consolidate them under a new Electric Service Schedule No. 140.
August 13, 2014
Reviewed the 2013 Annual Report and the Prudency Filing for 2010 through 2013 DSM expenses;
Presented a proposal for a Home Energy Reports program in Idaho;
Provided residential program updates (See ya later, refrigerator and Home Energy Savings);
Provided an update on the status of the proposal to consolidate business programs into one wattsmart Business program;
Presented an enhanced communications plan for Idaho and proposed campaign messaging;
Provided an update on Load Control Programs;
Provided Idaho highlights of the Conservation Potential Assessment;
Reviewed evaluation reports for the See ya later, refrigerator and Home Energy Saving programs and the current evaluation schedule.
Rocky Mountain Power Idaho Report Regulatory History
Page 12 of 37
Schedule 191, Customer Efficiency Services Rate Balancing Account Summary
In Case Number PAC-E-05-10 (Order No. 29976) the Commission approved the recovery of all DSM program costs through Schedule 191, with exception of the expenses associated with the irrigation load control program13. Schedule 191 charges appear as a line item on customer bills. The Company books eligible DSM program costs as incurred to the balancing account.
Schedule 191 balancing account activity for 2014 is outlined in Table 4.
Table 4
Schedule 191 Balancing Account Activity
Column Explanations:
Monthly Program Costs: Monthly expenditures for all energy efficiency program activities.
Monthly Net Accrued Costs: Monthly net change of program costs incurred during the period not yet posted.
Rate Recovery: Revenue collected through Schedule 191.
Carrying Charge: Monthly “interest” charge based on “Cash Basis Accumulated Balance” of the account. The current “interest rate” for the Accumulated Balance is 1 percent per year.
Cash Basis Accumulated Balance: A running total of account activities. A negative accumulative balance means cumulative revenue exceeds cumulative expenditures; positive accumulative balance means cumulative expenditures exceed cumulative revenue.
Accrual Basis Accumulative Balance: Current balance of account including accrued costs.
13
Commission Order 32196, in Case No. PAC-E-10-07, ruled that costs associated with the Idaho Irrigation Load Control Program should be system allocated not situs assigned to Idaho customers and recommended the Company treat the benefits of the program as a system resource for cost recovery purposes.
State of Idaho
Summary - Balancing Account
Monthly Program Cost Monthly Net Accrued Costs * Rate Re covery Carrying Charge Cash Basis Accumulated Balance Accrual Basis Accumulate d Balance Balance as of 12/31/13 $ (908,882) $ (625,565) January $ 199,728 $ (35,032) $ (274,741) $ (789) $ (984,684) $ (736,399) February $ 277,055 $ (97,033) $ 1,184,794 $ (211) $ 476,955 $ 628,206 March $ 267,760 $ 1,897 $ (215,906) $ 419 $ 529,227 $ 682,376 April $ 272,076 $ (11,315) $ (203,781) $ 469 $ 597,991 $ 739,825 May $ 170,588 $ 23,832 $ (264,860) $ 459 $ 504,178 $ 669,843 June $ 325,554 $ (18,826) $ (490,453) $ 351 $ 339,629 $ 486,468 July $ 193,932 $ 41,276 $ (583,010) $ 121 $ (49,327) $ 138,788 August $ 213,804 $ 91,181 $ (520,272) $ (169) $ (355,964) $ (76,668) September $ 315,637 $ (22,472) $ (318,779) $ (298) $ (359,405) $ (102,580) October $ 223,462 $ 13,618 $ (243,510) $ (308) $ (379,761) $ (109,319) November $ 224,967 $ 244,026 $ (228,009) $ (318) $ (383,121) $ 131,348 December $ 476,261 $ (11,622) $ (247,787) $ (224) $ (154,871) $ 347,975 2014 totals $ 3,160,823 $ (2,406,315) $ (498)
Rocky Mountain Power Idaho Report Planning Process
P
LANNINGP
ROCESS Integrated Resource PlanThe Company develops a biennial integrated resource plan (“IRP”) as a means of balancing cost, risk, uncertainty, supply reliability/deliverability and long-run public policy goals.14 The plan presents a framework of future actions to ensure the Company continues to provide reliable, reasonable-cost service with manageable risks to the Company’s customers. Energy efficiency and peak management opportunities are incorporated into the IRP based on their availability, characteristics and costs.
Energy efficiency and peak management resources are divided into four general classes:
Class 1 DSM (Resources from fully dispatchable or scheduled firm capacity product offerings/programs) – Capacity savings occur as a result of active Company control or advanced scheduling. After customers agree to participate, the timing and persistence of the load reduction is involuntary on their part within the agreed limits and parameters. Class 2 DSM (Resources from non-dispatchable, firm energy and capacity product
offerings/programs) – Sustainable energy and related capacity savings are achieved through facilitation of technological advancements in equipment, appliances, lighting and structures or sustainable verifiable changes in operating and maintenance practices, also commonly referred to as energy efficiency resources.
Class 3 DSM (Resources from price responsive energy and capacity product offerings/programs) – Short-duration energy and capacity savings from actions taken by customers voluntarily based on pricing incentives or signal.
Class 4 DSM (Resources from energy efficiency education and non-incentive based voluntary curtailment programs/communications pleas) – Energy and/or capacity reduction typically achieved from voluntary actions taken by customers to reduce costs or benefit the environment through education, communication and/or public pleas.
Class, 1, 2 and 3 DSM resources are included as resource options in the resource planning process. Class 4 DSM actions are not considered explicitly in the resource planning process, however, the impacts are captured naturally in long-term load growth patterns and forecasts. As technical support for the IRP, a third-party demand-side resource potential assessment (Potentials Assessment) is conducted to estimate the magnitude, timing and cost of energy efficiency and peak management resources.15 The main focus of the Potentials Assessment is on resources with sufficient reliability characteristics that are anticipated to be technically feasible and assumed achievable during the IRP’s 20-year planning horizon. The estimated achievable energy efficiency potential identified in the 2015 Potentials Assessment for Idaho is 468
14
Information on the Company’s integrated resource planning process can be found at the following address:
http://www.pacificorp.com/es/irp.html
15
Rocky Mountain Power Idaho Report Planning Process
Page 14 of 37
gigawatt hours (GWh) by 2034, or 20 percent of projected baseline loads.16 By definition this is the energy efficiency potential that may be achievable to acquire during the 20-year planning horizon; prior to screening for cost-effectiveness through the Company’s integrated resource planning process.
The achievable technical potential of Class 2 (energy efficiency) resources for Idaho by sector is shown in Table 5. The 2015 Potentials Assessment indicates that approximately 4 percent of the achievable technical potential for the Company, excluding Oregon,17 is available within its Idaho service area.18
Table 5
Idaho Energy Efficiency Achievable Technical Potential by Sector
Sector
Cumulative GWh in
2034 Percent of Baseline Sales
Residential 184 21%
Commercial 195 29%
Industrial 33 12%
Irrigation 18 10%
Street Lighting 1 34%
Demand-side resources vary in their reliability, load reduction and persistence over time. Based on the significant number of measures and resource options reviewed and evaluated in the Potentials Assessment, it is impractical to incorporate each as a stand-alone resource in the IRP. To address this issue, Class 2 DSM measures and Class 1 DSM programs are bundled by cost for modeling against competing supply-side resource options reducing the number of discrete resource options the IRP must consider to a more manageable number.
The evaluation of Class 2 DSM (energy efficiency) resources within the IRP is also informed by state-specific evaluation criteria in the development of supply-curves. While all states generally use commonly accepted cost-effectiveness tests to evaluate DSM resources, some states require variations in calculating or prioritizing the tests:
Utah utilizes the Utility Cost Test (UCT) as the primary determination of cost effectiveness.
Idaho, Oregon, and Washington utilize the Total Resource Cost (TRC) test and consider the inclusion of quantifiable non-energy benefits.
Oregon and Washington, in addition to considering quantifiable non-energy benefits, apply an additional 10% benefit to account for non-quantifiable externalities, consistent with the Northwest Power Act.
16
Ibid, Volume 2, page 4-2.
17
Oregon energy efficiency potentials assessments are performed by the Energy Trust of Oregon.
18
Rocky Mountain Power Idaho Report Planning Process
Unless specified as above, the Total Resource Cost test is utilized as the primary determination of cost effectiveness in the resource planning process. However, the Company evaluates program implementation cost-effectiveness (both prospectively and retrospectively) under a variety of tests to identify the relative impact and/or value (e.g. near-term rate impact, program value to participants, etc.) to customers and the Company
Rocky Mountain Power Idaho Report Peak Reduction Program
Page 16 of 37
P
EAKR
EDUCTIONP
ROGRAMSPeak Reduction programs assist the Company in balancing the timing of customer energy requirements during heavy use summer hours; deferring the need for higher cost investments in delivery infrastructure and generation resources that would otherwise be needed to serve those loads for a select few hours each year. These programs help the Company maximize the efficiency of the Company’s existing electrical system and reduce costs for all customers.
Irrigation Load Control
The Irrigation Load Control program was offered to irrigation customers receiving electric service on Schedule 10, Irrigation and Soil Drainage Pumping Power Service. Participants enrolled with a third party administrator to allow the curtailment of their electricity usage in exchange for a participation credit. For most participants, their irrigation equipment is set up with a dispatchable two-way control system giving the Company control over their loads. Under this control option, participants are provided a day-ahead notification in advance of control events and have the choice to opt-out of a limited number of dispatch events per season.
A summary of the program performance, participation and cost effectiveness results for the program period of June 9, 2014 – August 15, 2014 are provided in Tables 6 and 7.
Table 6
Irrigation Load Control Program Performance Total Enrolled MW (Gross – at Gen) 290.4 Average Realized load (at Gen) 162 Maximum Realized load (at Gen) 177 Participation Customers 190 Participation (Sites) 1,185
Table 7
Cost Effectiveness for Irrigation Load Control
Benefit/Cost Ratio
Total Resource Cost Test plus 10 percent Pass
Total Resource Cost Test Pass
Utility Cost Test Pass
Participant Cost Test N/A
Rate Payer Impact Pass
Program Management
The program manager who is responsible for the Irrigation Load Control program in Idaho is also responsible for the Irrigation Load Control and Cool Keeper programs in Utah. For each
Rocky Mountain Power Idaho Report Peak Reduction Program
state the program manager is responsible for managing the program administrator, the cost effectiveness of the program, contracting with program administrator through a competitive bid process, establishing and monitoring program performance and compliance, and recommending changes to increase participation.
Program Administration
EnerNoc administers and manages the Irrigation Load Control program through a pay-for-performance structure and is responsible for all aspects of the program.
Load Control Events and Performance
There were four control events initiated in 2014. The date, time and estimated impact for each event is provided in Table 8.
Table 8
Irrigation Load Control Events
Date Event Event Times
Estimated Load Reduction - Idaho at Gen
(MW) 7/10/14 1 4pm-8pm -177 7/14/14 2 3pm-7pm -163 7/17/14 3 3pm-7pm -161 7/23/14 4 3pm-7pm -147 Evaluation
No evaluation activities occurred during 2014.
.
Rocky Mountain Power Idaho Report Residential Programs
Page 18 of 37
E
NERGYE
FFICIENCYP
ROGRAMSEnergy efficiency programs are offered to all major customer sectors: residential, commercial, industrial and agricultural. The overall energy efficiency portfolio includes five programs: Home Energy Saver – Schedule 118, Residential Refrigerator Recycling – Schedule 117, Low Income Weatherization – Schedule 21, Home Energy Reports, and wattsmart Business – Schedule 140.
Program savings and cost results for 2014 were provided in Table 3. Additional program information is provided below19.
R
ESIDENTIALP
ROGRAMSThe residential energy efficiency portfolio is comprised of four programs, Home Energy Saver, Home Energy Reports, Residential Refrigerator Recycling and Low Income Weatherization. As shown in Table 9, the residential portfolio was cost effective based on four of the five standard cost effectiveness tests for the 2014 reporting period. The ratepayer impact test was less than 1.0 indicating that there is near term upward pressure placed on the price per kilowatt-hour given a reduction in sales.
Table 9
Cost Effectiveness for Residential Portfolio (Including Non-Energy Benefits) Benefit/Cost
Ratio
Net Benefits Total Resource Test plus 10 percent 2.15 $1,553,202 Total Resource Cost Test 1.98 $1,314,604
Utility Cost Test 1.79 $1,056,707
Participant Cost Test 6.60 $4,603,319
Rate Payer Impact 0.52 ($2,215,539)
Home Energy Saver Program
The Home Energy Saver program is designed to provide access to and incentives for more efficient products and services installed or received by customers in new or existing homes, multi-family housing units or manufactured homes for residential customers under Electric Service Schedules 1 and 36. Program participation by measure is provided in Table 10.
19
Rocky Mountain Power Idaho Report Residential Programs
Table 10
Eligible Program Measures (Units) Measures 2014 Total Units 2014 Total Participants 2014 kWh @ site
Central Air Conditioner Equipment 3 3 285
Duct Sealing - Manufactured Homes 14 14 45,738 Efficient Gas Furnace with Electrically
Commutated Motor 10 10 5,280
Heat Pump 7 7 39,087
Ductless Heat Pump 21 21 73,500
Electric Water Heater 11 10 1,377
Heat Pump Water Heater 1 1 881
Clothes Washer 287 286 35,269 Dishwasher 104 104 4,525 Freezer 1 1 94 Refrigerator 26 26 2,231 Evaporative Cooler 9 9 3,154 Insulation - Attic 36,973 24 38,729 Insulation - Floor 900 1 2,178 Insulation - Wall 6,970 4 9,176 Windows 3,110 25 9,197 Light Fixture 17,773 971 425,576 CFL Bulbs 53,887 5,389 967,822 LED Bulbs 622 622 19,222.51
wattsmart Starter Kits 7,512 7,512 3,180,964
Grand Total 128,241 15,040 4,864,284
2014 Home Energy Saver program performance results are provided in Table 11.
Table 11
Long-term Cost Effectiveness for Home Energy Saver Program
Benefit/Cost Ratio Net Benefits Benefit/Cost Ratio Net Benefits Including Non-energy benefits Excluding Non-energy benefits Total Resource Cost Test plus 10 percent 2.76 $1,658,077 2.50 $1,412,806 Total Resource Cost Test 2.53 $1,444,081 2.27 $1,198,810 Utility Cost Test 2.32 $1,217,758 2.32 $1,217,758 Participant Cost Test 5.79 $3,938,667 5.49 $3,693,396 Rate Payer Impact 0.55 $-1,754,127 0.55 ($1,754,127)
Rocky Mountain Power Idaho Report Residential Programs
Page 20 of 37
Program Management
The program manager who is responsible for the Home Energy Saver program in Idaho is also responsible for the program in California, Utah, Washington and Wyoming and the New Homes
program in Utah. For each program and in each state the program manager is responsible for the cost effectiveness of the program, identifying and contracting with the program administrator through a competitive bid process, establishing and monitoring program performance and compliance, and recommending changes in the terms and conditions set out in the tariff.
Program Administration
The Home Energy Savings program is administered by CLEAResult. CLEAResult is responsible for the following:
Retailer and trade ally engagement – CLEAResult identifies, recruits, supports and assists retailers to increase the sale of energy efficient lighting, appliances and electronics. CLEAResult enters into promotion agreements with each lighting manufacturer and retailer for the promotion of discounted CFL and LED bulbs. The agreements include specific retail locations, lighting products receiving incentives and not-to-exceed annual budgets. Weatherization and HVAC trade allies engaged with the program are provided with program materials, training, and regular updates.
Inspections – CLEAResult recruits and hires inspectors to verify on an on-going basis the installation of measures. A summary of the inspection process is in Appendix 4.
Incentive processing and call-center operations – CLEAResult receives all requests for incentives, determines whether the applications are completed, works directly with customers when information is incorrect and/or missing from the application and processes the application for payment.
Program specific customer communication and outreach – A summary of the communication and outreach conducted by CLEAResult on behalf of the Company is outlined in the Communication, Outreach, and Education section.
Infrastructure
The total number of participating retailers participating in the program is currently 28. The current count of participating retailers by measure group is provided in the Table 12. Detail of participating retailers is available in Appendix 5.
Table 12 Participating Retailers20
Lighting Retailers Appliance Retailers HVAC Contractors Weatherization
8 22 18 20
20
Some retailers/contractors may participate in the promotion of more than one measure group so the count of unique participating firms is less than the total count provide above.
Rocky Mountain Power Idaho Report Residential Programs
Program Changes
In 2014, the Home Energy Savings program was modified to include:
wattsmart Starter Kits with ENERGY STAR® lighting and WaterSense® products, depending on the customers’ water heating type.
Direct install duct sealing for customers in manufactured homes with forced air electric furnaces.
Evaluation
In January 2014, a process and impact evaluation was completed by a third party evaluator for program years 2011-2012. The primary objective of the evaluation report is to determine the extent to which participants in the Home Energy Savings program reduced their energy consumption due to the program. Secondary objectives are to report on customer satisfaction, program awareness and motivations for participation in the program. The results of the evaluation can be viewed at www.pacificorp.com/es/dsm/idaho.html. The Company’s response to the recommendations and web link to the evaluation report are included in Appendix 6.
Home Energy Reports
Program development for the Home Energy Report program occurred during 2014 in parallel to gaining general support for offering the program in Idaho. The program’s implementation schedule was estimated to be between 12 and 18 weeks. No reports were mailed in 201421 therefore no savings were claimed and only minimal costs were incurred.
This program is designed to better inform residential customers about their energy usage by providing comparative energy usage data for similar homes located in the same geographical area. In addition, the report provides the customer with information on how to decrease their energy usage. Equipped with this information, customers can modify behavior and/or make structural equipment, lighting or appliance changes to reduce their overall electric energy consumption.
Program Management
The program manager overseeing Home Energy Reports program activity in Idaho is also responsible for the program in Utah, Washington and Wyoming as well as the See ya later, refrigerator program in Idaho, California, Utah, Washington and Wyoming. For each program and in each state the program manager is responsible for the cost effectiveness of the program, identifying and contracting with the program administrator through a competitive bid process, establishing and monitoring program performance and compliance, and recommending changes in the terms and conditions set in each state’s compliance requirements.
21
Rocky Mountain Power Idaho Report Residential Programs
Page 22 of 37
Program Administration
The Home Energy Reports program is administered by Opower.
Refrigerator Recycling
The Refrigerator Recycling program, also known as “See ya later, refrigerator,” is designed to decrease electricity use through voluntary removal and recycling of inefficient refrigerators and freezers that are a minimum of 10 cubic feet and a maximum of 32 cubic feet in size. Participants receive a $50 incentive for each qualifying refrigerator or freezer recycled through the program and an saving kit which includes two CFLs, a refrigerator thermometer card, energy-savings educational materials, and information on other efficiency programs relevant to residential, commercial and industrial customers. Participating retailers receive an incentive of up to $20 for each qualifying refrigerator or freezer picked up. In the third quarter, the program was expanded to include pickups from business customers and retailers.
Program participation by measure is provided in Table 13.
Table 13
Eligible Program Measures (Units)
Measures 2014 Total 2014 kWh @ site Refrigerators 480 492,912 Freezers 137 141,577 Kits 567 18,016 Total 1,184 652,505
2014 Refrigerator Recycling program performance results are provided in Table 14.
Table 14
Long-term Cost Effectiveness for Refrigerator Recycling
Benefit/Cost Ratio
Net Benefits Total Resource Cost Test plus 10 percent 1.54 $60,130 Total Resource Cost Test 1.40 $44,609
Utility Cost Test 1.40 $44,609
Participant Cost Test 22 0.47 ($172,148)
Rate Payer Impact N/A $430,355
In 2014, more than 80,210 pounds of metal, 12,340 pounds of plastics, and 1,440 pounds of tempered glass were recycled as a result of the program. In addition, the capture, recovery or
22
Rocky Mountain Power Idaho Report Residential Programs
destruction of more than 683 pounds of ozone depleting Chlorofluorocarbons (greenhouse gases) and Hydro fluorocarbons, commonly used in refrigerants and foam insulation equates to approximately 1,497 metric tons of carbon dioxide.
Program Management
The program manager responsible for the Refrigerator Recycling program in Idaho is also responsible for the program in California, Utah, Washington and Wyoming and Home Energy Reports program in Idaho, Utah, Washington, and Wyoming. For each program and in each state the program manager is responsible for the cost effectiveness of the program, identifying and contracting with the program administrator through a competitive bid process, establishing and monitoring program performance and compliance, and recommending changes in the terms and conditions set out in the tariff.
Program Administration
The Refrigerator Recycling program is administered by JACO Environmental (“JACO”). JACO is one of the largest recyclers of house-hold appliances in the United States. The Company contracts with JACO to provide customer scheduling, pick-up, incentive processing and marketing services for the See ya later, refrigerator program.
JACO’s process ensures that over 95 percent of the components and materials of the discarded appliance are either recycled for beneficial uses or eliminated in an environmentally responsible way. The remaining 5 percent can then be productively used as “fluff” to facilitate the decomposition of biodegradable landfill material.
JACO is responsible for the following:
Appliance Pick-up – JACO handles all customer and field service operations for the program including pick-up of refrigerators and freezers from customers, transporting the units to the de-manufacturing facility.
Incentive processing and call-center operations – Customer service calls, pick-up scheduling and incentive processing.
Program specific customer communication and outreach – Working in close coordination with the Company, JACO handles all the marketing for the program. The program is marketed through bill inserts, customer newsletters and TV, newspaper and online advertising.
As part of the program control process, the Company contracts with a third-party independent inspector to conduct ongoing oversight of the program’s appliance recycling process, from verification that the units being recycled meet the program eligibility criteria to verifying they are being recycled and that the program records are accurate.
A summary of the inspection process is included in Appendix 4. Infrastructure
Rocky Mountain Power Idaho Report Residential Programs
Page 24 of 37
A crew from Salt Lake City, Utah, picks up units collected through the program in Idaho and transports the units to a JACO facility in Salt Lake City for disassembly and recycling.
Evaluation
No evaluation activities occurred during 2014.
Low Income Weatherization
The Low Income Weatherization program provides energy efficiency services through a partnership between the Company and local non-profit agencies to residential customers that meet income-eligible guidelines. Services are at no cost to the program participants.
Total homes treated under the program in 2014, as well as the type and frequency of specific energy efficiency measures installed in each home, is provided in Table 15.
Table 15
Homes Receiving Specific Measures
2014 Low Income Weatherization program performance results are provided in Table 16.
Participation – Total # of Completed/Treated Homes 41 Number of Homes Receiving Specific Measures
Attic Ventilation 11
Ceiling Insulation 24
Compact Fluorescent Light Bulbs 40
Duct Insulation 12
Floor Insulation 15
Furnace Repair 26
Health & Safety Measures 24
Infiltration 37
Refrigerators 3
Replacement Windows 23
Thermal Doors 28
Wall Insulation 4
Water Heater Repair 4
Water Heater Replacement 1
Rocky Mountain Power Idaho Report Residential Programs
Table 16
Cost Effectiveness for Low Income Weatherization
Benefit/Cost Ratio
Net Benefits Total Resource Cost Test plus 10 percent 0.72 ($50,632) Total Resource Cost Test 0.67 ($59,713)
Utility Cost Test 0.50 ($91,288)
Participant Cost Test N/A $234,297 Rate Payer Impact 0.34 ($174,891)
As shown in Table 16, the Low Income Weatherization program ex-ante results suggest the program was not cost effective based on the five standard cost effectiveness tests for the 2014 reporting period. This is largely due to a decrease in number of homes served and measures installed by approximately 45 percent where program cost decreased only by 11 percent. The Company will review program measures with its associated unit energy savings assumptions to ensure program cost effectiveness going forward.
Program Management
The program manager who is responsible for the Low Income Weatherization program in Idaho is also responsible for the program in California, Utah, Washington and Wyoming; energy assistance programs in Idaho, California, Oregon, Utah, Washington and Wyoming; and bill discount programs in California, Utah and Washington. The program manager is responsible for the cost effectiveness of the weatherization program in each state, partnerships and agreements in place with local agencies that serve income eligible households, establishing and monitoring program performance and compliance, and recommending changes in the terms and conditions set out in the agency contracts and state specific tariffs.
Program Administration
The Company has contracts in place with Eastern Idaho Community Action Partnership (“EICAP”) and SouthEastern Idaho Community Action Agency (“SEICAA”) to provide services through the low income weatherization program. These two agencies receive federal funds allocated to the Idaho Department of Health and Welfare (“IDHW”) and administered by the Community Action Partnership Association of Idaho (“CAPAI”) through subcontracting non-profit agencies. Energy efficiency measures are installed in the homes of income eligible households throughout the Company’s service area by EICAP and SEICAA. Company funding of 85 percent of the cost of approved measures is leveraged by the agencies with the funding received by IDHW.
By contract with the Company, EICAP and SEICAA are responsible for the following:
Income Verification – Agencies determine participants are income eligible based on CAPAI guidelines. Household’s interested in obtaining weatherization services apply through the agencies. The 2014 income guidelines can be viewed at
Rocky Mountain Power Idaho Report Residential Programs
Page 26 of 37
/www.idahocommunityaction.org/programs/weatherization-html/weatherization-assistance-program-income-guidelines-html/
Energy Audit – Agencies use a United States Department of Energy approved audit tool to determine the cost effective measures to install in the participant’s homes (audit results must indicate a savings to investment ratio of 1.0 or greater).
Installation of Measures – Agencies install the energy efficiency measures.
Post Inspections – Agencies inspect 100 percent of completed homes. IDHW and CAPAI also inspect a random sample of homes. See Appendix 4 for verification summary.
Billing Notification – Agencies are required to submit a billing to Company within 120 days after job completion. The agencies include a form indicating the measures installed and associated cost on each completed home along with their invoice.
Evaluation
The Low Income Weatherization program was evaluated in 2014 by Smith & Lehmann Consulting. This firm was selected through an RFP process and completed the evaluation in January 2015 for program years 2010, 2011 and 2012.
Low Income Energy Conservation Education
Commission Order No. 32788 dated April 12, 2013, ruled that the Company’s funding of Low Income Energy Conservation Education should be $25,000 annually. These services are provided by EICAP whose main office is located in Idaho Falls, and SEICAA whose main office is in Pocatello. They target the Company’s customers that receive Low Income Home Energy Assistance (“LIHEAP”) funds. EICAP, SEICAA and the Company staff discussed the allocation of the annual funding amount and the agencies determine the efficiency measures they distribute each year. EICAP receives $13,250 and SEICAA $11,750 for a total of $25,000 prior to the beginning of their 2014/2015 LIHEAP program year. While the conservation education activities do result in energy savings, the savings are not considered when calculating the performance results of the Low Income Weatherization program, other energy efficiency programs or portfolios results.23
The agencies provided a conservation education curriculum to households and reported the following activities and program specifics for 2014:
EICAP SEICAA
Annual funds: $13,250 $11,750
Expenditures: 250 Window kits = $562.50 800 CFLs (13w) = $1,960 300 CFLs (13w/2 pack) = $585 650 Power timers = $7,800 300 CFLs (23w/3 pack) = $861 Staff labor = $1,990
23
Rocky Mountain Power Idaho Report Residential Programs 250 Weather-strip = $322.50 200 Power timers = $2,400 300 Smart strips = $5,250 Shipping = $150 To be spent in 2015 = $3,119 Households served: 659 287 Distribution
EICAP: A total of 1,977 measures were distributed. Measures purchased included window kits, CFLs, weather-stripping, power timers and smart strips, and allowed participants to choose three measures. Because of cost, a participant could pick between the smart strip or power timer and two of the other items. The smart strip was the favorite, then CFLs and 50/50 on the window kits/weather-stripping. EICAP did not track the number of each specific measure distributed and did not have an inventory of any measures purchased prior to 2014.
SEICAA: A total of 322 CFLs and 124 power timers purchased in 2014 were distributed. Measures purchased in 2013 were also provided to households including 549 shower timers and 537 night lights. Kits purchased in 2010 (102) that included 1 compact fluorescent light bulb (13 watt), 1 compact fluorescent light bulb (19 watt), 1 compact fluorescent light bulb (23 watt), 10 outlet gaskets, 1 kitchen aerator, 1 refrigerator temperature card and 1 night light were given to participants in 2014. SEICAA reported that as of February 1, 2015, all the 2010 kits have been distributed (final 4 distributed in January 2015).
Program Design
EICAP: Educate Rocky Mountain Power customers about how to conserve energy and understand their bill.
SEICAA: Reduce electricity usage and monthly bills for participants of the LIHEAP program. Target Audience
EICAP: Rocky Mountain Power customers receiving energy assistance.
SEICAA: LIHEAP recipients that have not had weatherization program services are a priority. Households can also be identified through SEICAA’s other programs. The Company may refer customers for possible participation using current LIHEAP income guidelines as the first criteria. Gauge Program’s Success in Meeting Goals
EICAP: Acceptance of energy conservation tools after education.
SEICAA: The program’s success will be gauged through periodic reporting and the response from the participants through surveys.
Indicate How Company Funds are Used
Rocky Mountain Power Idaho Report Residential Programs
Page 28 of 37
SEICAA: To purchase energy conservation measures. Funds are also used for educator salaries. Describe How the Program Benefits Participants
EICAP: Households receive useful tips and tools to help them save energy while applying for LIHEAP.
SEICAA: Households are educated on how they can reduce kWh usage through behavioral changes as well as the installation and benefits of the energy conservation measures they receive during LIHEAP intake.
Rocky Mountain Power Idaho Report Non-Residential Programs
N
ON-R
ESIDENTIALE
NERGYE
FFICIENCYThe commercial and industrial energy efficiency program portfolio was consolidated into a single Non-Residential Energy Efficiency program, Schedule 140, which became effective November 13, 2014. The programs that were consolidated include FinAnswer Express, Agricultural Energy Services and Energy FinAnswer. The consolidated Non-Residential Energy Efficiency program is promoted to the Company’s customers as wattsmart Business.
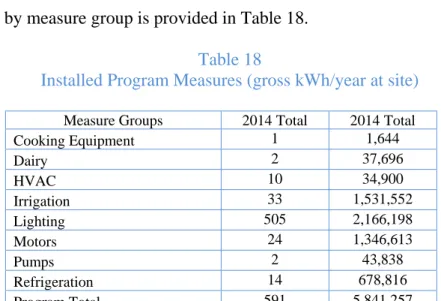
The data below for the year is provided for the commercial/industrial/agricultural portfolio with results by measure group to capture all of the Non-Residential energy efficiencyactivities for the year.
Projects completed in the current period by customer sector are provided in Table 17.
Table 17 Projects Completed Sector 2014 Total Agricultural 40 Commercial 530 Industrial 21 Total 591
Program savings by measure group is provided in Table 18.
Table 18
Installed Program Measures (gross kWh/year at site) Measure Groups 2014 Total 2014 Total
Cooking Equipment 1 1,644 Dairy 2 37,696 HVAC 10 34,900 Irrigation 33 1,531,552 Lighting 505 2,166,198 Motors 24 1,346,613 Pumps 2 43,838 Refrigeration 14 678,816 Program Total 591 5,841,257
Rocky Mountain Power Idaho Report Non-Residential Programs Page 30 of 37 Table 19
Cost Effectiveness for Non-Residential Energy Efficiency Benefit/Cost
Ratio
Net Benefits Benefit/Cost Ratio
Net Benefits Includes Portfolio Costs Excludes Portfolio Costs Total Resource Test plus 10
percent 1.32 $827,889 1.38 $938,574
Total Resource Cost Test 1.20 $520,833 1.26 $631,518 Utility Cost Test 1.67 $1,235,504 1.78 $1,346,189 Participant Cost Test 3.02 $3,858,557 3.02 $3,858,558 Rate Payer Impact 0.56 ($2,461,144) 0.57 ($2,350,459)
The wattsmart Business program is intended to maximize the efficient utilization of electricity for new and existing non-residential customers through the installation of energy efficiency measures and energy management protocols. Qualifying measures are any measures which, when implemented in an eligible facility, result in verifiable electric energy efficiency improvements.
Services offered through the program are:
Typical Upgrades: Provides streamlined incentives for lighting, HVAC, compressed air and other equipment upgrades that increase electrical energy efficiency and exceed code requirements.
Small Business Lighting: Provides enhanced incentives for lighting retrofits installed by approved trade allies at eligible small business customer facilities (This offer was added in November 2014).
Custom analysis: Offers energy analysis studies and services for more complex projects. Energy management: Provides expert facility and process analysis to help lower energy
costs by optimizing customer’s energy use. (This offer was added in November 2014.) Energy project manager co-funding: Available to customers who can commit to an
annual goal of completing a project resulting in a minimum of 1,000,000 kWh per year in energy savings. (This offer was added in November 2014.)
Program Management
The program managers overseeing the business energy efficiency program activity in Idaho are also responsible for the programs in California, Utah, Washington, and Wyoming. For each state the program managers are responsible for the management of the program administrators, cost effectiveness, identifying and contracting with the program administrators through a competitive bid process, program marketing, achieving and monitoring program performance and compliance, and recommending changes in the terms and conditions of the program.
Rocky Mountain Power Idaho Report Non-Residential Programs
Program Administration
The program is primarily administered through two channels that are differentiated based upon customer needs. The first channel generally targets typical opportunities which serve small to medium sized business customers and to lesser extent large business customers. Administration is provided through Company contracts with Nexant, Inc. (“Nexant”) and Cascade Energy (“Cascade”) who manage trade ally coordination, training and application processing services for commercial measures and industrial/agricultural measures respectively. The second channel targets large energy users who generally have multiple opportunities for energy efficiency improvements, such as those that require custom analysis, is administered by internal project managers allowing for a single point of contact to assist customers with their various opportunities.
Nexant and Cascade are responsible for the following:
Trade ally engagement to help increase and improve the supplier and installation contractor infrastructure for energy-efficient equipment and services – includes identification, recruiting, training, supporting and assisting trade allies to increase sales and installation of energy efficient equipment at qualifying business customer facilities. Incentive processing and administrative support – includes handling incoming inquiries
as assigned, processing incentive applications, developing and maintaining standardized analysis tools and providing program design services, evaluation and regulatory support upon request.
Custom analysis and project facilitation for small/medium customer projects
Inspections – includes verifying on an on-going basis the installation of measures. Summary of the inspection process is in Appendix 4.
Internal Project Managers are responsible for the following:
Single point of contact for large customers to assist with their energy efficiency projects. Large customer outreach and education of energy efficiency opportunities.
Providing custom energy efficiency analysis, quality assurance and verification of savings through a pre-contracted group of engineering firms.
Managing engineering firms to ensure program compliance, quality of work, and customer satisfaction.
Managing wattsmart Business projects through the whole project lifecycle. Infrastructure
To help increase and improve the supplier and installation contractor infrastructure for energy-efficient equipment and services, the Company established and developed trade ally networks for lighting, HVAC and motors/VFDs. This work includes identifying and recruiting trade allies, providing program and technical training and providing sales support on an ongoing basis. The current list of the trade allies who have applied and been approved as participating vendors are
Rocky Mountain Power Idaho Report Non-Residential Programs
Page 32 of 37
posted on the Company website and is included as Appendix 7 to this report. In most cases, customers are not required to select a vendor from these lists to receive an incentive.24
The total number of participating trade allies is currently 102. The current count of participating trade allies by technology is in Table 20.
Table 20
Participating Trade Allies25
Lighting trade allies HVAC trade allies Motor and VFD
trade allies
List dated 3-19-2015 67 36 38
Given the diversity of the non-residential customers served by the Company, a pre-approved, pre-contracted group of engineering firms are used to perform facility specific energy efficiency analysis, quality assurance and verification services. Each customer’s project is directly managed by one of the Company’s in-house project managers. The project manager works directly with the customer or through the appropriate Company account manager located in Idaho. Table 21 lists the engineering firms currently under contract with the Company.
Table 21 Engineering Firms
Engineering Firm Main Office Location Abacus Resource Management Company Beaverton, OR
Brendle Group Fort Collins, CO
Cascade Energy Engineering Cedar Hills, UT
Compression Engineering Corp Salt Lake City, UT
Ecova Portland, OR
EMP2, Inc Richland, VA
Energy Resource Integration, LLC Sausalito, CA Energy and Resource Solutions North Andover, MA
EnerNOC Inc. Portland, OR
EnSave, Incorporated Richmond, VT ETC Group, Incorporated Salt Lake City, UT Evergreen Consulting Group Beaverton, OR
Fazio Engineering Weston, OR
kW Engineering, Inc. Salt Lake City, UT
Lincus Incorporated Tempe, AZ
Nexant, Incorporated Salt Lake City, UT QEI Energy Management, Inc. Beaverton, OR RM Energy Consulting Pleasant Grove, UT
Rick Rumsey, LLC Ammon, ID
24
Customers receiving Small Business Lighting incentives do need to use an approved contractor selected from a competitive request for bid process.
25
Some trade allies may participate in more than one technology so the count of unique participating firms is less than the total count by technology.
Rocky Mountain Power Idaho Report Non-Residential Programs
Engineering Firm Main Office Location
SBW Consulting, Inc. Bellevue, WA Solarc Architecture & Engineering, Inc. Eugene, OR Triple Point Energy Portland, OR
Evaluation
During 2014, an independent third-party process and impact evaluation of the Company’s non-residential programs for program years 2012-2013 was in the process of being completed. The results of this evaluation work will be available in 2015.
Rocky Mountain Power Idaho Report Communication
Page 34 of 37
C
OMMUNICATIONS,
O
UTREACH ANDE
DUCATIONThe Company utilizes earned media, customer communications, paid media and program specific media in an effort to communicate the value of energy efficiency, provide information regarding low-cost, no-cost energy efficiency measures, and to educate customers on the availability of technical assistance, services and incentives. wattsmart is an overarching energy efficiency campaign with the overall goal to engage customers in reducing their energy usage through behavioral changes, and pointing them to the programs and information to help them do it.
Customer Communications
As part of the Company’s regular communications to its customers, newsletters across all customer classes promote energy efficiency initiatives and case studies on a regular basis. Inserts and outer envelopes featuring energy efficiency messages and programs have also been used on a consistent basis. In 2014, the Company also issued two newsletters focused entirely on seasonal energy efficiency information targeted in the fall and spring.
The Company also utilizes social media, such as Twitter and Facebook to communicate and engage customers on DSM offers and incentives.
In 2014, the Company initiated a wattsmart advertising campaign. Program Specific
All energy efficiency program marketing and communications are under the wattsmart umbrella to ensure a seamless transition from changing customer behavior to the actions they could take by participating in specific programs. Separate marketing activities administered by and specific to the programs ran in conjunction with the wattsmart campaign.
Home Energy Savings program
Information about the Home Energy Savings program is communicated to customers, retailers and trade allies through a variety of channels. The main areas of focus in 2014 included website enhancements, new wattsmart Starter Kits and duct sealing for manufactured homes.
The website enhancements in April improved navigation, streamlined content and made it easier for customers on mobile devices and tablets to find information and apply for incentives.
In June, the program launched the wattsmart Starter Kits in Idaho. These kits come with ENERGY STAR® lighting and WaterSense® products, depending on the customers’ water heating type. Customer communications for the
kits included direct mail, email, website and social media content, Facebook advertising, newsletters and bill inserts. The communications were successful in driving kit
Rocky Mountain Power Idaho Report Communication
orders. The email to 16,425 customers had a high open rate of 43% and a click-through rate of 15%. Three weeks of Facebook ads also generated 84,791 impressions.
To build awareness about incentives for cooling measures, the program communicated to customers through bill inserts, newsletter articles, point of purchase material, website and social media content, and retail and trade ally training material.
In September, a group of targeted customers living in manufactured homes received a mailing with information on free duct sealing offered through a local participating trade ally.
Refrigerator & Freezer Recycling
The Company promotes the See ya later, refrigerator program through informational television and digital display advertisements and other customer communications. In 2014, the program garnered 278,950 impressions. Breakdown of impressions by media type is shown in Table 22.
For the summer and fall, the Company developed a new creative campaign with a magic theme to highlight the newly increased $50 incentive along with the convenience of having your old fridge recycled. For maximum exposure, these same messages and artwork were used in direct mail, digital advertising, email, social media, website, bill inserts and newsletter articles.
The Company also provided information about the availability for businesses to participate through Idaho chamber outreach and added program information to the business section of the website.
Table 22
See ya later, refrigerator Program Communications Channel 2014
TV 128,000 Digital Display 150,950
FinAnswer Express and Energy FinAnswer/wattsmart Business
During 2014, communications reminded customers to inquire about incentives for lighting, HVAC, compressed air, irrigation and other energy efficiency measures. Radio communications encouraged business customers to make energy efficiency upgrades and print ads featured case study examples from program participants which were repurposed in social media. Quarterly eblasts and digital search ads directed viewers to the company’s website.26 This was in addition to customer direct contact by Company project managers and corporate and community
26
www.wattsmart.com
Rocky Mountain Power Idaho Report Communication
Page 36 of 37
managers, trade ally partners, articles in the Company newsletters, Chamber newsletter outreach and content on the Company website and on Facebook.
wattsmart Business program consolidation became effective November 13, 2014. With the consolidation, the incentive process was streamlined and an enhanced lighting retrofit offering for small business customers was added. Irrigation Energy Savers also became part of the
wattsmart Business program. All the marketing materials were updated for the program change (overview, brochure, irrigation brochure, applications, catalog, case studies, energy management, small business lighting) and added the materials to our streamlined website.
The Company continued to utilize a wattsmart “open sign” for businesses and approved vendors to display. Customers were photographed with the “open sign” and the photos were used in the print advertising, case studies, newsletter articles and on Facebook.
The program’s breakdown of impressions by media type is shown in Table 23.
Table 23
Impressions by Media Type Communications Channel 2014
Radio 294,800 Print 181,196 Eblasts 3,650 Digital Paid Search 62,198
Rocky Mountain Power Idaho Report Evaluations
E
VALUATIONSEvaluations are performed by independent external evaluators to validate energy and demand savings derived from the Company’s energy efficiency programs. Industry best practices are adopted by the Company with regards to principles of operation, methodologies, evaluation methods, definitions of terms, and protocols including those outlined in the National Action Plan for Energy Efficiency Program Impact Evaluation and the California Evaluation Framework guides.
A component of the overall evaluation efforts is aimed at the reasonable verification of installations of energy efficient measures and associated documentation through review of documentation, surveys and/or ongoing onsite inspections.
Verification of the potential to achieve savings involves regular inspection and commissioning of equipment. The Company engages in programmatic verification activities, including inspections, quality assurance reviews, and tracking checks and balances as part of routine program implementation and may rely upon these practices in the verification of installation information for the purposes of savings verifications in advance of more formal impact evaluation results. A summary of the inspection process is included in Appendix 4.
Evaluation, measurement and verification tasks are segregated within the Company organization to ensure they are performed and managed by personnel who are not responsible for program management.
Information on evaluation activities completed or in progress during 2014 is summarized in the chart below. Summary of the recommendations are provided in Appendix 6. The evaluation report is available at www.pacificorp.com/es/dsm/idaho.html
Program / Activities Years Evaluated Evaluator Progress Status
Home Energy Savings 2011-2012 The Cadmus Group Completed Low-Income 2010-2012 Smith & Lehmann Q1 2015 Energy FinAnswer 2012-2013 Navigant Consulting Q2 2015 FinAnswer Express 2012-2013 Navigant Consulting Q2 2015