UNIVERSITY OF
ROCHESTER
Accounting for Global Dispersion of Current Accounts Chang, Yongsung, Kim, Sun-Bin, and Lee, Jaewoo
Working Paper No. 548 May 2009
Accounting for Global Dispersion of Current Accounts
∗
Yongsung Chang
University of Rochester
and
Yonsei University
Sun-Bin Kim
Korea University
Jaewoo Lee
International Monetary Fund
May 18, 2009
Abstract
We undertake a quantitative analysis of the dispersion of current accounts in an open economy version of incomplete insurance model, incorporating important market frictions in trade and financial flows. Calibrated with conventional parameter values, the stochastic stationary equilibrium of the model with limited borrowing can account for about two-thirds of the global dispersion of current accounts. The easing of finan-cial frictions can explain nearly all changes in the current account dispersion in the past four decades whereas the easing of trade frictions has almost no impact on the current account dispersion.
Keywords: Distribution of Current Account, Incomplete Markets, Frictions
JEL Classification: F3; F4
∗We appreciate comments by Mark Bils, Jay Hong, Gian Maria Milesi-Ferretti, David Romer, and
par-ticipants in seminars in the University of Rochester, Korea University, and Yonsei University. The views expressed are those of the authors, and do not necessarily represent those of the IMF or IMF policy.
1.
Introduction
Large current account imbalances often become a source of concern, especially when they are large deficits. The large current account deficit of the U.S. since 2002 has generated much debate on its causes and the need for eventual adjustment.1 And indeed in many
other countries, large current account deficits have often preceded an external crisis, thus stoking fears of an impending gloom when they appear on the balance of payments accounts of emerging markets.
In contrast to this common view that regards large imbalances as a cause for concern, others see a sign of progress in large current account imbalances. Some interpreted the U.S. current account deficit as an outgrowth of an integrated financial market resided by high-saving countries—e.g. high-savings glut view by Bernanke (2006). In this vein, large current account imbalances are a welcome development to the extent they are outcomes of a rising global economic integration (in financial and trade accounts).2
Both views have merits and are fundamentally interrelated, with one point of contact being the global dispersion of current account balances. Potentially consistent with the latter view, the past several decades have seen a rising dispersion of current accounts among a large group of countries as well as a subgroup of advanced economies. It suggests that, as economic integration progresses, countries find it easier to lend and borrow, thereby generating a larger dispersion of current accounts.3 The analysis so far, however, has been largely empirical and
somewhat indirect, not least owing to the paucity of a theoretical analysis of the global distribution of current accounts, with Clarida (1990) marking the most recent analysis.4
We investigate quantitatively the distribution of current accounts and other external balances in a stochastic multi-country model where each country adjusts its consumption and external assets in response to idiosyncratic shocks to its income, subject to frictions in trade and financial accounts. The model enables us to study the determination and evolution
1See Obstfeld and Rogoff (2005), Engel and Rogers (2006), and Caballero and others (2008) on different
views on the matter.
2This view is closely related to the Feldstein-Horioka (1980) puzzle, which implies that observed current
account imbalances are too small to be the results of a fully integrated world financial market.
3See Blanchard and Giavazzi (2002) for consistent evidence and interpretation for the euro area’s
devel-opments, and Faruquee and Lee (2008) for evidence with a larger group of countries. Both papers will be further discussed in the next section.
4As related developments, Bai and Zhang (2008) and Castro (2005) develop quantitative models of global
of the world distribution of current accounts, and its response to changes in frictions in goods and financial markets. The comparison of the effects of frictions in goods and financial markets is motivated by the apparent decline in trade costs over time as well as the thesis of Obstfeld and Rogoff (2000) that trade costs can be the main driver of several anomalies in international economics.
Our model is an open-economy version of the incomplete insurance model of Bewley (1986), Aiyagari (1994) and Huggett (1995), and captures precautionary and self-insurance considerations that underlie lending, borrowing, and consumption decisions in the presence of liquidity constraint. The world economy comprises a continuum of countries, each of which is populated by a representative household endowed with a stochastic income. Countries engage in goods trade subject to an iceberg cost of trade, and have access to the world capital market that is incomplete and subject to several frictions. Calibrated with conventional parameter values, the model accounts for about two-thirds of the global dispersion of current accounts. We also find that the easing of financial frictions has a greater effect on the dispersion of current accounts than the easing of trade frictions. Finally, we examine the implications on several stylized facts, including the persistence of current accounts and international risk sharing.
The paper is organized as follows. Section 2 documents strong trends in global disper-sion of current accounts, net foreign assets, and trade balances in the past four decades, and Section 3 lays out our benchmark model of world economy where countries engage in international trade and financial transactions subject to frictions. In Section 4, we calibrate the model economy and match the observed pattern of international trade and finance (e.g., average import-GDP ratio and net foreign asset distribution) for year 2000, in the face of stochastic relative income shocks which are estimated from the de-trended GDP data of 80 countries over 40 years. We then ask whether decrease in frictions can account for the observed trends in current accounts of Section 2, as well as exploring the implications on several stylized facts about current accounts. Section 5 concludes.
2.
Global Dispersion of Current Accounts
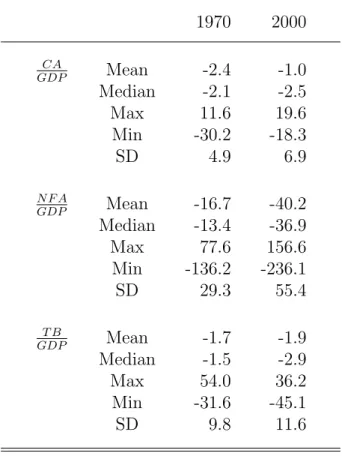
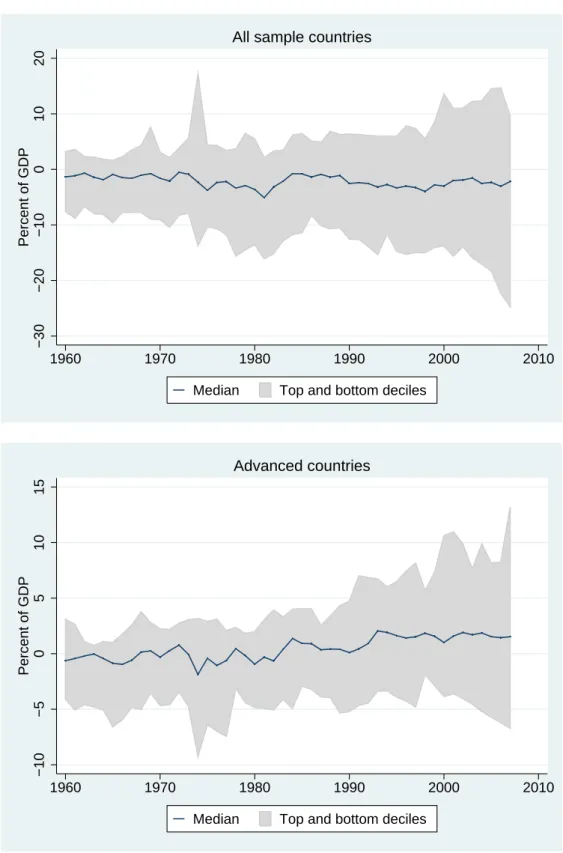
The dispersion of current account balances has been increasing over the past several decades. Figure 1 shows, for each year from 1960 to 2004, the 80-percent range that comprises the current account in percent of GDP except for the top and bottom deciles (thus from 10 to 90 percent, when ranked numerically). The top panel illustrates the near doubling in the width of the 80-percent range of current account balances. For example, between 1970 and 2004 the cross-sectional standard deviation of current account balance to GDP ratio increased from 4.9% to 6.9% (Table 1). This upper panel is based on the sample that rose from 70 countries in 1970 to about 120 countries in 2004 (after having started with 50 countries in 1960). The same pattern is seen in the bottom panel that is based on the advanced-country sample that started with 18 countries in 1960 and 1970, adding three countries to comprise 21 countries in 2004. The 80-percent range has widened visibly in this graph as well, where the particularly rapid widening in recent years would reflect the deepening of global current account imbalances.
A similar widening in global dispersion is found for net foreign asset positions and trade balances, both measured in percent of GDP. Figures 2 and 3 show the 80-percent range for net foreign assets and trade balances, both for the larger sample of about 120 countries as of 2004 and for the more balanced sample of about 20 advanced countries. The dispersion of net foreign assets has increased rather dramatically, more than the dispersion in both current accounts and trade balances.5 For example, between 1970 and 2000, the
cross-sectional standard deviation of net foreign asset to GDP ratio increased from 29.3% to 55.4% in Table 1. The dispersion in trade balances has increased also, though somewhat less than the dispersion in net foreign assets or current accounts. Between 1970 and 2000, the cross-sectional standard deviation of trade balance to GDP ratio has increased from 9.8% to 11.6%.
The rising dispersion of current accounts over the past several decades has been high-lighted in several earlier papers. Blanchard and Giavazzi (2002) documented the rising dispersion of current accounts in European countries, and associated it with the improving
5In both current account and net foreign assets, the impressive rise in the gross positions has been well
documented, including in Lane and Milesi-Ferretti (2007) for gross external asset and liability positions, and numerous references that documented the rise in exports and imports.
financial integration, including the launch of the euro area. Faruqee and Lee (2008) examined a sample of nearly 100 countries and found an underlying trend-increase in the dispersion of current accounts. They also found evidence in support of financial integration as the main contributing factor to the rising dispersion, while finding little support for trade openness as a contributing factor.
Over a longer haul, Obstfeld and Taylor (2004) have reported the evolution in the dis-persion of current accounts since the late-1800s. They attribute this centurial movement to underlying financial integration, intertwined with the trilemma of international economics. In particular, they find the standard deviation of current accounts among 15 sample coun-tries was highest in the early 1900s (prior to the First World War), which they view to have been a period of a highly integrated world capital market, comparable to the 2000s.6
3.
Theory
3.1.
Motivation
We undertake a quantitative theoretical analysis of the dispersion of current accounts, in-corporating several important frictions. A theory of distribution requires us to go beyond a typical two-country framework to a multi-country model. We turn to the incomplete insur-ance model with multiple (infinitely many) agents that originated with Bewley (1980) which was further developed by Clarida (1990) in international context and by Aiyagari (1994) and Huggett (1995) in domestic context among others. Faced with incomplete insurance and a limit to borrowing, each country (agent) accumulates assets as a way of self-insurance, in the face of idiosyncratic shocks to its income. In equilibrium, a stationary distribution emerges for endogenous variables including current accounts.
This model captures important precautionary and self-insurance motives behind lending, borrowing, and consumption decisions which arise in the presence of liquidity constraint, although the liquidity constraint itself is not derived from first principles (the same interpre-tation as in just cited papers).7 Because countries are limited in the amount they can borrow
6For interest rate spread-based evidence on the high international integration of capital markets in the
pre-war period, see Mauro and others (2006).
7For papers that focus on modeling liquidity constraints in two-country settings, see Aguiar and Gopinath
in certain states of nature, they accumulate assets as a precaution against such events. This precautionary motive does not require and is independent of the convexity of marginal util-ity that is postulated as the basis of precautionary savings in small open-economy models (Obstfeld and Rogoff (1995) and references therein).
One innovation of our model, compared with the conventional incomplete insurance model, is the introduction of the spread between the lending and borrowing interest rates which we interpret to reflect the cost of financial intermediation. This spread in interest rates, discourages countries from borrowing too frequently and reinforces their incentive to accumulate assets for self-insurance in the face of borrowing constraints. As a result, the spread plays an important role in matching the shape of the stationary distribution of net foreign assets and current accounts (more details in Section 4).
Besides constructing the most compact model of dispersion, the modeling choice is mo-tivated by the debate on incomplete risk sharing in the international economics literature. Financial market frictions have been viewed as a primary cause of several well-known phe-nomena of incomplete risk sharing across countries, including low international correlation of consumption and home bias in international equity allocation. More recently, phenome-nal accumulation of internatiophenome-nal reserves in emerging markets has been attributed to self-insurance motive, in the absence of fully developed market for self-insurance.8
Compared with the earlier works by Clarida (1990), our model forms the basis of a quantitative analysis of the global dispersion of current accounts. We also focus on the effect of various frictions on the global dispersion of current accounts, where relative income shocks are the only source of heterogeneity. Clarida (1990) had explored the current account level effects of high and low levels of discount rates, in qualitative terms. Without focusing on the evolution of the current account dispersion, two recent papers have developed quantitative models of global equilibrium that build up on Clarida’s work. Castro (2005) investigates whether technological shocks can explain income dispersions, and Bai and Zhang (2008) explore the role of financial frictions in explaining the Feldstein-Horioka puzzle. Of course, these papers share the characteristic that the stationary distribution of current accounts is invariant to the initial asset holdings and endowments.
3.2.
Model
We study a world economy with continuum (measure one) of countries. Each country is populated by a representative household who faces a stochastic endowment xt which is
assumed to vary exogenously according to a stochastic process with a transition probability distribution functionπx(x0|x) = Pr(xt+1 ≤x0|xt=x) over support [x,x¯]. There is no global
(world-wide) uncertainty. Countries have access to a world capital market where they trade one-period consumption loans, and can borrow up to a certain limit.
A country maximizes the following utility:
E0 ∞ X t=0 βtc 1−γ t −1 1−γ ct = [φcdt1− 1 η + (1−φ)c f t1− 1 η] η η−1 subject to: at+1 =xt−cdt−(1 +τ)cf t+ (1 +r)at.
The net holdings of foreign claims is denoted byat. A country faces an exogenously imposed
borrowing constraint, ¯a, which is set at a level larger than the natural limit, −x/rB. We
assume that there is a spread between the lending rate (rL) and borrowing rate (rB) so that
rL < rB: that is, r = rL when a
t > 0 and r =rB otherwise. This spread in interest rates,
reflecting the cost of financial intermediation, reinforces a country’s incentive to accumulate assets for self-insurance in the face of borrowing constraints (more in Section 4).
A country would like to consume both domestic- and foreign-produced goods. The do-mestic consumption cdt is constrained by its endowment xt (cdt ≤ xt). The consumption of
foreign goods cf t requires an import cost denoted by τ (the familiar iceberg cost of trade,
reflecting a transportation cost or trade restrictions). For simplicity, we assume that both domestic and foreign goods are treated identically in the world goods market (thus the rel-ative price of foreign goods in the domestic market is just 1 +τ always and everywhere). A country’s trade balancetbt and current account cat are then:
tbt=xt−cdt−(1 +τ)cf t, cat=at+1−at=tbt+ © rB+ (rL−rB)1{at>0} ª at
It is convenient to express the country optimization problem in a recursive form: V(a, x;rL, rB) = max ½ c1−γ−1 1−γ +βE £ V(a0, x0;rL, rB)|x¤ ¾ (1) s.t. c= [φc1− 1 η d + (1−φ)c 1−1 η f ] η η−1, cd≤x, a0 =x−c d−(1 +τ)cf + (1 +rL)a, if a≥0, a0 =x−cd−(1 +τ)cf + (1 +rB)a, if a <0, a0 ≥¯a.
Each country’s optimal decision rules for consumptions and asset holdings can be derived as functions of two state variables a and x: cd(a, x), cf(a, x), a0(a, x), under a given set of
interest rates rL and rB. The competitive equilibrium for the world economy consists of
these decision rules for consumptions and asset holdings, interest rates, and the invariant distribution µ(a, x)9 that satisfy the following conditions.
1. Individual countries optimize:
Given rB and rL, the individual country’s decision rules c
d(a, x), cf(a, x) and a0(a, x)
solve the optimization problem in (1). 2. The world goods market clears:
Z © x−cd(a, x) ª dµ= (1 +τ) Z cf(a, x)dµ
3. The world capital market clears:
Z
a0(a, x)dµ= 0.
4. The distribution µis time invariant: for any A0 ⊂ A and X0 ⊂ X,
µ(A0, X0) = Z A×X ½ Z A0,X0 1{a0=a0(a,x)}dπ(x0|x)da0dx0 ¾ dµ
9LetAandX denote sets of all possible realizations ofaandx, respectively. The distribution isµ(a, x)
Each country’s optimal decision rules and the market clearing condition in goods and capital markets are the same as in any equilibrium model. A distinguishing point is the fourth condition on the time-invariant measure, the equilibrium distribution of net foreign assets that is endogenously determined in our model. Combining the equilibrium distribution
µ(a, x) with other optimal decision rules, we can derive the global (equilibrium) distribution of other endogenous variables, including the current account and trade balance.
4.
Quantitative Analysis
4.1.
Calibration
We briefly explain the choice of the model parameters. The unit of time is a year. We assume that the log of a country’s endowment (relative income shock) x follows an AR(1) process: lnx0 =ρ
xlnx+εx, where εx ∼N(0, σx2). We estimate ρx and σx by estimating the
AR(1) process of linearly de-trended log per capita GDP of 80 countries for the period of 1961-2003 from the Penn World Table version 6 (PWTv6). The regression includes annual time dummies and country dummies to control for, respectively, global shocks and country fixed effects.10
ˆ
yt=0.863 ˆyt−1+et, σˆe= 0.0493 R¯2 = 0.81.
where ˆytis linearly de-trended log per capita GDP at timet. The estimate for the persistence
is 0.863 (witht-ratio of 57) and the standard error of regression is 0.0493. We setρx = 0.863
and σx = 0.0493.
The relative risk aversion (γ) is 2, and the discount factor (β) is 0.96, following the standard practice in the literature. Following Obstfeld and Rogoff (2000), the elasticity of substitution between consumptions of domestic and foreign goods (η) is 6. According to Anderson and van Wincoop’s (2004) survey article, trade costs (inclusive of tariff and other factors) is estimated at 48-63%. We set τ = 0.5. Given τ and η, we set the relative weight on domestic goods in the CES utility function (φ = 0.475) to match the average ratio of expenditures on domestic to foreign goods, 4.2 in Obstfeld and Rogoff (2000).11 With these
10Since we de-trend each country’s log per capita GDP by the country-specific linear trend which is
compatible with the observed speed of long-term growth of each country, the remaining idiosyncratic shocks are largely orthogonal to the long-term dynamics of economic growth and income convergence.
values the model generates the average import-GDP ratio of 19% in the steady state, close to the level touted in the literature (also close to what we observe in 2000).
For the benchmark economy, we assume that the interest rate spreadψ =rB−rLis 1.5%
based on the 1–3% range of the historical spread between borrowing and lending rates in the U.S., which would form the lower end of the spread between lending and borrowing rates faced by many other countries.12 Finally, we set the borrowing limit ¯a=−1.5 (implying that
a country can borrow from abroad up to 150% of its average GDP) at the lower bound of the NFA-to-GDP ratios of advanced economies in 2000.13 Table 2 summarizes the parameters.
4.2.
Benchmark Economy
We find the equilibrium interest rate ˜r (rB = ˜r + 0.5ψ and rL = ˜r−0.5ψ) and invariant
distribution of µ(a, x) that clears the world capital market. The market clearing rate ˜r is 4.06%, implying the lending rate of 3.3% and the borrowing rate of 4.8%.
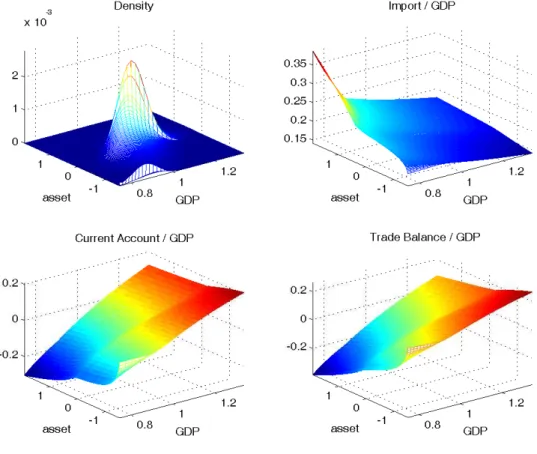
Figure 4 shows the stationary distribution of probability density, import-GDP ratios, trade balances, and current account balances of the model. International trade balance and current account positions conform with the precautionary savings motive. Looking at the second row of the figure, in times of a higher income, countries choose to increase their savings, and thus current and trade account balances increase (surplus). As a larger share of income is set aside for savings, imports decline slightly as a share of income. For a given level of income, countries with higher asset holdings can afford a higher level of consumption, showing deficits in trade balance and current account.
et al., 2008), and the share of non-traded goods is usually put at 0.5 in the literature (an exception being 0.45 used by Corsetti et al.). The ratio of domestic to foreign expenditure will be 0.75
0.25 = 3 (combining Stockman
and Tesar with the usual ratio between tradable goods and non-tradable goods), or1−0.55×0.28
0.55×0.28 = 5.5 (Corsetti
et. al), with the Obstfeld-Rogoff (2000) number of 4.2 in the middle.
12We calculated the U.S. spread as the difference between bank prime loan rates and 6-month CD rates,
obtained from FRB website. Bank prime loan rates are majority prime rate charged by banks on short-term loans to business, and was thus compared to 6-month CD rates which we viewed to have risk and maturity profiles comparable to those of bank prime loans. Between 1981 and 2007, this spread ranged from a low of 1.2% in 1987 to a high of 3.25% in 2001, with the average at 2.37%. We choose a value on the lower half of this interval as a measure of the cost of financial intermediation, akin to trade costs. Spreads in international lending (e.g. sovereign spreads on emerging markets) are often much larger, but a significant part of it is attributed to risk premium rather than the cost of financial intermediation. And refer to Homer and Sylla (1991) for historical data on spreads.
13The smallest NFA-to-GDP ratio was 1.49 for the advanced-economy sample, and the ratios were smaller
in preceding years. The value 1.5 corresponds to 98% lower bound of the NFA-to-GDP ratio of the whole sample including developing countries, which reflect non-market-based financing in highly indebted countries.
Figure 5 exhibits the histogram of current accounts, trade balances and net foreign assets, implied by the stationary distribution. Current accounts and trade balances are distributed mostly within the range of 20 percent of GDP on both sides (most of them falling between -10% and 10% of GDP). Net foreign assets, on the other hand, are distributed over a much wider range stretching from -200% to 200%, with the bulk of the mass concentrated between -100% and 100%. Note that net foreign assets smaller than -150% of GDP corresponds to the times when the income is smaller than the average income level relative to which the borrowing limit is set (at -150%).
The existence of a spread between borrowing and lending rates plays an important role in reducing both the spike on the left-to-center of the current account distribution and the fat right tail of the net foreign asset distribution. Without a spread, the net foreign asset exhibits an extremely skewed distribution, with a thick concentration of densities on the borrowing side. And the current account distribution exhibits a spike on the borrowing side (i.e. to the left of the center). Under the spread between borrowing and lending interest rates, the borrowing becomes more costly and lending becomes less profitable, and countries refrain from borrowing frequently and instead accumulate more assets for self-insurance. This reduces the spike in current account distribution (which corresponded to a small current account deficit occurring frequently), as well as reducing the extreme skewness of the net foreign assets distribution. The resulting distributions of the current account and net foreign assets come much closer the shape of actual distribution of net foreign assets and current accounts.
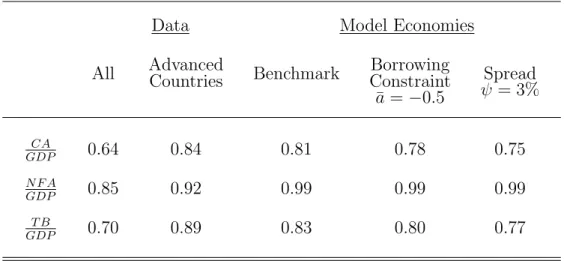
The global dispersion of external balances obtained from the benchmark model is com-parable to the actual 2000 data.14 Under the benchmark model, the standard deviation of
the ratio of net foreign assets to GDP is 55 percent in Table 3, equal to the 2000 value of the standard deviation in data. The standard deviation of the current account is 5 percent, slightly more than 2/3 of the actual 2000 value, and that of the trade balance is about 1/2 of the actual 2000 value. The relatively small dispersion of trade balance in the benchmark model is probably due to the absence of fluctuations in the terms of trade, which would add
14The choice of 2000 as the benchmark comparator reflects the subsequent swelling of global current
ac-count imbalances which some view as having been associated with the build-up of global financial imbalances, and also partly the availability of consistent data in the published version of Lane and Milesi-Ferretti (2007) paper.
to the dispersion in trade balance by increasing the variation in the value of trade balance for a given movement in trade volume.
Using parameter values that are consistent with the data and literature, we have been able to account for the bulk of the global dispersion in current accounts and net foreign assets around 2000. The primary source of dispersion is the heterogeneity in income, measured relative to each country’s trend growth, implying that the insurance motive alone has the potential to account for a large part of the dispersion in current accounts, subject to a widely accepted degree of frictions in the flow of goods and finance.
4.3.
Economies under Greater Frictions
Returning to the rising dispersion in current accounts discussed in Section 2, we ask what factors lie behind the rise in dispersion between 1970 and 2000.15 We do it in reverse, by
considering three cases with greater frictions (namely tighter constraints) in the economy. We first consider goods market frictions, by increasing the trade cost (τ) to 0.7, which lowers the average import-GDP ratio from 19% to 10%. This decline is consistent with the observed change in import-GDP ratio between 2000 and 1970 (assuming intermediate imports to be about a half of gross imports, or to remain a constant percent of gross imports). According to column (4) of Table 3, the change in the trade cost brings about little change in the dispersion of external balances, however. While the shares of both exports and imports decrease, there is little change in the standard deviation of current accounts, net foreign assets, and trade balances because the trade cost affects exports as well as imports.
We then consider capital market frictions, in two separate directions. The borrowing constraint is tightened to ¯a = −0.5 from −1.5 of the benchmark model,16 and the interest
rate spread is increased to ψ = 3% (close to the upper end of historical interest rate spread for the U.S. discussed in Section 4.1) from 1.5% of the benchmark model. In both cases, the dispersion of external balances falls by a large margin that is almost comparable to the change in data between 1970 and 2000. Under our parameter choices, the decline is starker
15We choose 1970 because the sample size is substantial by that time, and because the world economy had
moved sufficiently close to the breakdown of the Bretton Woods regime that regulated international capital flows much more tightly than later (Obstfeld and Taylor, 2004).
16For the 1970 data, the smallest NFA-to-GDP ratio was 0.35 for advanced-economy sample, and the value
0.5 corresponds to the 90% lower bound of the NFA-to-GDP ratio of the whole sample including developing countries.
when the spread is increased than when the borrowing limit is tightened, but there is no direct comparing the severity of two types of capital market frictions.
According to the data, the dispersion of net foreign assets in 1970 (29.3%) is about 53% of that in 2000 (55.4%). The dispersion of current accounts in 1970 (4.9%) is about 70% of that in 2000 (6.8%). According to the model, with a tighter borrowing constraint, the dispersions of net foreign assets and current accounts decrease by 38% (from 55.4 to 34.4%) and 20% (from 5 to 4%), respectively (Table 3 Column (5)). With a larger spread (3%) between borrowing and lending rates (Column (6)), the dispersion of net foreign asset falls more dramatically. It decreases by 55% (from 55.4 to 25%). As a result, the dispersion of current account decreases by 37% (from 5% to 3.3%), more than the change in the data.
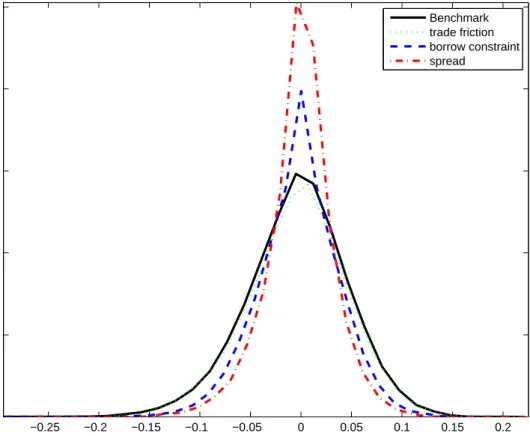
Figure 6 shows the distribution of current account balances for each model specifications: benchmark, a larger trade frictions (τ = 0.7), a tighter borrowing constraint (¯a=−0.5), and a larger spread (ψ = 3%). The change in the cost and availability of borrowing and lending is found to have a direct and visible effect on the consumption/saving decision. In contrast, trade frictions appear to have the primary effect on the intra-temporal choice between home and foreign-good consumptions, while having only a secondary effect on the inter-temporal choice between consumption and saving. These results are consistent with existing papers (discussed in Section 2), in that the international financial integration has likely been the leitmotif behind the increase in the dispersion of current accounts.
The limited role of trade costs contrasts with Obstfeld and Rogoff (2000) proposal that trade costs could be the main driver of the spread between lending and borrowing rates, especially when the spread has a significant influence on the current account dispersion in our model. This contrast stems from the fact that our model does not allow the “reversal” of imports that is critical to generating the interest rate spread in the Obstfeld and Rogoff analysis. If a country imports home-producible goods when income and savings are high, at a price higher than the price at which the country will export the same goods when its income is low, then the country’s real interest rate on lending can be lower than its real interest rate on borrowing. While the reversal of imports (importing a good in one period and exporting it in another period) is critical for this channel, our model precludes this channel by construction. More important, the data suggests that countries are not likely to experience such reversal of imports at a large scale, corroborated in our own model
calibration by the limited size of idiosyncratic shocks which is smaller than the share of imported goods. Despite this contrast, our model is in partial agreement with the Obstfeld and Rogoff analysis, in indicating that the spread between lending and borrowing rates has a powerful effect on international flows of finance.
4.4.
Comparing Stylized Facts among Model Economies
We now compare our model economies, those with different financial market frictions, in terms of several well-known stylized facts that have implications on academic and policy research. We first generate simulated panel data (500 countries for 1000 years) on the basis of the equilibrium distributions of different model economies, and then estimate several stylized facts for each of the panel data that represent economies with different degrees of financial frictions (corresponding to different sizes of current account dispersion). This provides us with one method of comparing the effect of the underlying changes (in financial market integration) on the estimated stylized facts.
The merit of this exercise stems from the inevitable difficulty of discerning empirically the effect of ongoing financial integration, or of any gradually advancing structural changes. When the change in question stretches over the whole sample period (read four decades), providing minuscule variation between adjacent sample years, the effect could be easily swamped in data by other shocks, making it difficult to extract from data the effect of slow-evolving changes.
We start with the stationarity of current accounts, which has attracted attention partly because it would matter for many time-series studies of open-economy models. No less important, the stationarity of current accounts has a particular significance as the necessary condition for the inter-temporal budget constraint to hold (Obstfeld and Taylor 2005), which in turn would be necessary for the current account imbalances to be sustainable. The current account series has been found to be highly persistent, at times to the point of defying stationarity.
In our model economies, we find that the persistence of current accounts increases with the degree of financial integration among world economies (Table 4). Compared with the estimated persistence from the data over the 1970–2000 period, the persistence of model economies lies between the estimates obtained from the whole sample and the
advanced-country sample.
When we apply Dickey Fuller test to a sample corresponding to “thirty years” to test for the unit root formally, the unit root is rejected at 5% significance level only for one out of every six countries (to be more exact 78 cases out of 500, and 15.6% of the sample). And the rejection rates of unit root hypothesis are higher in model economies with tighter constraints: 27.2% in the model with a larger spread and 19.8% in the model with a smaller (tighter) borrowing limit. In all these models and especially in the benchmark model, the rejection of unit root is more of a rarity, when the data have been generated as a stationary series in model economies. While this is another instance of the weak power of unit root tests applied to a finite-sized sample, it suggests that we do need to exercise caution in studying stationarity of current accounts on the basis of data that is both finite-sized (three or four decades) and influenced by ongoing changes (rising financial and trade integration of world economy).
Aside from the issue of stationarity, the persistence of current accounts provides a measure of the speed of adjustment, namely the speed with which current account imbalances correct themselves.17 From our model economies, we find current accounts to have larger AR(1)
coefficients in financially more integrated economies, and will thus expect current account imbalances to have a longer duration in financially more integrated economies. Another way to look at this is the distribution of current account imbalances in our panel data. Table 5 reports the top and bottom 5 and 10 percent current account imbalances for our three model economies, as well as for the data in 1970 and 2000. Model economies show rising dispersion of current account imbalances, consistent with the often-voiced view that financial integration leads to larger (sustainable) imbalances in current accounts. Comparing them with the data in 1970 and 2000, there were more countries with larger deficits than in model economies (fatter tails on the deficit side in data), raising the possibility that quite a few countries could have been running excessive deficits, consistent with subsequent episodes of crisis or sharp current account reversals.18 On the surplus side, while the 1970’s data show smaller
17See Faruquee and Lee (2008) for regression evidence that the persistence varies with financial market
openness. Consistent evidence is also reported in Chinn and Wei (2008), while the paper’s main focus is the lack of correlation between the persistence and the exchange rate regime.
18Our model economies would exhibit episodes of rapid reversal of current accounts, but by construction,
surpluses than in model economies, the 2000’s data show larger surpluses than in model economies, lending credence to the view that some countries may be running excessively large current account surpluses, larger than the level consistent with global equilibrium.
We now ask how close our benchmark economy is to the full international risk sharing, which has served as the reference point and source of puzzles in the literature. In our bench-mark economy that was calibrated to mimic the 2000 data, the equilibrium leaves a very large distance to the first-best outcome that would prevail under complete insurance. Under full consumption risk-sharing and without frictions in goods and financial markets, each country would consume an equal share of the world income.19 The distribution of consumption is
less dispersed than the distribution of income, reflecting the partial insurance, but is not even close to being degenerate as would be the case under complete risk sharing. At the same time, financial integration does improve risk sharing: the distribution of consumption is less dispersed in the model economy with a higher financial integration.
Similar results follow from the comparison of the correlation of consumption growth rates. We take thirty-year worth of simulated data, and calculate bilateral correlations of consumption growth rates between economy 1 and the remaining 499 economies. The mean value of correlations is 0.031, with standard deviation of 0.495.20 Compared to the
zero correlation among idiosyncratic income shocks, the positive average correlation suggests that consumption risk sharing is at work, but at a level far from the full risk sharing which would produce the bilateral correlation coefficient of one. Rather, the model economy is closer to the actual data, where the correlation among consumptions has been found to be slightly smaller than the correlation among outputs—in our model economies, the output correlation is zero, to which the consumption correlations are closer (though still larger) than the value of one that would prevail under complete risk sharing.
19In our model, some dispersion can exist even under complete insurance, if some countries are constrained
by the supply of domestic goods in low-income states. In our benchmark economy, however, the (estimated) size of relative income shocks is very small, generating virtually no countries that are constrained by the supply of domestic goods, allowing us to use the degenerate distribution of consumption as the predicted outcome of complete risk sharing.
20The mean correlation is a slightly lower value of 0.028 and 0.030, respectively, in the economies with a
4.5.
Discussion
With distinct attention on the cross-section dimension of current accounts, our paper takes an under-explored path to understanding current account dynamics. We now elaborate on the relationship of our approach to the related literature, which is more ample than it may appear at the outset. We are after all calling for a multi-country equilibrium approach to the question of current accounts that are becoming increasingly multilateral with the progress of trade and financial integration of the world economy.
The first is the Feldstein-Horioka (1980) puzzle, which can be interpreted as saying that the dispersion of current accounts is too small. In this paper, we provided a first pass to this aspect of the Feldstein-Horioka puzzle, and tentatively concluded that the dispersion is small compared to full risk-sharing, and that the even smaller dispersion of the past can be explained by a model with tighter financial market frictions.21 In this regard, our results
complement those that seek the answer to the Feldstein-Horioka in financial markets.22
The importance of financial frictions in accounting for current account dispersion is con-sistent also with a few historical studies of international financial market. As mentioned earlier, Obstfeld and Taylor find that the dispersion of current accounts—measured as the mean absolute value and the standard deviation of current account-to-GDP ratios of 15 countries—has been at its largest in the period leading up the First World War, which is viewed as the period of highest financial international financial integration. Mauro, Suss-man and Yafehand (2006) provide corroborating evidence that the sovereign debt market of London was indeed highly liquid in the pre-war years, probably more so than today’s market. From a theoretical viewpoint, the absence of growth dynamics could be a source of concern. We do not find this to be a major source of empirical concern. For one, our estimates of idiosyncratic shocks are consistent with different growth rates across countries. More important, theoretical prior notwithstanding, no convincing evidence has been documented for the international flow of capital into developing countries (Lucas 1990), and the absence
21We do not regard the absence of physical investment to affect our qualitative finding on the role of
financial frictions, although it may influence the quantitative dimension because physical capital provides a domestically-based means of alternative to wealth accumulation via net foreign assets. A model which incorporates physical capital is in progress.
22As Obstfeld and Rogoff (2000) remark, there has been no dearth of explanation, although financial
market causes have long been suspected as an important cause. See aforementioned Bai and Zhang (2008) for a recent quantitative study in this vein.
itself has been attributed to financial market frictions (see Gertler and Rogoff (1990) for an early paper). This lack of capital flows induced by growth or convergence dynamics is not particularly surprising in light of the Feldstein-Horioka puzzle, and has been confirmed in several recent studies (e.g. Aizenman, Pinto and Radziwill, 2004).23
The results of this paper have been obtained on the basis of the heterogeneity in income only, while actual current accounts would be influenced by several other heterogeneities. In particular, the heterogeneity in demographic trends has been much debated as the driver of current accounts. Other drivers of current accounts include fluctuations in the terms of trade, alternative forms of financial instruments, and investment dynamics. It is left for future work to incorporate these factors into a similar multi-country equilibrium analysis of current accounts, and we are making progress with incorporating investment dynamics.
5.
Conclusion
We develop and explore a simple multi-country model of the global distribution of current account balances. In the face of incomplete markets, countries accumulate foreign assets to provide for rainy days, in an effort of self-insurance. Combined with the diversity in shocks to each country’s income, this insurance motive leads countries to display a well-defined distribution of current account surpluses and deficits.
The bulk of current account dispersion can be explained by our model calibrated with standard parameter values. We find that tighter frictions in financial or trade transactions tend to narrow the dispersion of current accounts, offering an explanation of the smaller dispersion in the past. In particular, the financial frictions have a substantial effect on the dispersion, greater than the trade frictions.
To distill time-series implications of the changing global dispersion (or financial inte-gration), we use simulated data to estimate several standard empirical relationships. The current account series is found to have a high persistence. And often the unit root hypothe-sis cannot be rejected, even when the simulated data were generated in a stationary model. The simulated data are also found to leave a large distance to a complete consumption risk sharing.
23Some papers even claimed that capital flows in the reverse direction, from rich to poor countries or from
References
[1] Aiyagari, 1994, “Uninsured Idiosyncratic Risk and Aggregate Saving,”Quarterly Jour-nal of Economics.
[2] Aizenman, Joshua, Brian Pinto, and Artur Radziwill, 2004, “Sources for Financing Domestic Capital — Is Foreign Saving a Viable Option for Developing Countries?, NBER Working Paper 10624.
[3] Aguiar, M. and Gita Gopinath. 2006. “Defaultable Debt, Interest Rates, and Current Account,” Journal of International Economics, 69(1), 64-83.
[4] Bai, Yan and Jing Zhang. 2008. “Solving the Feldstein-Horioka Puzzle with Financial Frictions.” Manuscript, University of Michigan.
[5] Bewley, Truma, 1986, ”Stationary Monetary Equilibrium with a Continuum of Indepen-dently Fluctuating Consumers,” inContributions to Mathematical Economics in Honor of Gerard Debreu
[6] Blanchard, Olivier J. and Giavazzi, Francesco. 2002. ”Current Account Deficits in the Euro Area. The End of the Feldstein Horioka Puzzle?” Brookings Papers on Economic Activity 2002 (2): 147-209.
[7] Caballero, Ricardo, Emmanuel Farhi, and Pierre-Olivier Gourinchas, 2008, “Financial Crash, Commodity Prices and Global Imbalances,” Manuscript, MIT.
[8] Caballero, Ricardo and Stavros Panageas, 2008, “Hedging Sudden Stops and Precau-tionary Contractions: A Quantitative Framework,”Journal of Development Economics, 85(1-2): 28–57.
[9] Castro, Rui, 2005, “Economic Development and Growth in the World Economy,”Review of Economic Dynamics, 8(1): 195-230.
[10] Chinn, Menzie D. and Hiro Ito, 2006, “What Matters for Financial Development? Cap-ital Controls, Institutions, and Interactions,” Journal of Development Economics61(1): 163-92.
[11] Chinn, Menzie D. and Shangjin Wei, 2008m, “A Faith-based Initiative: Does a Flexible Exchange Rate Regime Really Facilitate Current Account Adjustment?” Manucript, University of Wisconsin.
[12] Clarida, Richard, 1990, “International Borrowing and Lending in a Stochastic Station-ary Equilibrium,” International Economic Review, 31: 543–58.
[13] Corsetti, Giancarlo, Luca Dedola, and Sylvain Leduc, 2008, “International Risk Sharing and the Transmission of Productivity Shocks,” The Review of Economic Studies, 75: 443-73.
[14] Engel, Charles and John H. Rogers, 2006, “The U.S. Current Account Deficit and the Expected Share of World Output,” Journal of Monetary Economics53: 1063–93.
[15] Faruque, Hamid and Jaewoo Lee, 2008, “Global Dispersion of Current Accounts: Is the Universe Expanding?” IMF Staff Papers: forthcoming.
[16] Feldstein, Martin and Charles Horioka. 1980. “Domestic Saving and International Cap-ital Flows.” Economic Journal 90: 314-29.
[17] Huggett, M., 1996, “Wealth Distribution in Life-Cycle Economies,”Journal of Monetary Economics 38:469–94.
[18] Gertler, Mark and Kenneth Rogoff, 1990, “North-South lending and endogenous do-mestic capital market inefficiencies,” Journal of Monetary Economics, 26 : 245-66. [19] Gourinchas, Pierre-Olivier, and Olivier Jeanne. 2008. “Capital Flows to Developing
Countries: The Allocation Puzzle.” Manuscript, University of California at Berkeley. [20] Homer, Sydney and Richard Sylla. 1991. A History of Interest Rates (3rd edition).
Rutgers University Press: New Brunswick.
[21] Lane, Philip and Gian Maria Milesi-Ferretti, 2007, “The External Wealth of Nations Mark II: Revised and Extended Estimates of Foreign Assets and Liabilities,” Journal of International Economics 73 : 223-50.
[22] Lee, Jaewoo, 2008. “Option Pricing Approach to International Reserves,” Review of International Economics, forthcoming.
[23] Lucas, Robert, 1990, “Why Doesn’t Capital Flow from Rich to Poor Countries?,” Ame-rian Economic Review, 1990, 80: 92-96.
[24] Mauro, Paolo, Nathan Sussman, Yishay Yafeh, 2006, Emerging Markets and Financial Globalization, Oxford University Press: Oxford.
[25] Mendoza, Enrique, Vincenzo Quadrini, and Victor R´ıos-Rull, 2008. “Financial Inte-gration, Financial Development and Global Imbalances,” Manuscript, University of Minnesota.
[26] Obstfeld, Maurice and Ken Rogoff, 1995,Foundations of International Macroeconomics, MIT Press: Cambridge.
[27] Obstfeld, Maurice and Ken Rogoff, 2000, “The Six Major Puzzles in International Macroeconomics: Is There a Common Cause?” NBER Macroeconomics Annual 2000. [28] Obstfeld, Maurice and Ken Rogoff, 2005, “Global Current Account Imbalances and
Exchange Rate Adjustments,” Harvard University Mimeo.
[29] Obstfeld, Maurice, Jay C. Shambaugh, and Alan M. Taylor, 2008, “Financial Stability, the Trilemma, and International Reserves,” NBER WP.
[30] Obstfeld, Maurice and Alan M. Taylor, 2005, Global Capital Markets: Integration, Cri-sis, and Growth, Cambridge University Press: New York.
[31] Stockman, Alan C, Tesar, Linda L, 1995. “Tastes and Technology in a Two-Country Model of the Business Cycle: Explaining International Comovements,” American Eco-nomic Review, 85(1), 168-85.
[32] Taylor, Alan. 2002, “A Century of Current Account Dynamics,”Journal of International Money and Finance 21(6): 725-48.
A.
Data Appendix
A.1.
National Incomes
The National Income Accounts (NIA) data are from the Penn World Table Version 6.2 (2006), PWT memnonics are in parenthesis. The PWT provides two types of price and quantity indices: (1) ‘current price’ estimates based on Geary aggregation of international current prices for each year, and (2) ‘constant price’ estimates based on Geary aggregation of international current prices for benchmark years and interpolation of country-specific constant price NIA data for in between years. For most of our work we use the ‘constant price’ data. Output, y, is real per capita GDP at constant prices constructed as a Laspeyre index (RGDPL). The list of countries we consider are as follows.
Asia: Japan, Korea, Taiwan, Singapore, Indonesia, Malaysia, Thailand, Hong Kong, Philip-pines, India, Sri Lanka, Bangladesh, Fiji, Nepal, Pakistan.
Europe: Portugal, Norway, Greece, Ireland, Netherlands, Belgium, France, Italy, Spain, Sweden, Denmark, Finland, Switzerland, Austria, Iceland, Turkey, United Kingdom, Ireland. America: U.S.A., Canada, Chile, Colombia, Costa Rica, Ecuador, El Salvador, Jamaica, Mexico, Panama, Paraguay, Trinidad & Tobago, Peru, Barbados, Dominican Republic, Guatemala.
Africa and Middle Eastern: Egypt, Israel, Botswana, South Africa, Tunisia, Mali, Malawi, Swaziland, Iran, Syria.
A.2.
Current Accounts
Current account, trade balance, and GDP data are obtained from the from the various issues of the International Financial Statistics and the World Economic Outlook database. Net foreign assets data are are from Lane and Milesi-Ferretti (2007) data set for 1970—2004 period, and obtained by backward adjustment (also earlier working data) for the 1960s. Advanced countries used in figures comprise: U.S.A., United Kingdom, Austria, Belgium, Denmark, France, Germany, Italy, Luxembourg, Netherlands, Norway, Sweden, Switzerland, Canada, Japan, Finland, Greece, Portugal, Spain, Australia, New Zealand.
Table 1: Distributions of Current Account, Net Foreign Asset, and Trade Balance 1970 2000 CA GDP Mean -2.4 -1.0 Median -2.1 -2.5 Max 11.6 19.6 Min -30.2 -18.3 SD 4.9 6.9 N F A GDP Mean -16.7 -40.2 Median -13.4 -36.9 Max 77.6 156.6 Min -136.2 -236.1 SD 29.3 55.4 T B GDP Mean -1.7 -1.9 Median -1.5 -2.9 Max 54.0 36.2 Min -31.6 -45.1 SD 9.8 11.6
Table 2: Parameters of the Benchmark Model Economy
Parameter Description
β = 0.96 Discount factor
γ = 2 Relative risk aversion
η = 6 Substitution elast b/w domestic and foreign consumption
φ = 0.475 Weight on domestic goods in CES utility function
τ = 0.5 Trade friction
ψ =rB−rL= 1.5% Interest rate spread
¯
a=−1.5 Borrowing constraint
ρx = 0.863 Persistence of relative income shock
Table 3: Standard Deviations of Current Account, Net Foreign Asset, and Trade Balance
Data Model Economies
Trade Borrowing
1970 2000 Benchmark Friction Constraint Spread
τ = 0.7 ¯a=−0.5 ψ = 3% CA GDP 4.9 6.8 5.0 4.9 4.0 3.3 N F A GDP 29.3 55.4 55.4 55.2 34.4 25.0 T B GDP 9.8 11.6 5.6 5.5 4.3 3.5
Table 4: Persistence of Current Account, Net Foreign Asset, and Trade Balance
Data Model Economies
Advanced Borrowing
All Countries Benchmark Constraint Spread ¯ a=−0.5 ψ = 3% CA GDP 0.64 0.84 0.81 0.78 0.75 N F A GDP 0.85 0.92 0.99 0.99 0.99 T B GDP 0.70 0.89 0.83 0.80 0.77
Table 5: Distribution of Current Account
Data Model Economies
Borrowing
Percentile 1970 2000 Benchmark Constraint Spread ¯ a=−0.5 ψ = 3% 5% -10.0 -10.3 -8.5 -6.9 -5.5 10% -6.8 -7.6 -6.4 -5.2 -3.9 50% -1.9 -2.5 0.0 0.1 0.0 90% 1.0 9.9 6.1 4.9 4.0 95% 2.7 13.1 7.9 6.3 5.4
Figure 1: Current Account to GDP −20 −10 0 10 20 Percent of GDP 1960 1970 1980 1990 2000 2010
Median Top and bottom deciles All sample countries
−10 −5 0 5 10 15 Percent of GDP 1960 1970 1980 1990 2000 2010
Median Top and bottom deciles Advanced countries
Figure 2: Net Foreign Asset to to GDP −150 −100 −50 0 50 Percent of GDP 1960 1970 1980 1990 2000 2010
Median Top and bottom deciles All sample countries
−100 −50 0 50 Percent of GDP 1960 1970 1980 1990 2000 2010
Median Top and bottom deciles Advanced countries
Figure 3: Trade Balance to to GDP −30 −20 −10 0 10 20 Percent of GDP 1960 1970 1980 1990 2000 2010
Median Top and bottom deciles All sample countries
−10 −5 0 5 10 15 Percent of GDP 1960 1970 1980 1990 2000 2010
Median Top and bottom deciles Advanced countries
Figure 5: Stationary Distribution of Benchmark Economy −0.40 −0.3 −0.2 −0.1 0 0.1 0.2 0.3 0.05 0.1 0.15 0.2 Current Account / GDP −0.40 −0.3 −0.2 −0.1 0 0.1 0.2 0.3 0.05 0.1 0.15 0.2 Trade Balance / GDP −2 −1.5 −1 −0.5 0 0.5 1 1.5 2 2.5 3 0 0.05 0.1 0.15 0.2
Figure 6: Model Comparison: Current Account / GDP −0.25 −0.2 −0.15 −0.1 −0.05 0 0.05 0.1 0.15 0.2 0 0.05 0.1 0.15 0.2 0.25 Current Account / GDP Benchmark trade friction borrow constraint spread
Note: The benchmark model is based on τ = 0.5, ¯a=−1.5, and ψ = 1.5%; ’trade friction’ refers to the model with a larger trade friction τ = 0.7; ’borrow constraint’ refers to ¯a=−0.5; ’spread’ refers toψ= 3%.