A Thesis Submitted for the Degree of PhD at the University of Warwick
Permanent WRAP URL:
http://wrap.warwick.ac.uk/
135041
Copyright and reuse:
This thesis is made available online and is protected by original copyright.
Please scroll down to view the document itself.
Please refer to the repository record for this item for information to help you to cite it.
Our policy information is available from the repository home page.
For more information, please contact the WRAP Team at:
AN EXAMINATJO^N O F^JH ^STABIM TY^O F^FOREC'ASTING .N
BY
LIN, LEE-HSUAN BBA., M.B.A., M.S.A.
A T h esis S ubm itted to in fulfilm ent o f th e Requirem ents fo r th e Degree
of D octor o f Philosophy in
Accountancy
W arw ick Business School U niversity of W arw ick
A C K N O W LED G EM EN T
I take this opportunity to acknowledge and sincerely thank those who have been most helpful to me in this endeavour. I would like to express my appreciation to my supervisor. Professor Antony Steele, director o f accounting and finance Department. His continuing guidance and support in my research made this thesis possible.
I especially appreciate the assistance and encouragement from Professor David Storey and from Professor Kevin Keasey who graciously provided valuable comments and suggestions which significantly improved the quality o f this study. I would also like to thank my previous supervisor. Dr. George Diacogiannis, who provided the aid during the period o f Feb 1989 to Sep 1991.
Special thanks hereby go to Phil Spruce o f Com puter Services at the University of Warwick. The extensive computer work required in this thesis would not have been possible without Phil’s expertise and patience. I am very appreciative o f this. Finally, a special debt o f gratitude is owed to my kind parents for their endless love and encouragement.
ABSTRACT
T he main focus oi this study is an empirical examination of the stability of company failure prediction models based on accounting information. Stability of forecasting in failure prediction models is tested using industry relative ratios and unadjusted ratios. Three homogeneous economic periods are defined : expansion, recession, and recovery. The stability and quality of forecasting models developed in these three different economic environments is tested using the industry relative ratios previously derived. The study also compares the stability o f forecasting of both the industry- specific models and the aggregate model for each o f the five years before failure. Specific industries include Contracting. General-Engineering. Textile. Other M anufacturing, and Miscellaneous. Finally, the ability of economy-wide indicators and year-dummies proxying calendar events to predict failure is examined.
Industry adjusted and unadjusted ratio models, business cycles models (adjusted and unadjusted ratios) and specific industry models are reported. Each model is developed using multivariate discriminant analysis. An examination of the stability of forecasting in failure prediction models in term s of the classification accuracy, proportional chance criterion, expected cost, relative cost ratios, and Conover 11 «^711 T test is performed. Finally, comparison graphs for each model are plotted.
Industry relative (mean) ratios were preferred to unadjusted ratios because they reduce the heterogeneity of companies' data. This results in improved stability of forecasting both in the within-sample (ex post) and out-of-sample (ex ante) context. Subsequent, industry relative ratios are used to control for industry differences and different economic environments are used to control for time-inconsistency. The empirical findings of the study are that use o f industry relative (mean and median) ratios and business cycles provides more stability and gives better predictive ability than use of unadjusted ratios and uncontrolled economic environments. In general,
better than ones based on aggregate data across industries. Because each industry has different financial characteristics we conclude that industry-specific models should be developed if data is available. W e find that industry specific and different economic conditions models are robust with respect to variation in prior probability and misclassification costs. In the context of failure prediction, accounting information appears to be more useful than macro-economic variables. The 4 macro-economic and II year-dummy variables are shown not to play an important role, adding only marginal discrim inating power to the models.
Page Lis! of Tables
List o f Figures
( 'h a p t e r 1 I n tr o d u c tio n
l.l Historical perspective 1
1.2 Objective of the Research 3
1.3 Importance of the Research 4
1.4 Hypotheses of the Reseurch 7
1.5 Limitations of the Research 12
1.6 Outline o f the Chapters 13
( 'h a p t e r 2 S ta tis tic a l A p p ro a c h e s to M o d ellin g
2.1 Introduction 15
2.2 Univariate Approach: 15
2.2.1 General Comments on the Univuriate approach 21
2.3 Multivariate Techniques 22
2.3.1. Discriminant Analysis 22
2.3.2 Early and Recent Studies 23
2.3.3 General Comments on the Multivariate Studies 3K
2.4 Conditional Probability Approach 39
2.5 Classification Trees and Nonparametric Approachs 44
2.6 Survival Analysis 47
2.7 Summary and Conclusions 4M
( 'h a p t e r 3 M e th o d o lo g y F o r C h o o s in g I n d e p e n d e n t V a ria b le s a n d D e p e n d a b le V a ria b le s
3.1 Developing A Theory o f Failure Prediction 51
3.1.1 Theory As A Stimulus SI
3.1.4 Developing A Theoretical Mathematical Model
Page 57
3.1.5 A Comprehensive Theoretical Model 59
3.2. Selecting Financial Ratios 62
3.2.1 Choosing Important Financial Ratios 62
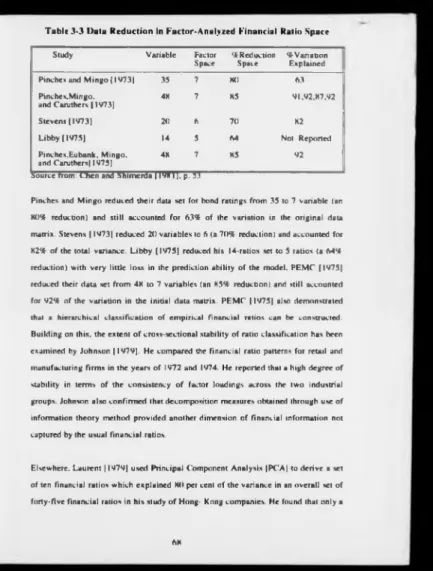
3.2.2. Categorizing of Financial Ratios and Reducing the Variable Set 66
3.2.3 The Use of Financial Ratios for Predictive Purposes 7«
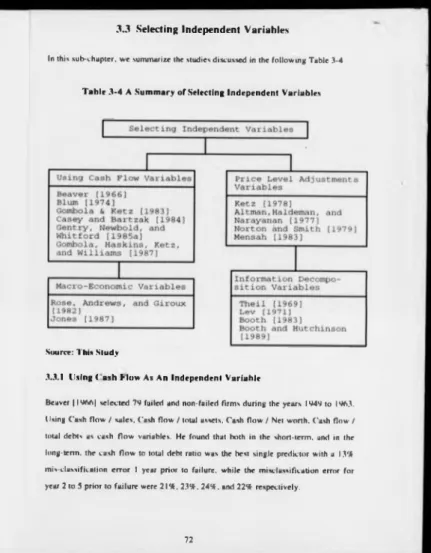
3.3 Selecting Independent Variables 72
3.3.1. Using Cash Flow As An Independent Variable 72
3.3.2 Adjusting Financial Ratios: Price Level Adjustments 78
3.3.3 Selecting Macro-Economic Variables HI
3.3.4. Using Information Decomposition Theory 83
3.4 Selection of Dependent Variables 86
3.4.1 Bankruptcy as the Dependent Variable 86
3.4.2 Data Collection Sources 86
3.4.3 Timing of Data 87
3.4.4 Matching Criteria 88
3.4.5 Reasons For Using the Matching Approach 88
3.4.6 Sample Selection. VI
3.4.7 Selection of Non-Failed Finns 92
3.5. Definition of Company Failure 94
3.5.1 Company Failure 94
3.5.2 Compulsory Liquidation 95
3.5.3. Voluntary Liquidation 95
3.5.4 Receivership 95
3.5.5 Definition of Company Failure 96
C H A P T E R 4 E c o n o m ic a n d I n d u s tr y In flu e n c e s
4.1 Economic Influences 101
4.1.1 T he Definition o f Business Cycles and Their Effects 102
4.1.2 Changes in Real GNP Economic Growth 104
4.1.3 Shifts in Credit Availability and Interest Rates 105
4.1.4 Changes in the Rate of Inflation 106
4.2 Prediction Versus Stability 109
4.2.1 T he Stability of Predictive Ability Over Time 109
4.2.2 Ex-post Classification Problems 112
4.2.3 Pooling Data Problems 113
4.3 Industry Influences 115
4.3.1 Industry Classifications 115
4.3.2 Control for Industry-Wide Factors 120
4.3.3 Choice of An Appropriate Industry Norm. 121
4.3.4 Developing A Class of Stable Industry Relative Ratio Models 127
4.5 Alternative Methods to Select Industry Relative Ratios 135
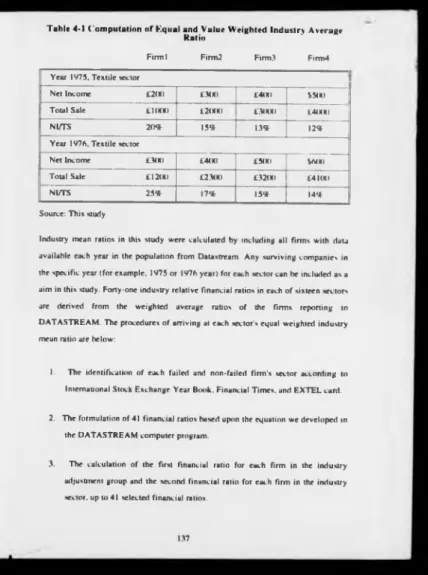
4.5.1 The Procedure o f Producing Each Sector's Industry Mean Ratios 135
4.5.2 The Procedure of Producing Each Sector's Industry Median Ratios I3X
4.6 Developing A Specific Industry Model 141
4.7 Summary and Conclusions 143
C h a p t e r 5 E m p ir ic a l R e s e a rc h M e th o d o lo g y
5.1 Introduction 144
5.2 Research Design 144
5.2.1. Sam ple Design 144
5.2.2 Selection of the Failed firms 145
5.2.4 Classification o f the Sample
Page ISO
5.2.5 Selection of the Independent Variables 156
5.2.5.1 Factor Analysis 157
5.2.6 Definition o f G roups and Ratios 15V
5.3 Data Analysis 15V
5.3.1 Multiple Discriminant Analysis |M D A | ISV
5.3.2 The O bjectives o f MDA 161
5.3.3 The Nature and Assumption of MDA 162
5.3.3.1 The Non-M ultivariate Normal Distribution 162
S.3.3.2 The Equality o f G roup Variance- Covariance Matrix 163
5.3.4 Basic Concepts o f Classification 165
5.3.5 Linear Discriminant Function 167
5.4 Evaluating the Significance of Independent Variables I6X
5.4.1 Introduction I6X
5.4.2 Selection of Variables in the Discriminant Model 16V
5.4.3 The Function's O verall Significance 170
5.4.4 The Relative Importance of Independent Variables 171
5.5 Incorporating Prior Probabilities and Misclassification Costs 174
5.6 Classification Test 1X0
5.6.1 Testing the Discriminating power 1X0
5.6.2 Testing the Predictive Power 1X2
5.7 Statistical Significance of Models 1X3
5.X Summary and Conclusions 1X5
C h a p t e r 6 P r e lim in a ry K .m p irical R e su lts
6.1. Introduction 1X7
6.2.1 A Priori groupings
Page
1X9
6.2.2 The problem (S-W) Outliers 1*1
6.2.3 Data Distribution and Transformation I 9 i
6.2.4 Descriptive Statistics 194
6.2.5 Tests For Normality 195
6.2.3.1 Shapiro-Wilk Tests 195
6.2.S.2 Skewness and Kurtosis Tests 197
6.3 Correlation Analysis 205
6.4. Empirical Univariate Analysis Results 207
6.4.1 The T-Test of Significance 207
6.4.2 Univuriute Analysis (Profile Analysis) 210
6.5 The Industry and Economic Environmental Effects 222
6.3.1 Cluster Analysis 222
6.5.2 The Industry Factor 224
6.5.2.1 Industry Relative Ratios 224
6.S.2.2 Industry Effect 226
6.5.3 The Business Cycles und Year Dummy Variables 227
6.5.4 The Macro-Economic Indicators 229
6.6 Summary and Conclusions 232
C h a p t e r 7
7.1
K m p i r i c a l R e s u lts : I n d u s t r y R e la t iv e M o d e ls
Empirical Results for Industry Relative Ratio |IR R | Models 234
7.1.2 The Model: Using Industry Mean Ratios (IR R I). 236
7.1.3 Model Significance Test 239
7.1.4 Relative Contributions of Ratios 240
7.1.5 Examining the Classification Accuracy Using Industry Mcun Rutios 240
7.1.6 Ex Post und Ex Ante Sumple Test 240
7 .1.9 Sensitivity to Prior Probability and Misclassification Costs 247
7 .2 The Model: - Using Industry Median Ratios (IRR2) 251
7.2.1 Model Significance Test 251
7.2.2 Relative Contribution of Ratios 252
7.2.3 Ex Post and Ex Ante Sample Test 252
7.2.4 Comparison With Models - Using Unadjusted Ratios (UR) 254
7.2.5 Sensitivity to Prior Probabilities and Misclassification Costs 256
7.3 The Model 3: Using Unadjusted Ratios (UR) 258
7 .3 .1 Model Significance Test 258
7.3.2 Relative Contribution of Ratios 258
7.3.3 Ex Post and Ex Ante Suinple Test 259
7.3.4 Comparison With Models - Using Industry Mean Ratios (IRRI ) 261
7.3.5 Comparison With Models - Using Industry Median Ratios (IRR2) 262
7.3.6 Sensitivity to Prior Probabilities and Misclassification Costs 263
7.4 Comparison of the Three Optimal Models - UR. IRR I and IRR2 266
7 .4 .1 Results Two and Three Years Prior - Using UR Model 2 7 1
7.4.2 Results Two and Three Yeurs prior - Using IRR I Model 272
7.4.3 Tw o and Three Years Prior - Using IRR2 Model 273
7.5 Summary and Conclusions 275
( 'h a p te r 8 E m p iric a l R e su lts F o r B usin ess ( !ycle M odels
8.1 Introduction 276
8.2 The Aggregate Model - Using Unadjusted Ratios (URAG) 278
8.2.1 Relative Contribution of Ratios 278
8.2.2 Examining the Classification Accuracy Test 278
8.2.3 Sensitivity to Prior Probabilities and Misclassification Costs 280
8.3 The Aggregate Model - Using Industry Mean Ratios ( IRR I ) 281
X.3.1 Relative C ontribution of R atios 2XI
X.3.2 Examining the Classification Accuracy Test 2X1
X.3.3 Sensitivity to Prior Probabilities and Misclassification Costs 2X3
X 4 The Aggregate Model - Using Industry Median Ratios (IRR2) 2X4
X.4.1 Relative Contribution o f Ratios 2X4
X.4.2 Examining the Classification Accuracy Test 2X4
X.4.3 Sensitivity to Prior Probabilities and Misclassification Costs 2X6
X.5 Expansionary Phase - URBI Model - Using Unadjusted Ratios 2X7
X.3 I Relative C ontribution of R atios 2XX
X.5.2 Examining the Classification Accuracy Test 2XX
X.5.3 Sensitivity to Prior Probabilities and Misclassification Costs 2X9
X.6 Expansionary Phase - IKK I HI Model 291
X.6.1 Relative Contribution o f R atios 291
X.6.2 Examining the Classification Accuracy Test - Using IRRIB I 291
X.6.3 Sensitivity to Prior Probabilities and Misclussification Costs 293
X.7 Model Bl - Using Industry Median Ratios (IR R 2B I) 295
X.7 I Relative Contribution o f Ratios 296
X.7.2 The Classification Accuracy and Validation Test 296
X.7.3 Sensitivity to Prior Probabilities and Misclassification Costs 297
X.X Recessionary Phase - Using Unadjusted Ratios (URB2) 299
X.X. I Relative Contribution of R atios 300
X.X.2 Examining the Classification Accuracy Test 300
X.X.3 Sensitivity to Prior Probabilities and Misclassificution Costs 301
X.9 Recessionary Phase - Using Industry Mean Ratios (IRRIB2) 303
X.9.1 Relative C ontribution of Rutios 303
X.9.2 Examining the Classification Accuracy Test 303
X.9.3 Sensitivity to Prior Probabilities and Misclassification Costs 305
K. 10 The Recessionary Phase - Using Industry Median Ratios 307
H. 10.1 Relative Contribution o f Rutios 307
K. 10.2 Examining the Classification Accuracy Test 307
H. 10.3 Sensitivity to Prior Probabilities and M isclassification Costs 30X
H.l 1. The Recovery Phase - Using Unadjusted Ratios 3I()
N. 11.1 Relative Contribution o f Ratios 3 11
K. 11.2 Classification Accuracy and Validation Test 3 11
X. 11.3 Sensitivity to Prior Probabilities and M isclassification Costs 3 12
X. 12 Recovery Phase - IRRIB3 Model 3 14
X. 12 .1 Relative Contribution of Ratios 3 14
X. 12.2 Examining the Classification Accuracy 3 14
X. 12.3 Sensitivity to Prior Probabilities and M isclassification Costs 316
X.I3 Recovery Phase - Using Industry Median Ratios 31X
X. 13 .1 Relative Contribution o f Rutios 3 1 y
X. 13.2 The Classification Accuracy and Vulidution Test 3 1 y
X.13.3 Sensitivity to Prior Probabilities and Misciussificution Costs 320
X.I4 Summury and Conclusions 322
C h a p t e r 9 E m p iric a l R e su lts F o r In d u stry -S p e c ific M o d e ls
9.1 Introduction 326
9-2 The Aggregate Model - Using Unudjusted Rutios (URAG) 327
9.3 Classification Accuracy • Industry-Specific M odels 327
9.4 Contracting Sector 32X
9 .4 .1 Relutive Contribution o f Rutios 32X
9.4.2 Examining the Classification Accuracy 329
9.4.3 Sensitivity to Prior Probabilities und Misciussif icution Costs 330
9.3 General-Engineering G roup 332
9.5.1 Contribution of R atios
Puge 332
9.3.2 Examining the Classification Accuracy 333
9.5.3 Sensitivity to Prior Probabilities and Misclassification Costs 334
9.6 Textile Sector 336
9.6.1 Relative Contribution of Ratios 337
9.6.2 Examining the Classification Accuracy 337
9.6.3 Sensitivity to Prior Probabilities and Misclassification Costs 338
9.6.4 Relative Contribution o f Ratios 340
9.6.5 Ex post and Ex Ante Sample Test 340
9.6.6 Sensitivity to Prior Probabilities and Misclassification Costs 342
9.7 Other Manufacturing Industry .344
9.7.1 Relative Contribution of Ratios 344
9.7.2 Examining the Classification Accuracy 344
9.7.3 Sensitivity to Prior Probabilities and Misclassification Costs 346
9.H Miscellaneous Sector 347
9.H.I Relative Contribution of Ratios 348
9.K.2 Examining the Classification Accuracy 348
9.K.3 Sensitivity to Prior Probabilities and Misclassification Costs 349
9.9 A Comparison Between The Aggregate and Industry-Specific Models 351
9.10 Results Two and Three Years Prior 352
9.10.1 Results Two and Three Years Prior - Contracting Industry 352
9.10.2 Results Two and Three Years Prior - General-Engineering Industry 353
9.10.3 Results Two and Three Years Prior - Textile Industry 354
9.10.4 Results Two and Three Years Prior - Other Manufacturing Industry 355
9.I0.S Results Two and Three Years Prior - Trading Industry 356
C h a p t e r 10 S u m m a r y a n d C o n c lu s io n s
Page
10.1 Introduction 3A0
10.2 Variables' Design and Their Distribution 3AI
10.3 Univariate (profile) Analysis 362
10.4 Factor Analysis 363
10.5 Cluster Analysis 363
10. A Correlation Analysis 364
10.7 A Model Using Industry Relative Ratios and Unadjusted Ratios 363
I0.X A Model Using Industry Relative Ratios and Business Cycles 36N
10.9 Industry-Specific Models 371
10.10 Classification Accuracy Test 375
10.11 Implications 377
A P P E N D IX
Appendix A Listing Financial Ratios in This Study 3KI
Appendix A.I Definitions of Ratio Components 3X3
Appendix B: Key to Variable Definitions 3X4
Appendix C: Producing Industry Relative Ratios (Mean) Computer Program. 3X6
Appendix D Producing Industry Relative Ratios (Median) C om puter Program 3X9
Appendix E Producing Industry-Specific Industry Relative Ratios 392
Appendix F Datastream Industry Adjustment Firms 44 )X
Appendix G Non-Failed Firms' Names 44)9
Appendix H Failed Firms' Names 414)
Appendix 1 Outliers Removal Computer Progrum 412
Appendix J Univariate Analysis Graphic Com puter Program 414
List o f F igures
Page
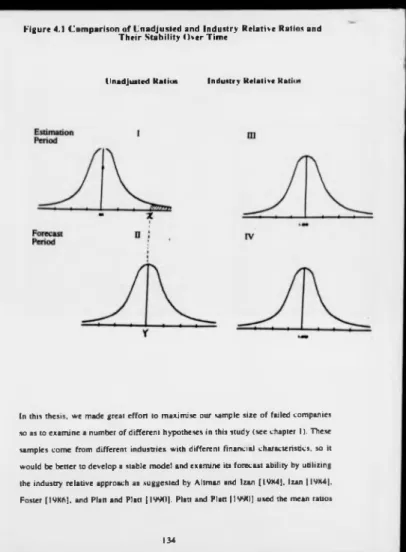
4 .1 Comparison o f Unadjusted and Industry Relative Ratios and Their 134
Stability Over Time
6- 1 Univariate (Profile) Analysis Comparison of Mean Values 216
7 - 1 IRRI and UR Comparison o f Five Cost Ratios 249
7-2 IRR2 and UR Comparison o f Five Cost Ratios 256
7-3 UR. IRR 1 and IRR2 Models Comparison o f Five Cost Ratios 264
7-4 Best UR and IRR I Models Comparison o f Five Cost Ratios 267
7-5 Best UR and IRR2 Models Comparison o f Five Cost Ratios 26X
7-6 Best 1RR2 and IRR I Models Comparison of Five Cost Ratios 269
K-1 URACi. IRR 1 AG. and IRR2AG Models Comparison of Five Cost Ratios 2H6
X-2 Comparison of UR AG and URBI Models in the Expansionary Phase 2X9
X-3 Comparison of IRR I B 1. URAG and IRR I AG Models in the Expansionary Phase
294
X-4 Comparison of IRR2B I. URAG. and IRR2AG Models in the Expansionary Phase
29X
X-5 Comparison of URB2 and URAG Models in the Recessionary Phase 301
X-6 Comparison of IRR IB2. URAG. and IRR I AG Models in the Recessionary Phase
305
X-7 Comparison of IRR2B2. URAG. and IRR2AG Models in the Recessionary Phase
309
X-X Comparison of URB3 and URAG Models in the Recovery Phase 312
X-9 Comparison of IRRIB3, URAG. and IRRI AG Models in the Recovery Phase3l7
X-IO Comparison of IRR2B3, URAG, und IRR2AG Models in the Recovery Phase320
*i-2 General-Engineering and UR Aggregate Models-Comparison o f Five Com Ratios 334
9-3 Textile and UR Aggregate Models-Comparison o f Five Cost Ratios 33«
9-4 Other Manufacturing and UR Aggregate Models-Comparison of Five Cost Ratios
346
Page
2 .1 A Summary of the Statistical Approaches To Modelling Corporate Failure 16
3.1 Stages o f Business Failure 57
3-2 A Comprehensive Model for Financial Failure Prediction 61
3-3 Data Reduction in Factor-Analyzed Financial Ratio Space 6H
3-4 A Summaries of Selecting Independent Variables 72
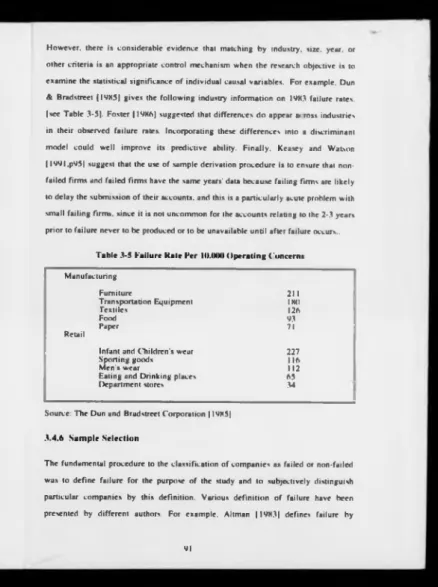
3- 5 Failure Rate Per 10,000 Operating Concerns 9 |
4 - 1 Computation of Equal and Value Weighted Industry Relative Ratio 137
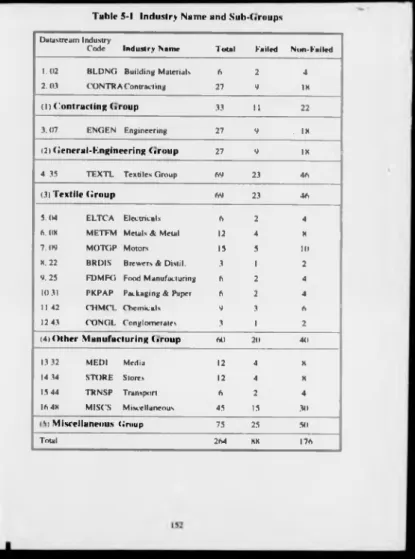
5 - 1 Industry Name and Sub-Groups 152
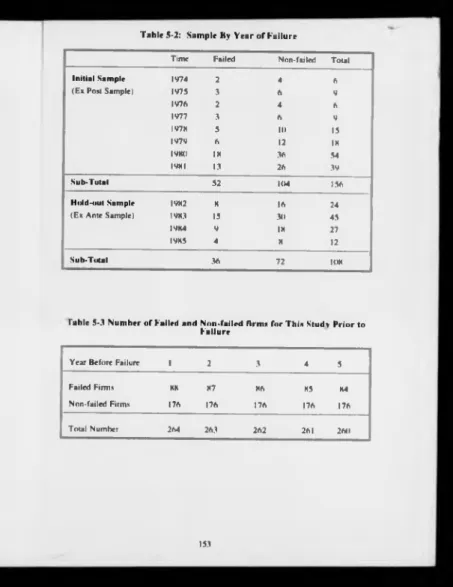
5-2 Sample By Year o f Failure 153
5-3 Number o f Failed and Non-failed firms for This Study Prior to Failure 153
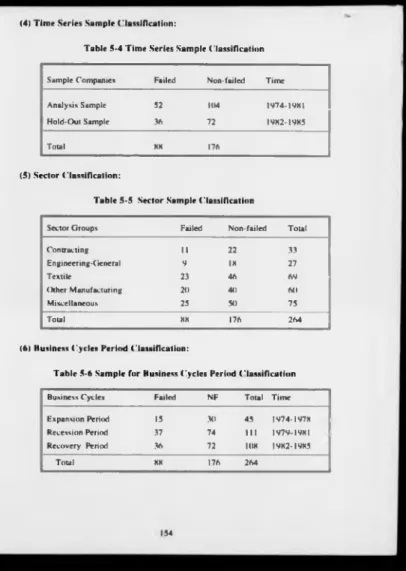
5-4 Time Series Sample Classification 154
5-5 Sector Sample Classification 154
5-6 Sample for Business Cycles Period Classification 154
5-7 Total Assets Five Years BF By Industry and Type o f Company 155
5-H Summary of Changes in the Number o f Public Companies on the Registers: 178
1 974/ 1985
5-9 Classification Matrix 182
5 - 10 Tw o By Tw o Contingency Table 184
6 - 1 A Comprehensive Flowchart of Preliminary Empirical Results 188
6-2 Summary o f the Distributional Evidence o f Financial Ratios (Raw Data) 194
6-3 Untransformed Ratio Distribution Statistics For the Non-Failed 199
und Failed Firms (All Year)
6-4 Untransformed Ratio Distribution Statistics For the Non-Failed 200
and Failed Firms (Year - I )
6-5 Untransformed Ratio Distribution Statistics For the Non-Failed 201
and Failed Firms ( Year -2 )
6-6 Untrunsformed Ratio Distribution Statistics For the Non-Failed 202
6-7 Untransformed Ratio Distribution Statistics For the Non-Failed 203 and Failed Firms ( Year - 4 )
6-8 Improvement Results of Transformation For All Years 204
6-9 Comparing the Differences Between Failed and Non-failed Groups Means. 20V
6-10 Standard Industrial Classification - For 16 industries 224
6 -11 Industry Relative Ratios o f Failed and Non-Failed Firms Across Industries 226
in This Study
6-12 Eleven Year Dummy Variables Used From 1974 to 1985 227
6 - 13 Levels of Interest Rates. Annual Inflation Rate, and Real GN P in Period 230 of Failure For Sample
7 - 1 Flowchart o f Chapter 7 233
7-2 Within groups Correlation Matrix - IRRI Function 242
7-3 Relative Contribution Tests of Each Independent Variables - IRRI Model 242
7-4 Classifying the W ithin (Ex Post) Sample. Using IRR 1 Model 242
7-5 Predicting the Out-of-Sample (Ex Ante) - IRR I Model 243
7-6 Industry Mean Ratio Forecast Validation Results One Year Before Failure 243
7-7 Classifying the Within Analysis Sample. UR Model 244
7-8 Predicting the Out-of-Sample. UR Model 244
7-9 Comparison of Error Rate Results: IRRI and UR One Year BF. 245
7-10 Classification Accuracy One Year Before Failure 246
7-1 1 Model Efficiency Comparisons Between IRRI and UR - Ex Post 24V
Sample Classification One Year BF
7-12 Model Efficiency Comparisons Between IRRI and UR - Ex Ante 250
Sample Predictions One Year Before Failure
7-13 Within Groups Correlation Mutrix - IRR2 Function 253
7-14 Relative Contribution Tests o f Each Independent variables - IRR2 Model 253
7-15 Classifying the Ex Post Sample. Using IRR2 253
7-16 Classifying the Ex Ante Sample. Using IRR2 253
7-17 Comparison of Classification Results Ex Post und Ex Ante Sample One Year BF254
7-IM Comparison of Error Rate Results: IRR2 and UR One Year Before Failure 255
7 -IV Comparison of Classification Results Between This Study (IRR2) and 255
7-21 7-22 7-23 7-24 7-25 7-26 7-27 7-2K 7-2«* 7-30 7-31 7-32 7-33 7-34 7-35 7-36 A 7-36B 7-36C 7-37 7-3M 7-39
7-20 Model Efficiency Comparisons Between IRR2 and UR - Ex Post
Sample Classification
Model Efficiency Comparisons Between IRR2 and UR - Ex Ante Sample Predictions
Within Groups Correlation Matrix - UR Function
Relative Contribution Tests of Each Independent Variables - UR Model Classifying the Ex Post Sample - Using UR One Year BF
Predicting the Ex Ante Sample - Using UR One Year BF
Comparison Between The Ex Post and Ex Ante Analysis - Using UR One
Classifying the Ex Post Sample. Using IRRI Model Predicting the Ex Ante Sample. Using IRRI Model Comparison of Error Rate Results: UR and IR R 1 One Year BF. Classifying the Ex Post Sample. Using IRR2 Model One Year Before Failure Predicting the Ex Ante Sample. Using IRR2 Model One Year Before Failure Comparison of Error Rate Results Between UR and IRR2 One Year Before Failure
Model Efficiency Comparisons Among UR. IRRI and IRR2 - Ex Post Classification
Model Efficiency Comparisons Among UR. IRRI and IRR2 - Ex Ante Predictions
Results of the Three Best Models UR. IRR I and IRR2
Model Efficiency Comparisons Between the Best UR and IRR I Models - Ex Ante Predictions
Model Efficiency Comparison!! Between the Best UR and IRR2 Models - Ex Ante Predictions
Model Efficiency Comparisons Between the Best IRRI and IRR2 Models - Ex Ante Predictions
Model Efficiency Comparisons Between Ex Post and Ex Ante Sample Two Years BF. Using UR
Model Efficiency Comparisons Between Ex Post and Ex Ante Sample Three Years BF. Using UR
Model Efficiency Comparisons Between Ex Post and Ex Ante Sumple Two Years BF. Using IRR I
256 257 259 26(1 260 260 260 261 261 262 263 263 263 264 265 267 26K 269 270 271 271 272
7-41 Model Efficiency Comparisons Between Ex Post and Ex Ante Sample 273 Tw o Years BF. Using IRR2
7-42 Model Efficiency Comparisons Between Ex Post and Ex Ante Sample 273
Three Years BF. Using IRR2
H-1 G roups Correlation Matrix - URAG Function 279
K-2 Relative C ontribution Tests of Each Independent Variables - URAG Model 279
X-3 Classifying the Aggregate Sample - Using URAG One Year BF 279
X-4 Model Efficiency Comparisons - Using URAG Aggregate Sample. 2X0
X-5 Model Efficiency Comparisons - Using URAG Aggregate Lachenbruch 2X0
Validation Test
X-6 W ithin Groups C orrelation Matrix - IRR I AG Aggregate Function 2X2
X-7 Relative Contribution Tests o f Each Independent Variables - IRR I AG 2X2
Aggregate Model
X-X Classifying the Aggregate Sample. Using IRR I AG 2X2
X-9 Model Efficiency Comparisons - Using IRR I AG Aggregate Sample. 2X3
X-10 Model Efficiency Com parisons - Using IRR I AG Aggregate 2X3
Lachenbruch Validation Test
X-11 G roups Correlation Matrix - IRR2AG Aggregate Function 2X5
X-12 Relative Contribution Tests of Each Independent Variables - IRR2AG 2X5
Aggregate Model
X-13 Classifying the Aggregate Sample. Using IRR2AG 2X5
X-14 Model Efficiency Com parisons - Using IRR2AG Aggregate Sample. 2X6
X-15 Model Efficiency Com parisons - Using IRR2AG Aggregate 2X6
Lachenbruch Validation Test
X-16 W ithin Groups Correlation Matrix - URBI Function 2XX
X-17 Relative Contribution Tests and Ranks of Financial Ratios in Expansionary 2XX
Phase - URBI Model
X-1X Classifying the Expansionary Period Sample, Using URBI 2X9
X-19 Model Efficiency Com parisons • Using URBI and URAG Aggregate Sample. 2X9
X-20 Model Efficiency Comparisons - Using URBI und URAG Aggregate 290
Luchenbruch Validation Test
X-21 W ithin Groups Correlation Mutrix - IRRIBI Function 292
7-4<) Model Efficiency Comparisons Between Ex Post and Ex Ante Sample 272
8-23 8-24 8-25 8-26 8-27 8-28 8-29 8-30 8-31 8-32 8-33 8-34 8-35 8-36 8-37 8-38 8-39 8-40 8-41 8-42 8-43
8-22 Relative Contribution Tests and Ranks of Financial Ratios in the Expansion Phase - IRRIBI Model
Classifying the Expansionary Sample. Using IRRIBI
Model Efficiency Comparisons - Using IR R IB I. IRRI AG . and URAG Aggregate Model in the Expansion Phase
Model Efficiency Comparisons - Using IR R IB I. IRR I AG .and URAG Aggregate Lachenbruch Validation Test
Groups Correlation Matrix - IRR2BI Function
Relative Contribution Tests and Ranks of Financial Ratios in Expansionary
Phase - IRR2BI Model 7
Classifying the Expansionary Period Sample. Using IRR2BI Model Efficiency Comparisons - Using IRR2BI .IRR2AG and URAG Aggregate Sample in Expansion Phase Classification
Model Efficiency Comparisons - IRR2BI. IRR2AG. and URAG Aggregate Sample in the Expansion Phase
Within groups Correlation Matrix - URB2 Model
Relative Contribution Tests and Ranks of Financial Ratios in Recessionary Phase - URB2 Model
Classifying the Recessionary Phase Sample. Using URB2 Model Efficiency Comparisons - Using URB2 and URAG Aggregate in the Recession Sample
Model Efficiency Comparisons - Using URB2 and URAG Aggregate Lachenbruch Validation Test in the Recessionary Phase Within Groups Correlation Matrix - IRR2B2 Model
Relative Contribution Tests and Ranks of Financial Ratios in Recessionary Period - IRR2B2 Model
Classifying the Recessionary Period Sample. Using IRRIBI Model Efficiency Comparisons - Using IRR IB2. IRR I AG. and URAG Aggregate in the Recessionary Phase
Model Efficiency Comparisons - Using IKK IB2. IRK I AG and URAG Aggregate Lachenbruch Validation Test in the Recessionary Phase Groups Correlation Matrix - IRK2B2 Function
Relative Contribution Tests of Each Independent Variables - IRR2B2 Model Classifying the Recessionary Period Sample. Using IRR2B2
292 293 294 296 296 297 297 298 3(8) 3(8) 301 301 302 304 304 .304 305 .306 308 308 308 292
X-44 Model Efficiency Comparisons - Using IRR2B2. IRR2AG and URAG 309 Aggregate in the Recessionary Phase
H*45 Model Efficiency Comparisons - Using IRR2B2. IRR2AG and URAG 309
Aggregate Lachenbruch Validation Test in the Recessionary Phase
X-46 Groups Correlation Matrix - URB3 Function 3 11
X-47 Relative Contribution Tests and Ranks of Financial Ratios in Recovery 3 12
Phase - URB3 Model
H-4X Classifying the Recovery Phase Sample. Using URB3 312
X-49 M odel Efficiency Comparisons - Using URB3 and URAG Aggregate Sample. 312
H-50 M odel Efficiency Comparisons - Using URB3 and URAG Aggregate 313
Lachenbruch Validation Test in the Recovery Phase
H-51 W ithin Groups Correlation Matrix - IRRIB3 Function 3 15
X-52 Relative Contribution Tests and Ranks of Financial Ratios in the Recovery 3 15 Phase - IRR IB3 Model
X-53 Classifying the Recovery Phase. Using IRRIB3 315
X-54 Model Efficiency Comparisons - Using IRR IB3. IRR I AG .and URAG 316
Aggregate Model in the Recovery Phase
X-55 Model Efficiency Comparisons - Using IRRIB3. IRR I and UR 317
Aggregate Lachenbruch Validation Test in the Recovery Phase
X-56 G roups Correlation Matrix - IRR2B3 Function 319
K-57 Relative Contribution Tests and Ranks of Financial Ratios in Recovery 319
Phase IRR2B3 Model
M-5H Classifying the Recovery Phase Sample. IRR2B3 Model 320
K-59 Model Efficiency Comparisons - Using IRR2B3. IRR2AG and URAG 320
Aggregate Model in Recovery Phase Classification
K-60 Model Efficiency Comparisons - IRR2B3. IRR2. und UR Aggregate 321
Model in the Recovery Phase
K-61 Percentage Error Model 322
H-62 Summary of Expected Costs 323
K-63 Expected Costs For Optimal Model 323
9-1 W ithin Groups Correlation Matrix - Contracting Model 329
9-2 Relutive Contribution Tests of Each Independent Variables - Contracting Model 329
y-4 Model Efficiency Comparisons-Contracting Industry and Aggregate Classification 330
9-5 Model Efficiency Comparisons - Contracting and Aggregate Model 331
Lachenbruch Validation
9-6 G roups Correlation Matrix - General-Engineering Model 333
9-7 Relative Contribution Tests o f Each Independent Variables - 334
General-Engineering Model
9-8 Classifying the Engineering-General 333
9-9 Model Efficiency Comparisons - General-Engineering Industry and UR 334
Aggregate Model Classification
9-10 Model Efficiency Comparisons - General-Engineering Industry and UR 335
Aggregate Model Lachenbruch Hold-Out Validation
9 - 11 W ithin Groups Correlation Matrix - Textile Model 337
9-12 Relative Contribution Tests o f Each Independent Variables - Textile Model 337
9-13 Classifying the Textile Industry Model Based On Ratios. M acro-Economic. 338
and Year Dummy Variables
9-14 M odel Efficiency Comparisons - Textile Industry and UR aggregate 338
Model Classification
9-15 Model Efficiency Comparisons - Textile industry and UR Aggregate 339
Model Lachenbruch Hold-Out Validation
9-16 G roups Correlation Matrix - Textile Model 341
9-17 Relative Contribution Tests o f Each Independent Variables - Textile Model 3 4 1
9 - 18 Classifying the Ex Post Sample - Using Textile Model 341
9-19 Predicting the Ex Ante Sample - Using Textile Model 342
9-2(1 Model Efficiency Comparisons Between Textile Industry and IK HI - 343
Ex post Sample Classification One Year BF
9-21 Model Efficiency Comparisons Between Single (Textile) Industry and IRRI - 343
Ex Ante Sample Prediction One Year BF
9-22 W ithin Groups Correlation Matrix - Other Manufacturing Industry Model 345
9-23 Relative Contribution Tests o f Each Independent Variables - Other 345
Manufacturing Model
9-24 Classifying the Other Manufacturing Industry Model Based On Ratios. 345
Macro-Economic, and Year Dummy Variables
9-25 Model Efficiency Comparisons - Other Manufacturing Industry Classification 346
Lachenbruch Validation
9-27 Within Groups Correlation Matrix - Trading Model
V-2K Relative Contribution Tests of Each Independent Variables - Miscellaneous Model
9-29 Classifying the Trading Industry Model Based On Ratios. Macro-Economic, and Year Dummy Variables
9-30 Model Efficiency Comparisons - Miscellaneous Industry and l)R Aggregate Model Classification
9-31 Model Efficiency Comparisons - Miscellaneous and UR Aggregate
Model Lachenbruch Hold-Out Validation
9-32 The Classification Accuracy Between the Aggregate and Industry-Specific Models
9-33 Model Efficiency Comparisons Between the Aggregate and
Industry-Specific Models Lachenbruch Validation
9-34 Model Efficiency Comparisons - Contracting Industry Classification and Lachenbruch Validation Test Second Year BF
9-35 Model Efficiency Comparisons - Contracting Industry Classification and Lachenbruch Validation Test Third Years BF
9-36 Model Efficiency Comparisons - General-engineering Industry Classification
and Lachenbruch Validation Test Second Years BF
9-37 Model Efficiency Comparisons - General-Engineering Industry Classification
and Lachenbruch Validation Test Third Years BF
9-3K Model Efficiency Comparisons - General- Textile Industry Classification and Lachenbruch Validation Test Second Years BF
9-39 Model Efficiency Comparisons - Textile Industry Classification and Lachenbruch Validation Test Third Years BF
9-40 Model Efficiency Comparisons - Other Manufacturing Industry Classification and Lachenbruch Validation Test Two Years BF
9-41 Model Efficiency Comparisons - Other Manufacturing Industry Classification and Lachenbruch Validation Test Third Years BF
9-42 Model Efficiency Comparisons - Trading Industry Classification and Lachenbruch Validation Test Two Years BF
9-43 Model Efficiency Comparisons - Trading Industry Classification and Lachenbruch Validation Test Third Years BF
34# 349 349 349 350 351 351 352 352 353 353 354 354 355 355 356 356
ABBREVIATIONS
IRRI « Industry Mean Ratios
IRR2 « Industry Median Ratios
UR ■ Unadjusted Ratios
URAG ■ Unadjusted Rutios Aggregate Model
URB I ■ Unadjusted Ratios in the expansionary phase o f the business cycle URB2 ■ Unadjusted Ratios in the recessionary phase o f the business cycle URB3 ■ Unadjusted Ratios in the recovery phase of the business cycle IRRI AG “ Industry Mean Ratios Aggregate Model
IR R IB I ■ Industry Mean Ratios in the expansionary phase of the business cycle IRRIB2 - Industry Mean Ratios in the recessionary phase o f the business cycle IRR IB3 ■ Industry Mean Ratios in the recovery phase of the business cycle IRR2AG ■ Industry Median Ratios Aggregate Model
IRR2BI ■ Industry Median Ratios in the expansionary phase of the business cycle IRR2B2 ■ Industry Median Ratios in the recessionary phase of the business cycle IRR2B3 ■ Industry Median Ratios in the recovery phase o f the business cycle
Con ■ Contracting Industry
GE ■ General Engineering Industry
Tex ■ Textile Industry
Other ■ Other Manufacturing Industry
Mis ■ Miscellaneous Industry
SB A ■ Small Business Administration
RMA ■ Robert M orris Associates
LDA ■ Linear Discriminant Analysis
QDA ■ Quadratic Discriminant Analysis
MDA - Multivariate Discriminant Analysis
OTC ■ Over • the - Counter
RPA ■ Recursive Partitioning Algorithm
NLV ■ Net Liquidation Value
CFFO ■ Cash Flow From Operations
GFL ■ General Price Level
FASB ■ Financial Accounting Securities Boarding
SEC ■ Securities Exchange Committee
HC ■ Historical Cost
SPL ■ Specific Price-Level Adjusted
USDC ■ United States Department o f Commerce
NBER ■ National Bureau of Economic Research
SSEKD ■ Sydney Stock Exchange Research Department
BC ■ Business Cycles
GNP - Gross National Product
SIC ■ Standard Industry Classification
SEIC ■ Stock Exchange Industry Classification
C hapter I. Introduction
1.1 Historical Perspective
During the past two decades, many authors have attempted to develop robust corporate failure prediction models. The intention of these studies has been to explain the causes and symptoms of bankruptcy and to provide useful data to investors for reducing the risk o f investment, to lenders as reference for finance and credit, to regulators for assistance in public policy making, to decision makers for directing management improvement, to auditors to provide a basis for opinions, and to other groups as well. Early financial analysts used to distinguish between failed and non- failed firms using univariate comparisons of financial ratios. Beaver |l9f*6| was the first scientific study to compare group means for 30 financial ratios. However, two years later. Altman | I96X| moved researchers away from the univariate use o f ratios. He applied multivariate statistical methods able to deal with combinations of two or more variables. This innovation resulted in the increasing use of multivariate discriminant analysis |M D A |. Later studies. Edmister 11V72|; Deakin |I 9 7 2 |; Blum |I9 7 4 |; Libby |I9 7 5 ); and Taffler |I 9 7 7 | all used MDA to develop their individual models. To date there are probably in excess o f 1(H) studies that have applied MDA to the prediction and analysis of corporate failure. Several more recent studies for large firms see Martin |I9 7 7 ); Ohlson 119X0); Mensah |I9X3); Zmijewski ||9 X 4 |; Casey and Bartczak 119X5); Zavgren 119X5. I9XX|; for small firms see Keasey and Watson | l9X7b|; and Storey et al. 119X7) have used logit and probit techniques which provide a conditional probability of an observation belonging to a certain class, given the values of the independent variables for that observation. Another interesting extension of the logit techniques has been provided by Lau |I9X 2| use of a multi nomial logit analysis to categorize four different states of financial distress rather than the simply
binary bankrupt and non-bankrupt. Most recently, both Marais. Patel!, and Wolfson, [19X4] and Frydrnan. Altman, and Kao [ 1 VK5| used recursive partitioning analysis. The field is still innovating Bamiv and Raveh (19X9) who used non-parametric analysis have presented an impressive classification tool.
All of these previous studies report success in using individual firms' financial ratios to distinguish between bankrupt and non-bankrupt firms. Although some of these models have met certain statistical success in both explaining and predicting bankruptcy, the within-sample classification results using statements one year prior to failure are somewhat inconsistent with those of the out-of-sample. The instability of predictive ability between ex post (within-sample) and ex ante (out-of-sample) results is perhaps the most problematic issue in the field of corporate failure prediction. Moyer (1977), Mensah (I9X4| and Wood and Piesse |I 9 8 7 | have shown that bankruptcy prediction models are not stable over time. That is. the estimated statistical coefficients change from time period to time period. A possible reason is that accounting ratios are unlikely to be stable throughout such a time period and across so many different industries due to changes in inflation, interest rates, and phases of the business cycle which may be responsible for the differences in classification results from estimation to forecast periods. Therefore, there are a number of ways to cope with this instability problem. For example. Dambolena and Khoury |I9X0] used the variation of the ratios instead of their values as a measure of their stability. Altman and Izan |I9X 4|. Izan |I9X 4|, Platt and Platt |1 9 9 0 | proposed using industry relative ratios to control industry variation. Using a sample of Australian and American companies they presented stable classification results between within-sample and out-of-sumple. Mensah | 19X4] used phases of a business cycle to deal with the variation of American companies in different economic environments and proved that accuracy and structure of classification models differed across different economic conditions and industrial sectors. This thesis focuses on this key issue of the stability of predictive classification between ex post (within-sample)
and ex ante (out-of-sample). In this thesis, use of industry relative ratios and consideration of phases o f business cycles simultaneously to control time series and across-industries instability problems are investigated as the way to develop failure prediction models. Another theme of the investigation is to adjust for industry- specific differences in the aggregate model.
1.2 Objective of the Research
The objective o f this study is to develop a class o f stable business failure prediction models. To examine the effects on stability of forecasting between ex post and ex ante samples using industry relative ratios compared to unadjusted ratios. To investigate models based on different phases o f the business cycle, specifically, attention is focused on the interaction o f industry and business cycle effects. In addition, the study examines the difference between specific industry models and an aggregate model. The specific objectives o f the study are:
I : To test if the stability of business failure prediction between ex post and ex ante samples can be improved over time and across industries by using industry relative (mean and median) ratios.
2: To test if the stability of business failure prediction can be improved with respect to different phases of the business cycle: expansion, recession, and recovery using industry relative (mean), industry relative (median), and unadjusted ratios as compared to an aggregate model.
3. To test if the stability of business failure prediction results can be improved by using an industry-specific as compared to an aggregate model.
The principal objective o f this study is to examine whether the stability of a model forecasting business failure/distress can be improved over time and across industries using industry relative ratios as opposed to unadjusted ratios. Furthermore, the stability of forecasting with different phases of business cycles is also a major issue in examining failure/distress prediction models. It is frequently believed that financial characteristics are different for each different type of industry over time. The stability o f a prediction model developed from the sample of one industry may not be appropriate when applied to another industry. Therefore, industry-specific models are developed on the basis o f 41 financial ratios. 4 macro-economic variables, and II year dummy variables. This study will also present the results o f a univariate analysis and tests of the normality of the financial ratios used.
1.3 Importance of the Research
This study contributes to the existing research in several ways. First, this study highlights whether industry relative (mean and median) ratios can improve the stability of a prediction model over time and across industry. Edmister |I 9 7 2 |. Sudarsanam |IVK I|. and Sudarsanam and Taffler (I985J have found that the mean values of some accounting ratios vary from industry to industry. Izan |19H4) suggested the use of industry relative (median) ratios to reduce the impact of industry effect; Altman (19H3, 19X41 recommended that an adjustment of ratios is required to take into account industry differences and heterogeneous nature of failed firms. Foster ||y X ft| discusses the use of this approach to control industry differences in the financial ratios. Platt and Platt | I9y<)| found that using industry relative (mean) ratios can yield more stable forecasts of financial status across time periods. The Platt and Platt results arc an important motivation for developing a class of appropriate models and for examining the stability of forecasting failure prediction model.
Second, this study concentrates on different economic environments which can be expected to have an impact on the stability o f corporate failure prediction models. Mensah |19K4J stated that the accuracy and structure o f corporate predictive models differed across different economic environments. The accuracy of the model may improve if the models are re-examined over different time periods, such as expansionary, recessionary, and recovery periods. Different prediction models seem appropriate for companies in different industrial sectors even for the same economic environment. This is because of a lack of sufficient data within a time period, say recessionary period, for each specific industries. There are a number of ways around the stability problems over time across industries. One is to estimate industry-specific models. Another is to adjust for industry specific-differences in the aggregate model. W e establish that the best and more appropriate way to develop a class of stable failure/distress prediction model is the use o f industry relative ratios and the consideration of separate economic environments simultaneously.
Third, several researchers have concentrated their failure prediction effort on industry-specific models. For example. Meyer and Pifer [IV70] and Sinkey (1975) focused on commercial banks. Altman (19731 on railroads. Mason and Harris |I9 7 9 | on construction companies, Collins |I9X 0| on credit unions. Pantalone and Platt. |l9H 7b|; and Korobow, et al.. (1976) on commercial banks. Pantalone and Platt |19X7a| and Barth et ul., (1985) on thrift failure. Platt and Platt 11990| state that focusing on one industry is analogous to using industry relative ratios in samples including several industries. This study presents a comparison between the empirical result of using an industry relative ratio aggregate model and single industry model (Textile Industry).
Fourth, we investigate whether the prediction model developed from the sample of one industry may not be appropriate to upply to another industry. For example, companies in contracting m ay fail for reasons different from those in the Textile
industry. Therefore, it may be possible to improve the accuracy of the prediction of financial failure by taking into account industry differences. The sample used to develop the discriminant functions for each specific industry is based on the 16 broad classification industrial sectors.
Fifth, several authors (Dambolena and Khoury. (19X0) and Rose. Andrews, and Giroux. |I9X 2|) have suggested incorporating a macro-economic variable into the study of failure prediction. Cressy |1 9 9 l) used the economy-wide year-dummies on the potential for small firm bankruptcy to examine the differential impact o f time or more precisely of temporal economy-wide effects on bankruptcy probabilities. Not too many previous attempt has been made to explore the effects of macro-economic variables on individual large firm bankruptcies. This study also concentrates on using four traditional macro-economic variables (interest rate, annual inflation rate, real GNP. and industrial production) as well as year-dummies in the development of industry-specific failure prediction models.
Sixth, realistic prior probabilities are estimated from Department of Trade Companies Annual Reports (1974-19X5) with consideration of the costs of classification errors. Also proportional chance criteria, relative cost ratios, and Conover |I 9 7 I | T test are used for significance tests and model efficiency measure.
In conclusion, there is a need to develop a class of stable predictive models. Using UK financial ratios, macro-economic, and dummy variables as presented above, forecasting stability can then be examined with respect to the use of industry relative ratios and unadjusted ratios, separate business cycles and industry-specific models. Specifically, this study is intended to investigate the predictive ability o f fuilure prediction models
1.4 Hypotheses of the Research
Corporate failure prediction models are developed based on financial ratios. The independent variables to be used in model development fall into three groups. (I) Models are developed from each set o f individual financial ratios both with the industry relative ratios and unadjusted ratios. (2) Models are developed based on three business cycles using industry relative (mean and median) ratios and unadjusted ratios as compared an aggregate model. (3) Models are developed with 41 financial ratios, macro-economic variables, year dummy variables for each industry-specific and the aggregate samples.
The first set of comparisons analyses models are developed with industry relative ratios and unadjusted ratios in the ex ante sample. The related hypotheses can be stated below :
H ,: There is no difference in the predictive abilities of financial ratios between the industry mean ratios (IK K I) and the model of unadjusted ratios (UK) in the ex ante sample.
H2: There is no difference in the predictive abilities of financial ratios between the industry median ratios (IKK2) and the model of unadjusted ratios (IIK) in the ex ante sample.
H v There is no difference in the predictive abilities of financial ratios between the industry mean ratios (IK K I) and the model of industry median ratios (IKK2) in the ex ante sample.
The second set of comparisons analyses models are developed bused on business cycles in the expansionary phuse. The related hypotheses cun he stated below.
H< There is no difference in the predictive abilities of financial ratios between the industry mean aggregate model (IK K IA (t) and the model of industry mean ratios in the expansionary phase ( IKK I B I ) o f the business cycle.
Hfti There is no difference in the predictive abilities of financial ratios between the unadjusted ratios aggregate model (UK Afi) and the model of industry mean ratios in the expansionary (IKK I H I) phase of the business cycle.
H7: There is no difference in the predictive abilities of financial ratios between the industry median aggregate model <IKK2A(;> and the model of industry median ratios in the expansionary phase (IK K 2H I) o f the business cycle.
H#; There is no difference in the predictive abilities of financial ratios between the unadjusted ratios aggregate model (l)K A (i) and the model o f industry median ratios in the expansionary phase (IK K 2H I) o f the business cycle.
The third set of comparisons analyses models are developed based on business cycles in the recessionary phase. The related hypotheses can be stated below.
Hv: There is no difference in the predictive abilities of financial ratios between the unadjusted ratios aggregate model (HKA<*) and the model of unadjusted ratios in the recessionary phase (HKB2) of the business cycle.
H|„: There is no difference in the predictive abilities of financial ratios between the industry mean aggregate model (IK K IA fil and the model of industry mean ratios in the recessionary phase (IK K IH 2) o f the business cycle. H4: There is no difference in the predictive abilities of Financial ratios between the
unadjusted ratios aggregate model and the model of unadjusted
Hj2: There is no difference in the predictive abilities of financial ratios between the industry median aggregate model (IKK2A<i) and the model o f industry median ratios in the recessionary phase ( IKK2K2) of the business cycle.
H |3 : There is no difference in the predictive abilities of financial ratios between the unadjusted ratios aggregate model (tIKA<*) and the model of industry median ratios in the recessionary phase (IKK2R2) of the business cycle.
The fourth set of comparisons analyses models are developed based on business cycles in the recovery phase. The related hypotheses can be stated below.
H |4 ; There is no difference in the predictive abilities of financial ratios between the unadjusted ratios aggregate model lllK A (i) and the model of unadjusted ratios in the recovery phase (IIRR 3) of the business cycle.
H |v There is no difference in the predictive abilities of financial ratios between the industry mean aggregate model (IK K IA (t) and the model of industry m ean ratios in the recovery phase (IK K IR J) o f the business cycle.
H |ft: There is no difference in the predictive abilities of financial ratios between the unadjusted ratios aggregate model (HK A(t) and the model of industry m ean ratios in the recovery phase (IKKIH3) o f the business cycle.
H 17: There is no difference in the predictive abilities of financial ratios between the industry median aggregate model (IK K 2A (t) and the model of industry median ratios in the recovery phase (IKK2H.1) o f the business cycle. H1 1: There is no difference in the predictive abilities of financial ratios between
the unadjusted ratios aggregate model (IJR A (i) and the model o f industry mean ratios in the recessionary phase (IK KIK2) of the business cycle.
The fifth set of comparisons analyses models are developed with different industry- specific and the aggregate samples. The related hypotheses can be stated below.
H |V. There is no difference in the predictive abilities of financial ratios, macro economic and year dum my variables between the unadjusted ratios aggregate model and the model o f C on tractin g (Con) industry samples.
H20: There is no difference in the predictive abilities of financial ratios, macro- economic and year dum my variables between the unadjusted ratios aggregate model and the model of O eneral-K ngineering (CJE) industry sumples.
H2i; There is no difference in the predictive abilities of financial ratios, mucro- economic and year dum my variables between the unadjusted ratios aggregate model and the model o f Textile (Tex) industry samples.
H22: There is no difference in the predictive abilities o f financial rutios between the industry relative ratios model and the model o f u single (Textile) industry sample.
H23; There is no difference in the predictive abilities of financial ratios, macro- economic und year dummy variables between the unadjusted ratios aggregate model and the model o f O th e r M an u factu rin g (O th er) industry samples.
H24; There is no difference in the predictive abilities of financial ratios, macro economic and year dummy variables between the unadjusted ratios uggregute model and the model o f M iscellaneous ( M is) industry sumples.
H |x : There is no difference in the predictive abilities of financial ratios between the unadjusted ratios aggregate model (U R A (i) and the model of industry median rutios in the recovery phase (IR R2B3) o f the business cycle.
The statistics for the comparisons are presented in chapter 7-9 with discussion o f the results. Conclusions are stated in chapter 10.
Chapter 7 Ex Ante Sample UR Predictive Ability IRRI IRR2 UR H, h2 IKK 1 H , IRR2 Chapter 8
E xpansion Phase Predictive Ability
URBI IR R IB I IRR2BI Aggregate UR AC. IRRIAG IRR2AG H4 H , «7 Recession Phase Predictive Ability
URB2 IRRIB2 IRR2B2
Aggregate uRa g IRRIAG IRR2AG H , h" " 1 0 H |J H |2 Recovery Phase Predictive Ability
URB3 IR RIB3 IRR2B3
Aggregate URAG IRRIAG IRR2AG H u H |k H I7 Chapter 9 In d u stry Specific Predictive Ability
Con GE Tex Other Mis
URAG
IRRI H » H a, h 22H21 «27 »24
■ Contracting, t i t • General Engineering. l ex - Textile, - Other M anufacturing. Mis - Miscellaneous
1.5. Limitations of the Research
The limitations o f this study are in relation to the nature of data applied and to the sample used. These limitations include:
1. Generalizability of the results is limited to firms from the U.K. the Datastream data base, and the years study from 1974 to 1985.
2. Palepu ( 19MA) suggests that the use of non-random samples m akes the reported predictive results unreliable. Nevertheless, in an empirical context Zmijewski 11984) found that, although non-random samples gave rise to biases, the biases did not appear to materially affect the overall classification rates. (Keasey and Watson. 1991). Therefore, results developed based on the m atching approach in this study may differ from the nature of those from a random sample, and so may not be generalizable to all firms on the basis of previous researcher s findings.
3. The accuracy and reliability of the model developed from the use o f industry relative ratios is limited to the Datastream data base, the muin source of information from U.K.. for IA broadly classified sectors, 41 financial ratios for each firm.
4. Observations were placed into five groups: Contracting. General-Engineering. Textile. Other Manufacturing and Miscellaneous, to derive industry specific- models. Consequently, conclusions derived from certain industries may not be applicable elsewhere.
5. The model developed from each specific industry is limited to a sufficient sample o f available failed firms. Alunan |I9K3| suggests thut 15 to 20 is the minimum number thut is required in each group for a reliuble statistical analysis to be possible. However, contracting und generul-engineering
industries are below by this minimum. Other manufacturing and miscellaneous industries are too broadly defined to represent a single industry. Therefore, this thesis will concentrate on the limited applicability across industries, the textile industry may be the only applicable case to interpret the empirical result comparing the different between the industry relative ratios and a single industry.
Some of these limitations are endemic to this type of research study. Any empirical study is limited in its generalizability unless the study samples cover the complete population.
1.6 Outline of the Chapters
This thesis is separated into ten chapters. Chapter I describes the introduction, objectives, importance, limitations, hypotheses o f the research, and outline of each chapter.
Chapter 2 presents the methodology of model selection, including the univariute approach, multivariate approach (discriminant analysis), conditional probability approach (logit and probit analysis), classification tree (rule induction) and non- parametric approach, probit. and survival analysis.
Chapter 3 focuses on the methodology of choosing independent variables and dependent variables, incorporating the development of a theory for financial failure, selection of independent ratios, cash flow ratios, macro-economic variables, price level adjustments, the definition of company failure and sample derivation.
Chapter 4 reviews the economic and industry influences, containing the definition of business cycles, industry influences, prediction und stability, how to develop a class
of stable industry relative ratios, alternative methods to select industry relative ratios, and developing industry-specific models.
Chapter 5 describes this thesis methodology, research design, sample selection, data analysis-introducing the objective and assumption o f multivariate discriminant analysis, evaluating the significance of independent variables, incorporating prior probabilities and misclassification costs, validation techniques.
Chapter 6 introduces the statistical problems o f outlier, data distribution and transformation, normality testing, correlation analysis, univariate (profile) analysis, and the industry and economic environmental effects.
In chapter 7. the results of examining the forecasting stability o f failure prediction models between the use of industry relative ratios and unadjusted ratios are presented, examines the stability of forecasting between the within-sample and out-of-sample predictions.
Chapter H examines three different economic environments (expansionary, recessionary, and recovery periods) between the use of industry relative (mean and median) ratios and unadjusted ratios.
Chapter 9 compares each specific industry model and the aggregate model, and tries to develop each specific industry model.
Chapter 10 is the finul chapter. It introduces a summary, und the main conclusions of this thesis, and suggests further ureas for reseurch.
C hapter 2. Statistical Approaches to Modelling
2.1 Introduction
Ratio analysis has been used for decades for a number of applications, including credit risk appraisal and failure/distress prediction purposes. There is a substantial body of prior literature employing various statistical methods to develop failure prediction models. T o aid understanding such statistical approaches to modelling corporate failure we will review the following techniques for model selection. Table 2 .1 displays a summary o f the statistical approaches to modelling.
2.2 Univariate Approach
In a univariate approach a single financial ratio is used in the prediction process as an indicator to distinguish the performance o f failed firms from non-failed firms. The procedure is to compare the means of ratios o f the failed group and of a control group over time (for example, five years prior to failure) to identify the best ratio for failure prediction. One reason for the employment of the univariate approach in the early studies was partly the lack of computer programs that easily calculate more complex statistics. As a result, m ost authors, at least up until Altman | l9ftH|, contributed to the univariate approach. However failure is a multidimensional process which is unlikely to be fully reflected in a single ratio, A single ratio is susceptible to faulty interpretation and potential confusion. Therefore. Altman |l9ftX | was the pioneer in using multivariate methods
Tabl« 2-1 A Summary of the Statistical Approaches To Modelling Corporate Failure
Beaver |1966] and Tamari (1966) were the two important persons in the univariate analysis from I960 to date. Among the previous authors, Tamari | I9 6 6 | analysed the accounts o f 2X Israeli manufacturing companies that went bankrupt or nearly bankrupt in the period 1956-1960 and found that for several years prior to their liquidation they had lower ratios than the other industrial companies, and that in most instances the ratios showed a downward trend in the period examined. Especially m arked was the drop in the ratio of net worth to total liabilities, net profit to turnover, and the quick ratio.
These findings, however, did not apply completely to all the companies o f his sample. The current ratio of one company in his sample had an increase prior to bankruptcy. Only 12 out o f the 28 failed companies had all three constituent ratios fulling. Tamuri 119 6 6 1 concluded that: "the analyst cannot rely on single ratio alone in measuring the degree of risk". Therefore Tamari constructed an index that can be expressed as a combination o f six ratios with the following percentage weightings:
Equity Capital + Reserves / Total Fund 25
Profit trend 25
Current Ratio 20
Value of Production / Inventory 10
Sales / Trade Receivable 10
Value of Production / Working Capitul 10
He found that his index provided fairly good criteria for separating fuiled from non- failed firms. 75‘tf- of failed firms hud fewer than 35 points on the scale, whereas good performance firms had more than 46 points. The scale comprised ratios from four main financial structures (solvency, profitability, liquidity, and efficiency). Each of them acquired approximately the sume weighting in the index und comparison between the failed and non-fuiled firms indicated a clear discriminating ability.
Discussion: The choice of ratios was based solely on his judgement and without rigourous statistical analysis. However, he did demonstrate the positive association between adverse ratios and business failure.
Beaver 11966. I96X| employed empirical research in business failure prediction using a univariate analysis. Beaver was the first one to be comprehensively concerned with the univariate analysis to predict corporate failure. The objective of Beavers study |I 9 6 6 | was to examine the predictive usefulness of accounting ratios. He used Moody's Industrial Manual, supplemented by a list of publicly owned firms from Dun and Bradstreet. and produced 79 failed firms in 3K different industries which had failed between 1954 and 1964 compared with a similar 79 non-failed firms. The selection of non-failed firms was based on a paired-sample design according to the same industry, asset sire and the corresponding year. The aim of employing the paired-sample design and selecting criteria was to have "control" over the effects of industry, sire and economy-wide conditions that otherwise might blur the relationship between accounting ratios and failure.
Som e industries have a higher failure risk th an oth ers, and it can be shown that larger firms have a lower failure risk than small firms with a smaller capital base. The equally weighted m eans of 30 financial ratios were collected for five years before failure based on the popularity and success in previous studies. Thirty accounting ratios were then grouped into six "common element" (numerator or denominator) groups and one ratio was selected from each group including: (I). cash flow / total assets, (2). net Income / total assets. (3). total debt / total assets, (4). working capital / total assets. (5). current ratios, and (6). no credit interval. I & 2 are profitability. 4 & 5 are liquidity. 3 is solvency, and 6 is efficiency on the ba