E
X
C
H
A
N
G
E
Is CEO Pay Too High and Are Incentives Too Low? A
Wealth-Based Contracting Framework
by John E. Core and Wayne R. Guay
Executive Overview
In the wake of the recent financial crisis, proposals have been put forward to resolve “problems” with executive pay and incentives. Although these proposals discuss ways firms or regulators might get executives to hold greater incentives, they fail to identify how one should determine whether an executive has enough (or too much) incentives. We lay out an economic framework for thinking about what level of based incentives an executive should have. In doing so, we emphasize how performance-based incentives are linked to executive pay levels, as well as to the level of executives’ wealth. We also make clear both the benefits and costs of performance-based incentives.
I
n the wake of the recent financial crisis, U.S. executive compensation has, once again, come under fire from regulators, politicians, the finan-cial press, the general public, and some academics. In this paper, we focus on issues related to top executives’ performance-based incentives (com-monly referred to as “pay-for-performance”). In doing so, we emphasize how performance-based incentives are linked to executive pay levels, as well as to the level of executives’ wealth.Top executives’ performance-based incentives have been front and center in recent regulatory attention and proposals. On June 10, 2009, the Treasury Department issued an interim final rule on the Troubled Asset Relief Program (TARP), establishing standards for regulating compensa-tion practices at firms receiving government assis-tance. A key element of these standards is to severely limit cash pay to top executives,
effec-tively requiring most of these executives’ compen-sation to be paid in the form of stock (with various restrictions). Further, several prominent academ-ics (e.g., Bebchuk & Fried, 2009; Bhagat & Ro-mano, 2009) have called for greater emphasis on equity-based pay, as well as restrictions on execu-tives’ ability to sell equity, both during their ten-ure and beyond retirement. A key concern with all of these proposals, however, is the failure to articulate a framework for determining the appro-priate level of executive incentives. Rather, these proposals simply discuss ways firms or regulators might get executives to hold greater incentives without identifying how one should determine whether or when an executive has enough (or too much) incentives.
We lay out an economic framework for think-ing about how much performance-based incen-tives an executive should have. This framework makes clear that there are both benefits and costs of imposing performance-based incentives on ex-ecutives, and that agency problems arise when
We thank Garry Bruton for helpful comments and Rahul Vashishtha for excellent research assistance. We also thank The Wharton School for financial support.
*John E. Core ([email protected]) is Ira A. Lipman Professor of Accounting at The Wharton School at the University of Pennsylvania.
Wayne R. Guay([email protected]) is Yageo Professor of Accounting at The Wharton School at the University of Pennsylvania.
executives have either too little, or too much in-centives. We also note that because U.S. execu-tives typically have much stronger performance-based incentives than executives in any other country (e.g., Conyon, Core, & Guay, 2009), it is not at all obvious that U.S. executive compensa-tion practices suffer from too little pay-for-perfor-mance. These arguments suggest that wide-reaching, indiscriminate calls for greater performance-based incentives for U.S. executives may do more harm than good.
A key takeaway from our discussion is that performance-based incentives must be considered in the context of each executive’s personal wealth. For example, a requirement that all exec-utives hold $10 million in firm stock will result in very different incentives for an executive with $100 million in outside wealth than for an exec-utive with only $10 million in outside wealth. There is a popular saying that an executive should have “skin in the game.” But what constitutes significant “skin” for one executive might be rel-atively trivial for another executive. Finally, while the merits of wealth-based contracting seem worthwhile, there are undoubtedly issues to re-solve with respect to obtaining information about executives’ wealth. Public disclosure of such data (e.g., through proxy statements) is tricky due to issues of privacy. However, private disclosure of this information to boards, with more generic disclosures assuring investors that boards have considered this information, seems workable.
Descriptive Data on U.S. CEO Compensation and Equity Incentives
W
e begin by providing descriptive information on U.S. CEO compensation and equity in-centives (see Table 1). We chose as our sample S&P 500 CEOs. The S&P 500 firms are among the largest firms in the world and are among the most successful firms in the United States. Our sample consists of S&P 500 CEO compensation data from 1993 to 2008.1We showmedian data to give a good sense of the center of the distribution without having the data skewed by outliers. We emphasize, however, that these data are descriptive (that is, we do not draw sta-tistical inferences from our analysis).
Column 1 of Table 1 shows median annual stock returns, by year, for the sample firms. In spite of the poor stock performance in 2008, the median return for the entire sample period is 8.5%, reflecting the influence of two earlier bull markets for equities (the late 1990s and the mid-2000s). Column 2 shows beginning-of-year mar-ket value of equity for the sample firms. Consis-tent with the overall positive stock price performance shown in Column 1, median market value grows from $3.4 billion in 1993 to $14.2 billion in 2008. Total annual pay for the median CEO is reported in Column 3. Total annual pay is the sum of CEO salary, bonus, the value of stock and option grants, and other annual pay for the year shown. Over the period, median total pay grows from about $2.0 million to $7.6 million (values are not inflation-adjusted). This growth rate over the sample period is about the same as the growth rate in market value of equity for the firms these CEOs manage. In other words, pay as a fraction of firm market value has remained roughly constant over the sample period, which is consistent with theory and supporting empirical work by Gabaix and Landier (2008), who predict that CEO pay grows with firm size (as measured by market value). The fourth column shows the be-ginning-of-year market value of the median CEO’s stock and option portfolio, and the fifth column shows a measure of the median CEO’s beginning-of-year incentives stemming from these equity holdings. Specifically, we express incen-tives as “stock equivalent value.” To do this, we adopt the method in Core and Guay (2002) and convert options into stock equivalents.2
For an example of the interpretation of this
1The composition of the S&P 500 firms changes over time as firms are
lost due to acquisition or poor performance and as firms are added due to good performance. To avoid selection bias issues, we chose all firms in the S&P 500 at December 31 of each year. We then obtained compensation
data for each firm’s CEO for the next fiscal year ending at least a year and a day after that December 31. For example, for firms in the S&P 500 on December 31, 2006, we matched compensation data for the fiscal years ending January 1, 2008 to December 31, 2008.
2This conversion of stock options into stock equivalent value is
necessary because $1 of options provides greater incentives to increase stock price than does $1 of stock (options provide more incentives because they are effectively a leveraged position in firm stock).
T1
Fn1
incentive measure, consider the median CEO with $66.0 million in incentives in 2008. If this CEO’s firm experienced a negative stock return of 20% during the year, the CEO’s portfolio would decrease in value by approximately $13.2 million (–20% times $66.0 million in incentives).3 Note that this $13.2 million decrease is large; in fact, it is larger than the median CEO’s 2008 pay of $7.6 million.4
The final column shows the median of the ratio of pay to incentives, which has a median value of 14.5% over the sample period. One interpretation of this ratio is that it shows the negative stock return necessary for the median CEO’s incentive losses to be as great as annual pay. A second, more interest-ing, interpretation is that it sheds light on how much pay the CEO receives relative to the amount of incentives he holds. In other words, as we discuss below, we expect that CEO incentives and pay are linked. Wealthier CEOs need a greater dollar value of incentives (because wealthier CEOs have better
3We say “approximately” here because the incentive measure for
options is technically accurate for only a marginal (i.e., small) change in the stock price.
4Another way to measure incentives is the ratio of incentives to firm
market value, or the CEO’s fractional ownership of the firm. By this measure, the median CEO owns about 0.5% of her firm. There is a debate in the literature as to whether dollar ownership or fractional ownership is
the proper measure of thebenefitsof incentives (see Baker and Hall, 2004). But, as we discuss below, it seems clear that dollar ownership measures the CEO’scostof incentives.
Table 1
Median Stock Returns, Firm Market Value, CEO Pay, Portfolio Value, and Incentives for S&P 500 firms: 1993 to 2008
Year
Stock Return
Beginning-of-Year Firm Market Value
(billions) Total Annual Pay (millions) Beginning-of-Year Portfolio Value (millions) Beginning-of-Year Incentives “Stock Equivalent Value”
(millions) Annual Pay/ Beginning-of-Year Incentives (1) (2) (3) (4) (5) (6) All years 8.5% 7.2 5.2 27.1 40.2 14.5% 1993 10.8% 3.4 2.0 7.7 11.4 20.3% 1994 "0.9% 3.4 2.4 10.2 14.7 18.0% 1995 26.2% 3.3 2.7 10.6 15.6 19.2% 1996 17.3% 4.6 3.0 12.8 19.0 17.0% 1997 25.2% 5.3 3.8 17.5 26.7 16.4% 1998 4.7% 6.7 4.2 24.0 34.9 12.9% 1999 3.4% 7.4 5.3 26.9 40.7 16.0% 2000 7.6% 8.0 6.3 35.5 50.2 15.8% 2001 "1.3% 8.4 6.8 39.3 55.3 13.2% 2002 "9.8% 7.7 6.4 35.1 53.2 13.9% 2003 25.6% 7.2 6.6 31.6 46.9 15.4% 2004 17.3% 8.5 7.0 38.5 58.7 13.2% 2005 5.7% 10.8 7.2 45.0 68.0 11.0% 2006 14.4% 12.2 8.2 45.8 74.2 12.0% 2007 5.3% 14.2 8.6 48.5 78.7 11.6% 2008 "29.7% 14.2 7.6 43.0 66.0 11.7% Growth – 10.1% 9.4% 12.2% 12.4% "3.6%
The sample consists of S&P 500 CEO compensation data from 1993 to 2008. Values are not inflation-adjusted.Total Annual Payis median CEO salary, bonus, stock and option grants, and other pay for the year shown.Beginning-of-Year Portfolio Valueis the median total value of stock plus the value of exercisable and unexercisable options held by the CEO at the beginning of the year shown. To compute the value and incentives of the CEOs’ option portfolio, we use the method developed by Core and Guay (2002) with a modification that assumes times-to-exercise equal to 70% of the stated times-to-maturity.Beginning-of-Year Incentivesis an estimate of the change in the beginning-of-year value of CEO stock and option holdings for a 100% change in stock price.Annual Pay/Beginning-of-Year Incentivesis the ratio ofAnnual PaytoBeginning-of-Year Incentives.
Fn3
outside opportunities and are therefore more difficult to motivate), and CEOs with more incentives tend to get higher pay (because executives are typically risk averse and require a premium for bearing incen-tive risk). Interestingly, Column 6 of Table 1 shows that the ratio of pay to incentives has been decreas-ing over the sample period, suggestdecreas-ing that CEOs received less pay per unit of incentives in 2008 than they did in 1993.
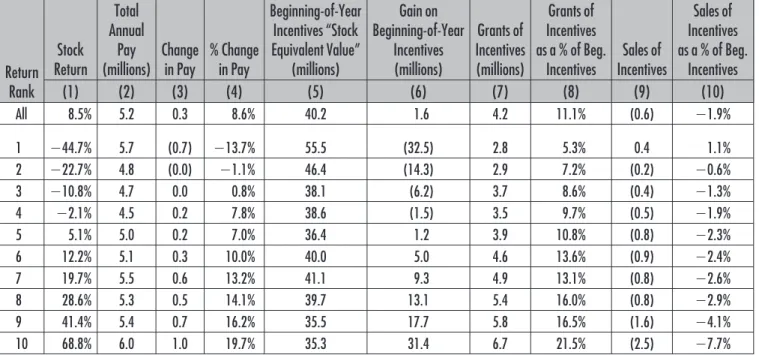
Table 2 illustrates CEO pay-for-performance stemming from both changes in annual pay and equity portfolio value. Regarding annual pay, boards can impose pay-for-performance on CEOs by in-creasing or dein-creasing pay as a function of firm performance. Regarding equity portfolio value, boards impose pay-for-performance by requiring CEOs to hold stock and options that increase and decrease in value with the stock price. In Table 2, we rank the sample firms into ten groups based on the stock return during the year. The first column shows the median stock return for each group; the second
column shows median annual total pay. The third column shows the median dollar change in pay (from the prior year), and the fourth column shows the median percentage change in pay.
The first four columns of Table 2 indicate that pay exhibits pay-for-performance in the sense that higher stock returns are associated with greater per-centage pay changes. CEOs in the highest stock return group experience a $1.0 million increase in pay, compared to a decrease in pay of $0.7 million for CEOs in the lower stock return group. However, as contended by critics of executive pay, bad perfor-mance is not severely punished in annual pay. In-deed, in our sample, the worst performers have me-dian stock returns of –44.7%, but have only a median decrease of 13.7% in their pay.5
5We note that our calculations require the CEO to be in office at the
beginning of the year and the end of the year. By requiring the CEO to be in office at the end of the year, we exclude the worst-performing CEOs who get fired during the year, which somewhat understates the pay loss to poor-performing CEOs.
Table 2
Median Change in Pay, Gain on Incentive Portfolio, Grants of Incentives and Sales of Incentives for CEOs of S&P 500 Firms from 1993 to 2008 Ranked on Stock Return
Return Rank Stock Return Total Annual Pay
(millions) Changein Pay % Changein Pay
Beginning-of-Year Incentives “Stock Equivalent Value” (millions) Gain on Beginning-of-Year Incentives (millions) Grants of Incentives (millions) Grants of Incentives as a % of Beg.
Incentives IncentivesSales of
Sales of Incentives as a % of Beg. Incentives (1) (2) (3) (4) (5) (6) (7) (8) (9) (10) All 8.5% 5.2 0.3 8.6% 40.2 1.6 4.2 11.1% (0.6) "1.9% 1 "44.7% 5.7 (0.7) "13.7% 55.5 (32.5) 2.8 5.3% 0.4 1.1% 2 "22.7% 4.8 (0.0) "1.1% 46.4 (14.3) 2.9 7.2% (0.2) "0.6% 3 "10.8% 4.7 0.0 0.8% 38.1 (6.2) 3.7 8.6% (0.4) "1.3% 4 "2.1% 4.5 0.2 7.8% 38.6 (1.5) 3.5 9.7% (0.5) "1.9% 5 5.1% 5.0 0.2 7.0% 36.4 1.2 3.9 10.8% (0.8) "2.3% 6 12.2% 5.1 0.3 10.0% 40.0 5.0 4.6 13.6% (0.9) "2.4% 7 19.7% 5.5 0.6 13.2% 41.1 9.3 4.9 13.1% (0.8) "2.6% 8 28.6% 5.3 0.5 14.1% 39.7 13.1 5.4 16.0% (0.8) "2.9% 9 41.4% 5.4 0.7 16.2% 35.5 17.7 5.8 16.5% (1.6) "4.1% 10 68.8% 6.0 1.0 19.7% 35.3 31.4 6.7 21.5% (2.5) "7.7%
The sample consists of S&P 500 CEO compensation data from 1993 to 2008.Return Rankis the decile rank ofStock Returnacross all years.Stock Returnis the with-dividend return for the year in which pay is paid.Total Annual Payis median CEO salary, bonus, stock and option grants, and other pay for the year shown.Change in Payis current year pay minus last year’s pay.% Change in Payis the percentage current year pay from last year’s pay.Beginning-of-Year Incentivesis an estimate of the change in the beginning-of-year value of CEO stock and option holdings for a 100% change in stock price.Gain on Beginning-of-Year Incentivesis beginning-of-year incentives valued at the year-end stock price minus beginning-of-year incentives valued at the beginning-of-year stock price.Grants of Incentivesis new incentives from option and stock grants.Sales of Incentivesis end-of-year incentives minus new equity grants minus what beginning-of-year incentives would have been at the end of beginning-of-year stock price if the CEO held all of his equity.
T2
Looking only at pay changes, however, misses the majority of CEO incentives, which come from hold-ings of stock and options. To illustrate how these portfolio incentives compare to incentives stemming from changes in annual pay, the fifth column of Table 2 shows the median CEO’s beginning-of-year stock equivalent incentives. The sixth column shows the performance-related gain or loss on these equity holdings during the year (computed as the beginning-of-year incentives valued at the year-end stock price minus the beginning-of-year incentives valued at the beginning-of-year stock price). These data make clear that bad performance is, indeed, severely punished—the worst performers show a me-dian loss of $32.5 million, which is vastly larger than the decrease in annual pay suffered by the CEOs of poorly performing firms. In summary, Columns 1 through 6 of Table 2 illustrate the point that large stock price changes will cause large changes in the value of the CEO’s portfolio and wealth even though changes in annual pay tend to be fairly small. If one does not consider the incentives delivered by CEO equity portfolios, one could reach the false conclusion that CEOs have low incentives because their pay does not vary strongly with performance.
Before discussing the remaining columns of Table 2, we first want to illustrate how CEO pay and equity incentives change over the typical CEO’s tenure. This analysis provides insight into concerns raised by some critics that executives do not adequately build up their equity holdings over their tenure, and as a result should be required (via regulation) to hold most or all of their equity-based pay during their tenure with the firm. In Table 3, we rank the CEOs by tenure into 10 groups (e.g., tenure less than 2 years, between 2 and 3 years, up through tenure over 10 years).6Consistent with prior research, Column 1 shows that CEO pay has no consistent relationship to tenure. Incentives, however, increase strongly with tenure (Column 2), again consistent with prior research (Core & Guay, 1999). The reason for this relationship (shown in the remaining columns) is that the median, or typical, CEO holds onto most of the equity value generated both through new equity
grants and through appreciation in current holdings. Columns 3 and 4 show that the typical CEO re-ceives a substantial amount of annual equity grants that add about 11.1% to existing equity incentives. This percentage, however, is considerably higher for new CEOs (about 15% to 20%) than for CEOs with longer tenures (about 4% to 9% for CEOs with more than eight years of tenure). The reason for this trend follows from the descriptive evidence in Columns 1 and 2, which shows that pay remains roughly con-stant throughout a typical CEO’s tenure, but that incentives rise significantly over tenure. Thus, al-though much of the CEO’s pay comes from new incentive grants, the new equity grants add a smaller and smaller percentage increase to incentives as the CEO’s tenure increases. The typical CEO’s incen-tives also increase by about 8.0% per year due to appreciation in equity holdings (see Columns 5 and 6).7 As the CEO’s incentives grow over his tenure, so do his dollar gains on incentives, though the percentage increase in incentives remains roughly constant.8
Although new equity grants and gains on existing incentives have the potential to increase the CEO’s incentives over time, the CEO may also decrease incentives periodically by selling equity. We calculate sales (Columns 7 and 8) as end-of-year incentives minus new equity grants minus what be-ginning-of-year incentives would have been at the end-of-year stock price if the CEO held all of his equity. Effectively, this sales measure is zero if the CEO holds all granted incentives and makes no equity sales, and is negative (positive) if the CEO sells (buys) equity.9The data show that the typical CEO sells only about 1.9% of her equity incentives each year. Further, although dollar equity sales in-crease with CEO tenure, even for long-tenured CEOs, sales are only about 3% of the
beginning-of-6Because our calculations require the CEO to be in office at the
beginning of the year and the end of the year, the minimum CEO tenure is 1.0 years.
7Recall that we compute gains on incentives using price changes. This
means that we omit dividends, and that the percentage gains tend to be smaller than returns. On the other hand, nonlinearities in options tend to make the percentage gains larger than returns.
8Recall that the data in the tables are medians, and so do not add.
Also, one cannot multiply the median return by median incentives to get the median gain.
9Again, we note that there are small measurement errors due to option
nonlinearities. Also, note that this calculation considers cash dividends as nonfirm income, so the sale calculation does not include income from dividends. In other words, if a firm has a high dividend yield, a CEO is able to “sell” or reduce his position in firm stock by not reinvesting dividends. T3
Fn6
Fn7
Fn8
year equity incentives. Overall, the data indicate that the median or typical CEO receives grants and gains in incentives of about 19% each year, and sells a modest 2% (for longer tenured CEOs, these figures are about 15% and about 3%, respectively). Thus, not surprisingly, CEO incentives increase strongly with tenure.10
Returning now to Table 2, we examine how stock sales vary with current performance. Col-umn 9 indicates that the median CEO of a strongly performing firm sells more stock than the median CEO of a poorly performing firm. If CEOs are required to hold incentives as a percentage of their wealth (as will be discussed in detail later in
the paper), this finding is not surprising. Strong stock price performance increases the value of the CEO’s stock and option holdings and likely re-duces the diversification of the CEO’s overall wealth (i.e., by increasing the value of firm stock-holdings as a percentage of the value of the CEO’s total wealth). Thus, the CEO is expected to sell stock to reduce her percentage of firm stock back to its earlier level (i.e., to rebalance her portfolio). It is important to note, however, that the stock sales of the median CEOs in the strong perfor-mance groups are small compared to the in-crease in CEOs’ incentives due to gains and to stock and option grants (i.e., Column 9 as com-pared to the sum of Columns 6 and 7). There-fore, the median CEO sells little stock. Thus, while it is certainly the case that some CEOs sell large amounts of stock, there does not ap-pear to be support for critics’ claims that there is widespread unwinding of incentives by CEOs following good performance.
10Ofek and Yermack (2000) and Core and Guay (1999) provided
related (and generally consistent) results. Both studies found that when CEOs have relatively low equity incentives, the firm and the CEO tend to take actions to build up incentives over time. Specifically, Ofek and Yermack found that CEOs with low (high) equity incentives hold (sell) incentives from new equity grants. Core and Guay found that CEOs with low (high) equity incentives tend to receive greater (smaller) equity grants in their compensation packages.
Table 3
Median Pay, Grants of Incentives, Gain on Incentive Portfolio, and Sales of Incentives for CEOs of S&P 500 Firms from 1993 to 2008 Ranked on Tenure
Tenure in years (t) Rank Total Annual Pay (millions) Beginning-of-Year Incentives (millions) Grants of Incentives (millions) Grants of Incentives as a % of Beg. Incentives Gain on Beginning-of-Year Incentives (millions) Gain on Beginning-of-Year Incentives as a %
of Beg. Incentives IncentivesSales of
Sales of Incentives as a % of Beg. Incentives (1) (2) (3) (4) (5) (6) (7) (8) All 5.2 40.2 4.2 11.1% 1.6 8.0% (0.6) "1.9% 1!t#2 4.7 19.2 3.8 20.7% 0.6 8.5% (0.1) "0.4% 2!t#3 5.0 25.1 4.2 17.2% 1.0 7.6% (0.0) "0.3% 3!t#4 5.5 31.6 4.5 15.1% 1.3 6.8% (0.4) "1.4% 4!t#5 5.5 34.6 4.7 14.6% 2.0 9.1% (0.5) "2.0% 5!t#6 5.3 43.6 4.2 10.7% 0.9 5.0% (0.5) "1.5% 6!t#7 5.3 48.5 4.5 10.0% 2.2 7.4% (0.6) "2.1% 7!t#8 5.5 52.5 4.5 10.0% 2.1 8.0% (1.5) "4.0% 8!t#9 5.0 55.2 3.8 8.7% 1.3 6.0% (1.0) "2.6% 9!t#10 5.6 59.8 4.9 8.4% 1.8 8.8% (2.1) "3.0% 10!t 5.1 93.9 3.8 4.3% 4.2 9.9% (2.3) "3.0%
The sample consists of S&P 500 CEO compensation data from 1993 to 2008.Tenure Rankis the rank of CEO tenure across all years.Total Annual Payis median CEO salary, bonus, stock and option grants, and other pay for the year shown.Beginning-of-Year Incentivesis an estimate of the change in the beginning-of-year value of CEO stock and option holdings for a 100% change in stock price.Grants of Incentivesis new incentives from option and stock grants.Gain on Beginning-of-Year Incentivesis beginning-of-year incentives valued at the year-end stock price minus beginning-of-year incentives valued at the beginning-of-year stock price.Sales of Incentivesis end-of-year incentives minus new equity grants minus what beginning-of-year incentives would have been at the end of year stock price if the CEO held all of his equity.
Understanding the Relationship Between U.S. CEO Wealth, Pay, and Incentives
T
here are many complaints about U.S. CEOcompensation. Here we largely focus on two key concerns: Pay-for-performance incentives are too low, and/or pay is too high.11These con-cerns are related in the sense that executive pay reflects a risk premium for the incentives borne by the executive. Thus, if pay is argued to be too high, this problem could be rectified by lowering pay and holding incentives the same. Alterna-tively, if incentives are argued to be too low, this problem could be rectified by increasing incen-tives and holding pay the same. And, if critics wish to argue that pay is too high and incentives are too low, then it is important for the critics to recognize that the risk premium will constrain how much pay could be lowered and/or how much incentives are increased.12A related complaint is that executive incentives are too low because it is too easy for them to “unwind” their incen-tives by selling equity. However, as noted above and as shown in Table 2, such sales do not appear widespread.
In this section, we develop an economic frame-work for considering the merits of these critiques of executive pay and incentives. Specifically, to assess how executive pay and incentives might be improved requires one to first consider the eco-nomic forces that shape how and why CEO pay and incentives look as they do. Further, although it is easy to dismiss certain aspects of these cri-tiques (e.g., that U.S. CEOs lack pay-for-perfor-mance in their compensation plans), as we illus-trate below, a thoughtful examination of these issues yields a richer set of insights.
As a reference point, consider the median CEO in 2008 in Table 1 who holds a portfolio of stock and options with $66.0 million in stock equiva-lent value, meaning that the portfolio would
change in value by about $6.6 million for a 10% change in stock price. Does this CEO hold the right amount of incentives, and is his pay right given these incentives?
Below we articulate three key determinants in answering these questions: 1) How difficult is it to monitor the CEO, and how severe are the agency conflicts?, 2) how risk averse is the CEO?, and 3) how wealthy is the CEO? The first two of these determinants have received considerable atten-tion in the literature. We emphasize the third determinant, CEO wealth, as an important con-sideration in setting pay and incentives that has received relatively little attention. It is intuitive that individuals will be motivated by monetary gains relative to their wealth. In other words, the risk of a $6.6 million gain or loss will be viewed quite differently by an individual with $10 million in wealth than by an individual with $1 billion in wealth. The individual with $10 million may find the prospect of a $6.6 million gain or loss to be more paralyzing than motivating. The individual with $1 billion, on the other hand, may be rela-tively unmotivated by the prospect of a $6.6 mil-lion gain or loss.
Firm-Level Determinants of Incentives
A CEO’s job is extremely complex. The CEO is the individual ultimately responsible for the firm’s strategic investments, operating activities, human resources management, financing decisions, and overall firm performance. And, because the CEO has specific knowledge useful for decision making that is costly to transfer, it is difficult (or impos-sible) for the board or shareholders to give the CEO detailed, step-by-step instructions on how this job should be carried out (Fama & Jensen, 1983). Rather, the shareholders delegate nearly all decision-making responsibilities to the board of directors, who in turn delegate the majority of decision-making responsibilities to the CEO and executive team. Shareholders’ delegation of deci-sion rights to the CEO carries with it a concern that the CEO may use this discretion for purposes that are not in the shareholders’ best interests. For example, the CEO may not put in the sharehold-er-preferred level of effort in selecting investments or in supervising his executive management team.
11For further arguments and evidence that U.S. CEO pay is not too
high, see Kaplan (2008).
12Hoskisson, Castleton, and Withers (2009) made a similar point in
the context of overall monitoring intensity. They argued that when firms monitor executives more intensively, executives are exposed to greater job security risk, which in turn requires the firm to pay greater compensation to the executives for bearing this risk. They also noted that critics of executive pay must consider allowing firms to reduce monitoring intensity if they wish to reduce executive pay levels.
Fn11
Or, given that most individuals are inherently risk-averse, the CEO may forgo certain valuable investments if he perceives those investments to be too risky. Still another concern is that the CEO may extract private benefits (such as excessive perquisites or excessive compensation) that the shareholders would prefer to limit.
A key mechanism in resolving these agency conflicts with executives (from both a theoretical and an empirical perspective) is to tie executives’ wealth to shareholder performance, thereby in-ducing executives to make decisions that are in shareholders’ interests (e.g., Jensen & Murphy, 1990). This feature of the compensation plan is commonly referred to as providing the executive with “incentives” or, more colloquially, “pay-for-performance.” As we discussed and illustrated in Table 2, however, the term “pay-for-performance” is a misnomer. Annual pay can, but need not, vary with performance. Rather, most CEOs’ incentives can (and in fact usually do) stem largely from holdings of stock and options as opposed to perfor-mance-related variation in annual pay.13
CEO-Level Determinants of Incentives
Having established that stock and option holdings constitute most of CEOs’ performance-based in-centives, we move now to the more important question of how to determine whether CEOs have the right amount of incentives. To answer this question, we consider the costs and benefits of imposing incentives on a CEO. In our discussion, we assume simple preferences for the CEO: he likes wealth, dislikes effort, and dislikes risk. Fur-ther, we assume that the board must impose per-formance incentives on the CEO to mitigate agency conflicts stemming from deviations be-tween the CEO’s and shareholders’ preferences (e.g., the board cannot fully mitigate these agency conflicts through direct monitoring or other
gov-ernance mechanisms). To impose performance in-centives, the board uses a compensation scheme that rewards (penalizes) the CEO for increases (decreases) in shareholder value. Specifically, it requires him to hold more firm stock and fewer diversified assets than he prefers. This scheme imposes risk on the CEO because the firm’s stock price is influenced not only by factors within the CEO’s control, but also by economic forces that are beyond the CEO’s control (e.g., shocks in technology, the competitive environment, regula-tion, political upheaval, and the state of the econ-omy).
The CEO preferences and the resulting poten-tial agency conflicts outlined above imply that incentives, if structured properly, encourage the CEO to make choices that are in the best interests of the firm’s owners. To the extent that boards and shareholders can either directly monitor CEOs’ actions or use other governance mecha-nisms to indirectly reduce agency conflicts, strong performance-based incentives will be less neces-sary (e.g., Prendergast, 2000). However, in set-tings where it is difficult to monitor the CEO’s actions, such as in business environments charac-terized by rapid growth and changing technology, performance incentives are typically required to a greater extent. Thus, boards must assess how much direct monitoring of the CEO’s decisions is feasi-ble before determining the magnitude of perfor-mance-based incentives to impose on the CEO.
A further determinant of CEO performance incentives is the CEO’s wealth. As mentioned above, wealth is an important determinant of in-centives when a person’s views about a given dollar gain or loss varies with that person’s wealth. For example, it seems intuitive that most univer-sity professors care more about $100,000 in pro-spective income than does a wealthy hedge fund manager. One way to view this wealth-based in-centive framework is to consider performance-based incentives as a fraction of the individual’s wealth. Suppose Manager A has wealth of $1 million and the firm imposes $0.5 million in eq-uity performance incentives on him by requiring him to hold 50% of his wealth in firm stock. These performance incentives appear large enough to focus the manager on the risks of equity
13In this paper, we emphasize executives’ monetary incentives as a
mechanism to control agency conflicts. We acknowledge, however, that monetary incentives are not the sole mechanism firms may use to motivate executives. We also recognize that the importance of monetary incentives in resolving agency conflicts will depend on the firm’s organizational and institutional environment, as well as the other governance mechanisms being utilized by the firm at any given point in time (for more on these issues, see Filatotchev and Allcock, this issue).
ownership and to influence the manager’s behav-ior toward maximizing shareholder value. But now consider offering that same performance incen-tive, $0.5 million, to Manager B, who has wealth of $100 million (i.e., requiring her to hold only 0.5% of her wealth in firm stock). It seems un-likely that Manager B would be motivated at all by such incentives. However, if Manager B is re-quired to hold $50 million of her wealth in firm stock, her performance incentives would consti-tute the same fraction of wealth as was the case for Manager A (i.e., 50% of wealth), potentially caus-ing this relatively wealthier manager to be simi-larly motivated by her equity ownership. The term for this phenomenon, in which individuals assess dollar risks in proportion to their wealth, is “rel-ative risk aversion.” If corporate executives ex-hibit relative risk aversion, the incentives from a given dollar amount of equity will vary with wealth. Only if executives had constant absolute risk aversion (i.e., an executive with $1 million in wealth views the $0.5 million performance incen-tive exactly the same as an execuincen-tive with $100 million in wealth) would there be no benefit to wealth-based contracting.
Although outsiders to the firm can observe from proxy disclosures how much wealth CEOs have invested in the firm (e.g., Table 1 shows that in 2008, the median CEO held stock and options with a market value of $43.0 million), the CEOs’ total wealth cannot be directly observed. Thus, research that explicitly recognizes the importance of CEO wealth for CEO incentives, such as Hall and Murphy (2002), Cai and Vijh (2005), and Conyon et al. (2009), takes incentives as dis-closed, and makes assumptions about outside wealth and risk aversion (since these parameters are unobserved). This literature typically assumes that the CEO exhibits constant relative risk aver-sion, and that the risk aversion parameter ranges from 2 to 3.14 It also assumes that firm-specific
wealth ranges between 50% and 67% of the CEO’s total wealth. For example, if the CEO owns $40 million in firm equity, this literature assumes that his outside diversified holdings range from $20 million to $40 million.
Interestingly, in Sweden, unlike in the U.S., citizens must provide data on their wealth to tax authorities, and these data are publicly available. Becker (2006) used this Swedish data to study wealth-based contracting for roughly 100 Swedish CEOs. He suggested that the typical Swedish CEO has between 25% and 50% of her total wealth tied to the firm she works for, which is a somewhat lower proportion than is typically as-sumed in the United States. It is difficult to know, however, how well this Swedish data extrapolates to U.S. CEOs. Becker noted (p. 382) that “in the pooled Swedish sample (1993 to 1999), the 25th, 50th, and 75th percentiles of wealth are approxi-mately $140,000, $620,000, and $1,670,000.” Thus, the Swedish CEOs appear to be less wealthy than most American CEOs (the Swedish tax, governance, and social norms are also quite dif-ferent from those in the United States). At the same time, however, Conyon, Core, and Guay (2009) found that U.S. CEOs typically hold sev-eral times more stock and options than a sample of European CEOs (matched on firm size and perfor-mance). In addition, Bitler, Moskowitz, and Viss-ing-Jørgensen (2005) reported survey data on U.S. entrepreneurs for the period 1989 through 2001 (fromThe Survey of Consumer Finances) that show the mean owner of a U.S. private firm has inside equity of $643,000 and net worth of $1,014,000, suggesting a 63% proportion of total wealth in-vested in firm stock.
The discussion above makes clear that there are costs associated with setting CEO incentives too low, such as the costs of unresolved agency con-flicts. There are also, however, costs associated with setting CEO incentives too high. A risk-averse CEO will demand more compensation, or a “risk premium,” as the amount of incentives rela-tive to wealth is increased. The reason for this risk premium is that, being risk averse, the CEO pre-fers to hold his wealth in a diversified portfolio rather than in a concentrated position in a single risky stock. Thus, the CEO must be compensated
14The relative risk aversion parameter increases with risk aversion, and
has a minimum value of zero (risk neutral). The exact value of the parameter is subject to ongoing debate (e.g., Hall & Murphy, 2002, pp. 10 –11). In addition, estimates of risk aversion are typically based on individuals less wealthy than CEOs. It may be that people have decreasing relative risk aversion—in other words, the wealthier Person B may tolerate a 20% loss (after which she has $80 million) as well as the poorer person A tolerates a 10% loss (after which he has $900,000).
for a requirement that forces him to hold his wealth in a less diversified portfolio than he pre-fers, and this risk premium will be greater the more risk averse the CEO. Another cost associ-ated with setting incentives too high is that risk-averse CEOs can take unwanted actions to de-crease firm risk. For example, empirical research shows that high equity incentives can encourage diversifying acquisitions, hedging activities, and reluctance to invest in R&D and other invest-ments (e.g., Amihud & Lev, 1981; May, 1995; Tufano, 1996).
As a final point in this section, it is interesting to consider how firms go about setting require-ments for the amount of stock and options that executives are required to hold. Many firms have explicit requirements that their senior executives hold a given amount of stock or hold a given fraction of granted equity (see Core & Larcker, 2002). For example, in the proxy statement for their 2009 annual meeting of shareholders, U.S. Bancorp states their stock ownership guidelines as follows:
The Compensation Committee established stock owner-ship guidelines for executive officers in 2002. The require-ment for the chief executive officer is ownership of stock valued at five times current annual salary. The stock ownership requirement for other executive officers is own-ership of stock valued at four times current annual salary. All of the executive officers named in the Summary Compensation Table in this proxy statement currently hold sufficient amounts of our common stock to meet or exceed the stock ownership requirements. (p. 20)
There are several interesting points to consider regarding such guidelines: How does the board determine these ownership multiples (i.e., how does the board determine the “right” amount of equity incentives for their executives)? Why are the multiples for all executive officers the same (except for the CEO)? Do these required multiples give any consideration to the outside wealth of the executives? Related to this last question, is the board using salary as a rough proxy for outside wealth (which therefore explains why the owner-ship guideline is a multiple of salary)? Why are holdings of stock options excluded from consider-ation in these ownership guidelines, particularly
given that dollar for dollar, options provide greater incentives than stock?
As another example, JPMorgan Chase & Co. ownership guidelines (proxy statement for 2009 annual meeting of shareholders) are not based on a multiple of salary, but rather on the proportion of the stock-based compensation that executives are required to retain until retirement:
We have always paid a significant percentage of our incentive compensation in deferred stock (50% or more for our most senior management group) and require this group, as described on page 19, to hold 75% of their stock until retirement. The senior management group cannot hedge their holdings of JPMorgan Chase common stock, and after retirement executives typically continue to have substantial holdings of company stock through RSUs that vest over a period of years, shares received from option exercises that must be held for at least five years from the grant date of options awarded in 2005 and later, and options that depend on the share price for their value. (p. 9)
The objective of these ownership guidelines ap-pears to be to require executives to build a port-folio of firm equity for the purpose of providing executives with performance-based incentives. But, if the executives’ portfolio of firm equity is the objective, it would seem much more direct to simply require that executives hold a specified amount of equity or a specified fraction of wealth in firm equity. It is also interesting that the board requires the same proportion of equity compensa-tion to be held by all top executives, rather than making executive-specific adjustments as a func-tion of executive wealth, risk aversion, and other characteristics. One reason for this consistency across executives may be that total equity com-pensation is itself a reasonable proxy for executive wealth (i.e., a given executive’s wealth may be roughly proportional to that executive’s equity pay (e.g., Edmans, Gabaix, & Landier, 2008, p. 15). Alternatively, it may be costly for the board to set separate equity retention or holding requiments for each executive, and so a holding re-quirement that meets some average or middle ground across executives might be the most cost-effective policy.
JPMorgan Chase’s executive compensation policies also include a prohibition against execu-tive hedging of their firm equity holdings. Such a
restriction is not uncommon and serves to ensure the transparency of executives’ performance-based incentives, and to remind executives that it is important that they not take actions to unwind their incentives. The concern here is that al-though executives are legally prohibited from short-selling their own firm stock, they do have available to them certain hedging transactions, such as caps, collars, and other contractual ar-rangements, that can serve to reduce the incen-tives from their stock and option holdings (see, for example, Bettis, Bizjak, & Kalpathy, 2009). The SEC requires that executives publicly disclose these transactions, and it appears that a small minority of executives engage in such arrange-ments.15It is important, however, that boards and shareholders be diligent in monitoring executive behavior in this regard. JPMorgan Chase also notes that executives frequently hold equity be-yond their tenure due to vesting requirements of stock and option grants. The issue of whether executives should be required to hold equity pos-tretirement has recently become topical, and we return to this issue below.
How to Assess Whether CEO Pay and Incentives Are Efficient?
The discussion above suggests that a CEO’s pay can be thought of as the sum of four components: (a) compensation for the CEO’s ability (i.e., the minimum amount necessary to attract the CEO to the job and persuade him to forgo his next most attractive opportunity), (b) a payment that in-creases with the level of effort required of the CEO, (c) a premium for risk stemming from per-formance-based incentive risk, and (d) any excess pay (i.e., any portion that is unexplained by the three other components and that likely stems from unresolved agency conflicts and governance problems). This produces the following equation: Pay"CEO ability#cost of effort
#incentive risk premium#excess pay (1)
Equation 1 makes clear that any assertion of excess pay first requires one to account for the other components of pay. That is, if one wishes to claim that a group of CEOs are overpaid, it must be shown that the pay received by these CEOs cannot be explained by ability, effort, or a risk premium. Toward this end, Conyon, Core, and Guay (2009) used data on equity incentives and various assumptions about CEO risk aversion and outside wealth to estimate the magnitude of the risk premium component of CEO pay. They then subtracted these risk premiums from total pay to estimate CEOs’ risk-adjusted pay, and to address the question of how much less pay U.S. and U.K. CEOs might accept if they were not required to hold a substantial fraction of their wealth in firm equity?
Conyon et al. (2009) calculated that for a CEO with a relative risk aversion of 2 and 50% of his wealth invested in firm stock, a payment of about 5.8% of incentives would serve as compensation for holding this wealth in firm stock instead of in a diversified portfolio. As an illustration of the magnitude of the risk premiums, this estimate implies that a CEO holding $66.0 million in stock-equivalent value incentives (the median CEO incentives in 2008 from Table 1) would require an annual payment of $3.8 million (5.8%$$66 million), or about half of the median
CEO pay in 2008.16 Conyon et al. (2009) found that for a reasonable range of risk aversion and wealth parameters, median risk-adjusted pay for U.S. CEOs is not consistently higher than that for U.K. CEOs. This evidence calls into question those critics who point to lower CEO pay levels outside of the United States as support for claims that U.S. CEO pay is too high. Of course, this
15Data in Bettis et al. (2009) suggest that over the period 1996 to
2006, about 35 CEOs per year engaged in these transactions. Assuming that there are over 5,000 public companies in the U.S., 35 CEOs per year is a frequency of less than 1% per year.
16Table 3 shows that equity incentives increase with tenure, so that
one would expect the risk premium, and therefore pay, to increase with tenure. Table 3 also shows, however, that pay is constant with tenure. A potential reason for this is that implicit incentives coming from the CEO’s future pay are high early in the CEO’s career. That is, younger CEOs may require fewer explicit equity incentives because they have strong implicit incentives to perform at a level that allows them to maintain their CEO income stream for many future years, and/or to have the opportunity to become CEO at a larger, more prestigious firm. Older CEOs have less of these implicit career incentives and so require more explicit equity incen-tives. Thus, total explicit and implicit incentives may be roughly constant over a CEO’s tenure, leading to a relatively constant risk premium and constant pay.
Fn15
analysis also raises the issue of why more perfor-mance-based incentives are imposed on U.S. CEOs than on CEOs in other parts of the world. We return to this issue briefly below when we discuss recent regulatory actions that are aimed at further increasing CEO equity incentives.17
Implications for Recent Proposals on Regulating Pay and Incentives
A
s noted above, recent Treasury Departmentregulation of TARP firms requires most com-pensation to senior executives to be paid in the form of stock. Further, in November 2009, the Special Master for TARP executive compensa-tion, Ken Feinberg, proposed executive-by-execu-tive compensation recommendations for TARP firms requiring exceptional assistance. These rec-ommendations were consistent with the Treasury Department’s TARP rules advocating that most pay be in the form of stock. Upon releasing his recommendations, Feinberg went further to say, “I’m hoping that the methodology we developed to determine compensation for these individuals might be voluntarily adopted elsewhere” (Ahrens & Cho, 2009). Presumably, a key motivation for this regulation is the concern that top executives do not have sufficient incentives to look after shareholders’ interests. Such a motivation, how-ever, is difficult to reconcile with the evidence noted above that U.S. executives already hold more equity incentives than executives in any other country. At the very least, this empirical fact should give regulators and critics pause to reconsider the merits of their concern. At the same time, as we note elsewhere (Core & Guay, 2010), it is possible that regulators recognize that a lack of equity incentives is not a key problem underlying U.S. executive compensation plans and so have allowed for portfolio rebalancing in the policy recommendations. Specifically, as far as
we understand, the regulations involve no restric-tions on executive equity sales. Therefore, an ex-ecutive who received $2.5 million in cash before the regulation, and who receives $0.5 million in cash and $2.0 million in stock after the regulation, can still sell $2.0 million in stock, and receive $2.5 million in cash after. An immediate response to this example might be, “But the $2.0 million stock grant will carry vesting restrictions that pre-vent the executive from immediately selling this equity.” While this is correct, note that most executives hold a substantial amount of vested stock and options. In fact, the typical CEO holds as much or more vested equity than unvested equity (e.g., see Core, Guay, & Thomas, 2005). Therefore, it would be relatively easy for most executives to rebalance their equity portfolios in response to new equity grants, and in fact, evi-dence suggests that executives with large existing equity portfolios do this regularly (Ofek & Yer-mack, 2000). While this may or may not be the regulators’ objective, this might be an effective way to regulate a “problem” that is not in fact a problem—the regulators show their constituents that they are engaged in monitoring, but the reg-ulation has few perverse effects.
Some academic proposals in this area, however, are potentially less benign. Several prominent ac-ademics (e.g., Bebchuk & Fried, 2009; Bhagat & Romano, 2009) have called for greater emphasis on equity-based pay, as well as restrictions on executives’ ability to sell equity, both during their tenure and after retirement. These restrictions ap-pear to be motivated by both a concern that executives have too few equity incentives and a suspicion that there is a “horizon” problem be-tween CEOs and shareholders. The horizon prob-lem stems from a concern that CEOs may have perverse incentives to take actions that tempo-rarily “pump up” the stock price, and then to sell off their equity and make a profit before the price goes back down (and then avoid getting caught, going to jail, etc.).
The solution, according to these advocates, is to restrict CEOs from selling most or all of their equity for long periods of time, including after retirement. For example, Bhagat and Romano (2009, p. 13) argued that restricting executives
17We sometimes hear the argument that CEOs do not “deserve” a risk
premium for holding firm equity because in many cases this equity was “given” to the CEO by the firm. Although CEOs do receive stock and options as a component of pay, it is incorrect to view this equity pay as “free,” so long as total pay is not excessive. Rather, equity pay is more appropriately viewed as a form of pay that helps or facilitates the CEO in increasing his equity portfolio holdings to a level that is mutually agreed upon by the CEO and board of directors (e.g., see Core & Guay, 1999). Fn17
from selling equity postretirement will “diminish incentives to make public statements, manage earnings, or accept undue levels of risk, for the sake of short-term price appreciation.” Before con-sidering the solution, it is worth examining the evidence that there is actually a problem. Several studies have examined the hypothesis that equity incentives cause earnings manipulation (see Arm-strong, Jagolinzer, & Larcker, 2009, for a brief survey). Earlier studies have tended to support this hypothesis, but later, more careful, studies have tended to refute it (e.g., Armstrong et al., 2009; Core (in press); Hribar & Nichols, 2007). Further, because equity incentives are a choice or endog-enous variable, tests that use incentives as an independent variable are easily confounded. For example, Hribar and Nichols (2007) showed that Bergstresser and Phillipon’s (2006) result that eq-uity incentives are associated with earnings man-agement was induced by a correlated omitted vari-able. Proponents Bhagat and Romano (2009, p. 3) themselves noted: “In particular, the best avail-able evidence suggests that the more questioned forms of incentive compensation did not affect [emphasis added] financial institutions’ perfor-mance during the financial crisis, and therefore it is improbable that they were key contributing factors to the global credit crisis.” Thus, while no doubt there have been occasions when CEOs have manipulated earnings to profit from stock sales (and in fact there are certainly some high-profile examples of this behavior), there does not appear to be evidence that the practice is wide-spread.
Setting aside the questionable benefits of re-quiring executives to hold more equity and to hold this equity postretirement, we turn now to the potential costs of such requirements. First, as noted above, if executives already hold sufficient equity incentives (a conjecture that is not easily refuted), requiring further equity incentives is ex-cessive, and will either require firms to pay unnec-essarily high risk premiums or induce executives to shy away from taking the risks necessary to effec-tively manage the firm. And, if the executive knows that she will be required to hold an undi-versified position in firm equity postretirement, she will require the firm to compensate her for this
restriction (particularly since she will have little, if any, control over firm value postretirement).18 Consider as well the impact of a significant pos-tretirement equity holdings requirement on a younger executive. For equity holdings postretire-ment to influence the executive’s decisions prere-tirement, the executive has to commit to holding equity even if she voluntarily left the firm (oth-erwise the executive will quit rather than retiring in order to escape the incentive burden). This commitment is more or less equivalent to a non-compete agreement. In other words, because the executive has committed to holding substantial equity in her old firm, she cannot take an optimal incentive position in her new firm, likely reducing her employment opportunities until the postre-tirement holdings requirement lapses. And if this long-term noncompete requirement is in fact de-sirable, the firm will have to pay the executive substantial sums for forgoing other career oppor-tunities (and severance pay for early termination would have to be very large).
As a final point, we note that there appears to be little, if any, explicit consideration of executive wealth (or monitoring difficulty, risk aversion, etc.) in proposals related to executive pay and incentives. Given the strong economic underpin-nings of the wealth-based contracting framework we describe, we suggest that regulators, boards, shareholders, and compensation critics give greater consideration to executive wealth in con-tract design. Along these lines, it seems prudent to also consider the merits of improved disclosure of total performance-based incentives, as well as the extent to which the compensation plan considers executive wealth in setting incentives. The Secu-rities and Exchange Commission (SEC) requires that senior executives disclose own-firm stock holdings, option exercises, the direct purchase and
18Executives already hold some equity postretirement due to vesting
restrictions (see Dahiya & Yermack, 2007). For example, JPMorgan Chase & Co., in their 2008 proxy statement, stated: “Executives have a continu-ing interest past retirement through our award vestcontinu-ing schedule. RSU awards generally vest 50% after two years and 50% after three years. Stock appreciation rights awarded periodically become exercisable 20% per year over five years. Upon retirement or termination of employment without cause, the RSUs continue to vest according to the same schedules. These vesting provisions render a significant portion of the equity compensation at risk for up to three years after retirement.”
sale of stock, and any indirect “quasi-sale” of stock through synthetic instruments such as caps or collars (Bettis, Bizjak, & Lemmon, 2001). How-ever, these amounts can be made more transpar-ent. One way to do this would be to require executives to disclose simple, easy-to-understand measures of their incentives (e.g., the total change in executive wealth for a given change in stock price or stock return volatility). Such incentive disclosures should also adjust for any reduction in incentives due to quasi-hedging transactions (cur-rently there is no requirement that proxy state-ment disclosures of executives’ equity holdings be adjusted for hedging transactions).
Further, there is no formal disclosure of the extent to which the board has given consideration to executives’ outside wealth when setting incen-tives.19 Although public disclosure of executives’ wealth may not be feasible due to privacy issues, it seems important that boards (or at the least com-pensation committees) acquire some general in-formation about their executives’ wealth. And, giving due consideration to privacy concerns, the board could provide disclosure in their compensa-tion discussion and analysis about the process by which the board used this wealth information in structuring executive pay and incentives. Focusing reform efforts on ensuring that compensation con-tracts and incentive structures consider executive wealth seems more fruitful than a one-dimen-sional doctrine built on the naive perspective that more executive incentives and less executive pay are “better” than fewer incentives and more pay. This more incentives/less pay dogma is not only conceptually flawed (due to its failure to consider a firm’s economic circumstances and CEO-spe-cific characteristics), but is also likely to have perverse economic effects due to suboptimal struc-turing of executive incentives and pay.
Conclusion
I
n this paper, we describe a wealth-based con-tracting framework useful in structuring execu-tive compensation and incenexecu-tives. Our discus-sion emphasizes the importance of considering an executive’s outside wealth in setting optimal in-centives, as well as the implications of wealth and incentives for setting optimal pay levels. These relationships are intuitive and can be easily illus-trated: For example, it is not difficult to see that, to provide the same incentives, a CEO with out-side wealth of $100 million will need to hold more firm stock than a CEO with outside wealth of $5 million.Beyond simply showing why outside wealth is important in setting executive pay and incentives, our discussion also makes clear that an executive’s incentives can be set too low ortoo high, and that the appropriate level of pay depends on the level of incentives. If the CEO’s contract imposes too great a level of incentives and offers too little pay, the CEO will either quit and work elsewhere or will act conservatively in order to reduce firm risk. Conversely, if the contract offers too much pay and imposes too few incentives, pay could be cut without adversely affecting retention of the CEO, and/or the CEO interests will not be sufficiently aligned with the interests of shareholders.
These points also make clear the fallacy of the view that strong “pay-for-performance” (i.e., in-centives) is a necessary condition for the “fairness” of executive compensation. For example, the busi-ness press, politicians, and critics of executive pay frequently cite a lack of pay-for-performance as evidence that executive pay is flawed. Setting aside the issue of whether these critics are consid-ering executives’ stock and option holdings when rendering their complaint (which they often ap-pear to be ignoring), it is important to remember that a compensation plan with substantial pay-for-performance need not be “fair,” just as a “fair” compensation plan need not have significant pay-for-performance. Rather, for any given amount of pay-for-performance incentives, there is a reason-able level of expected pay, and for any given amount of pay, there is a reasonable level of pay-for-performance (e.g., two “fair” compensation
19Although boards are likely to have better information than investors
about executives’ outside wealth, investors may be able to form an expec-tation of wealth. For example, investors are likely to have knowledge about previous employment history that provides information about outside wealth (e.g., previous cash compensation, stockholdings of previous em-ployers, number of years employed, etc.). Also, if boards set wealth-based targets, investors may use these targets to infer executive wealth. Fn19
structures might be as follows: expected pay of $5 million per year and high pay-for-performance or expected pay of $3 million per year and low pay-for-performance).
References
Amihud, Y., & Lev, B. (1981). Risk reduction as a mana-gerial motive for conglomerate mergers. Bell Journal of Economics, 12,605– 617.
Armstrong, C., Jagolinzer, A., & Larcker, D. (in press). Chief executive officer equity incentives and accounting irregularities.Journal of Accounting Research.
Ahrens, F. & Cho, D. (2009, October 23). Government widens control over paychecks.The Washington Post.
Baker, G., & Hall, B. (2004). CEO incentives and firm size.
Journal of Labor Economics, 22,767"798.
Bebchuk, L., & Fried, J. (2009). Paying for long-term
perfor-mance(Working Paper). Cambridge, MA: Harvard Law
School.
Becker, B. (2006). Wealth and executive compensation.
The Journal of Finance, 61,379"397.
Bergstresser, D., & Philippon, T. (2006). CEO incentives and earnings management. Journal of Financial Econom-ics, 80, 511"529.
Bettis, J., Bizjak, J., & Kalpathy, S. (2009). Insider’s use of hedging instruments: An empirical examination (Working Paper). Portland, OR: Portland State University. Bettis, J., Bizjak, J., & Lemmon, M. (2001). Managerial
ownership, incentive contracting, and the use of zero-cost collars and equity swaps by corporate insiders.
Journal of Financial and Quantitative Analysis, 36(3), 345"370.
Bhagat, S., & Romano, R. (2009, October). Reforming ex-ecutive compensation: Simplicity, transparency and commit-ting to the long-term (Working Paper). New Haven, CT: Yale University.
Bitler, M., Moskowitz, T., & Vissing-Jørgensen, A. (2005). Testing agency theory with entrepreneur effort and wealth.Journal of Finance, 60(2), 539"576.
Cai, J., & Vijh, A. M. (2005). Executive stock and option valuation in a two state-variable framework. Journal of Derivatives, 12, 9"27.
Conyon, M., Core, J., & Guay, W. (2009). Are US CEOs paid more than UK CEOs? Inferences from risk-adjusted pay
(Working Paper). Philadelphia: The Wharton School, University of Pennsylvania.
Core, J. (in press). Discussion of chief executive officer equity incentives and accounting irregularities.Journal of Accounting Research.
Core, J., & Guay, W. (1999). The use of equity grants to manage optimal equity incentive levels. Journal of Ac-counting & Economics, 28,151"184.
Core, J., & Guay, W. (2002). Estimating the value of employee stock option portfolios and their sensitivities to price and volatility.Journal of Accounting Research, 40,
613"630.
Core, J., & Guay, W. (2010). Is there a case for regulating executive pay in the financial services industry? (Working Paper). Philadelphia: The Wharton School, University of Pennsylvania.
Core, J., Guay, W., & Thomas, R. (2005). Is CEO compen-sation inefficient pay without performance?University of Michigan Law Review, 103,1141"1185.
Core, J., & Larcker, D. (2002) Performance consequences of mandatory increases in CEO stock ownership.Journal of Financial Economics, 64(3), 317"340.
Dahiya, S., & Yermack, D. (2007).You can’t take it with you: Sunset provisions for equity compensation when managers retire, resign, or die (Working Paper). New York: New York University, Stern School of Business.
Edmans, A., Gabaix, X., & Landier, A. (2008). A multipli-cative model of optimal CEO incentives in market equi-librium.Review of Financial Studies, 22,4881– 4917. Fama, E., & Jensen, M. (1983). Separation of ownership and
control.Journal of Financial Economics, 26,301"314.
Filatotchev, I., & Allcock, D. (2010). Corporate gover-nance and executive remuneration: A contingency framework. Academy of Management Perspectives (this issue).
Gabaix, X., & Landier, A. (2008). Why has CEO pay increased so much?Quarterly Journal of Economics, 123,
49 –100.
Hall, B., & Murphy, K. (2002). Stock options for undiver-sified executives. Journal of Accounting and Economics, 33(1), 3– 42.
Hoskisson, R., Castleton, M., & Withers, M. (2009). Complementarity in monitoring and bonding: More in-tense monitoring leads to higher executive compensa-tion.Academy of Management Perspectives, 23,57–74. Hribar, P., & Nichols, C. (2007). The use of unsigned
earnings quality measures in tests of earnings manage-ment.Journal of Accounting Research, 45(5), 1017–1053. Jensen, M., & Murphy, K. (1990). Performance pay and top-management incentives.Journal of Political Economy, 98,225–264.
JPMorgan Chase & Company (2009, March 31). Proxy statement, 2009 annual meeting of shareholders, Sched-ule 14A, 1– 42.
Kaplan, S. (2008). Are U.S. CEOs overpaid? Academy of Management Perspectives22, 5–20.
May, D. (1995). Do managerial motives influence firm risk reduction strategies?Journal of Finance, 50, 1291–1308. Ofek, E., & Yermack, D. (2000). Taking stock: Equity-based compensation and the evolution of managerial owner-ship.Journal of Finance, 55,1367–1384.
Prendergast, C. (2000). What trade-off of risk and incen-tives?American Economic Review, 90, 421– 425. Tufano, P. (1996). Who manages risk? An empirical
exam-ination of risk management practices in the gold mining industry.Journal of Finance, 51,1097–1137.
U.S. Bancorp (2009, March 20). Proxy statement, 2009 annual meeting of shareholders, Schedule 14A, 1–54.