Special Report
Natural Gas Developments
T. KOHLER and M. BRUENTRUP, Linde Engineering, Pullach, Germany; and R. D. KEY and T. EDVARDSSON, Linde Process Plants Inc., Tulsa, Oklahoma
Choose the best refrigeration technology
for small-scale LNG production
Low natural gas prices are allowing multiple secondary players in the US market to consider investments in small-scale LNG plants. A frequent question is which refrigeration technology is the best for liquefied natural gas (LNG) produc-tion. At first glance, there are numerous process alternatives on the market. However, when taking a closer look, the choice simplifies to either single mixed-refrigerant (SMR) or nitro-gen (N2) expander technology. These technologies dominate the small-scale plant capacity range between 50,000 gallons per day (gpd) and 500,000 gpd of LNG.
Here, a broad range of aspects and guidelines for which technology is best suited for what type of application is cov-ered. Other technologies may be relevant for LNG plants with capacities below and beyond the range indicated, although the observations and conclusions presented here apply only to the aforementioned capacity range.
Refrigeration process design. Two processes1 have been
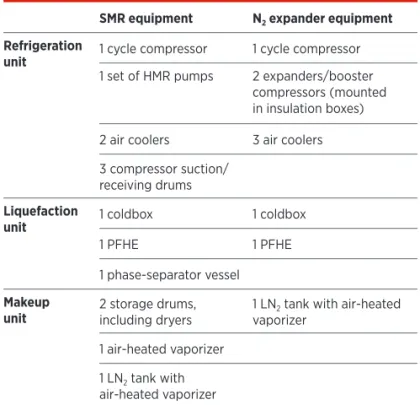
se-lected as representative for the two competing liquefaction tech-nologies. Both processes are based on brazed aluminum plate-fin heat exchangers (PFHEs) as the main heat exchangers in the liquefaction unit. The processes are a single-cycle, multistage mixed-refrigerant process and a dual N2 expander process. TABLE 1
compares the primary components of these processes, while FIGS. 1 and 2 present process flows for the two technologies.
The high specific power requirements limit single N2 ex-pander processes as a widely acceptable option. Other dual-expander processes have different detail process topology, use hydrocarbon components mixed with N2 as refrigerant, or are combinations of MR and N2 expander technology. The classic dual N2 expander and the SMR technology used in this model are believed to represent the cornerstones of the modern LNG technology range.
Refrigeration process performance. The selection of plant
design parameters, such as ambient design temperature, feed gas pressure and composition, storage tank pressure, flash gas rate, etc., have a significant (± 20%) impact on the specific pow-er requirement of an LNG plant. To make a meaningful ppow-er- per-formance comparison, it is fundamental to use an equal set of design parameters—or, since different processes are optimum at different conditions, an equal range can be used. For this rea-son, a range of design parameters has been studied, rather than a single, arbitrarily chosen point. Also, indication of absolute performance numbers has been avoided so as not to present misleading data. Instead, relative differences are provided.
NG LNG Refrigerant compressor Warm expander/booster Cold expander/booster Main heat exchanger
FIG. 1. Process flow diagram of the dual N2 expander process.
NG LMR LNG Main heat exchanger Refrigerant compressor HMR HMR pump
The selection of machinery efficiencies has a significant impact on this process comparison. Some literature sets these efficiency values at 100%, assuming an equal basis of com-parison. However, this will lead to a false conclusion: Theo-retically, the N2 expander cycle would have up to 15% less power than the SMR. To provide a comparison that matches reality, typical machinery efficiencies have been selected. N2 compressors typically show better efficiencies (82.5%) than MR compressors (80%), while both processes make use of an integrally geared turbocompressor as a cycle compressor, providing optimum compression efficiency. For the expander turbines, 85% efficiency was selected.
Sensitivity analysis. Design ambient temperature impacts the process performance, as shown in FIGS. 3 and 4. While FIG. 3 illustrates that power consumption of any refrigeration pro-cess increases with rising ambient temperature, FIG. 4 shows how the N2 expander performs relative to the SMR.2
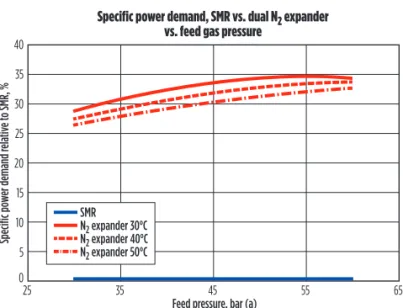
On average, the N2 expander cycle requires approximately 30% more power than the SMR cycle. This power consump-tion difference is reduced as the ambient temperature increas-es. FIGS. 5 and 6 show how design feed gas pressure impacts the process performance. FIG. 5 demonstrates that power con-sumption of any refrigeration process is lower with higher feed gas pressure. FIG. 6 shows how the N2 expander cycle performs relative to the SMR.2
On average, the N2 expander cycle requires around 30% more power than the SMR cycle. This power consumption difference is reduced as the feed gas pressure increases. It can be concluded that the power disadvantage of the N2 expander cycle is lowest for a plant with low design feed gas pressure and high design ambient temperature; a nearly 25% power consumption difference can be reached in this favorable case, whereas up to a 35% power consumption difference may re-sult for the other extreme.
Since refrigeration process efficiency is improved by ob-taining a close match between the feed gas and refrigerant (Q /T) cooling curves, composition of the feed gas also has an impact. Analysis of this parameter has been performed and appears to have only a moderate effect. The N2 expander cycle tends to perform slightly better on lean feed gases. The im-provement may be up to 5% with reference to the aforemen-tioned difference.
The background of this observation is that N2 works as a highly efficient refrigerant in cryogenic applications, but shows poor efficiency at higher temperature levels of the liq-uefaction process.
Precooling. Since N2 shows poor efficiency at high liquefac-tion temperatures, many N2 expander liquefiers include a pre-cooling unit that provides refrigeration duty at higher tempera-ture levels. Fundamentally, three options for precooling exist:
• Feed gas • Refrigerant
• Feed gas and refrigerant.
A variety of precooling technologies presents a wide range of options. Ammonia and propane chilling are still considered the most common options in the simplest case, within a single-cycle, single-stage refrigerant process. Adding more stages will improve efficiency, but it will also increase cost and complexity.
TABLE 1. Main equipment components for the SMR and N2 expander processes
SMR equipment N2 expander equipment
Refrigeration
unit 1 cycle compressor 1 cycle compressor
1 set of HMR pumps 2 expanders/booster compressors (mounted in insulation boxes) 2 air coolers 3 air coolers 3 compressor suction/
receiving drums
Liquefaction
unit 1 coldbox 1 coldbox
1 PFHE 1 PFHE
1 phase-separator vessel
Makeup
unit 2 storage drums, including dryers 1 LNvaporizer2 tank with air-heated 1 air-heated vaporizer
1 LN2 tank with
air-heated vaporizer
25 30 35 40
Temperature, °C
Liquefaction power vs. ambient temperature @ 40 bar/580 psi liquefaction pressure
Specific po
wer
, kWh/
t
45 50 55
FIG. 3. Power vs. ambient design temperature.
SMR N2 expander 25 0 5 10 15 20 25 30 35 40 30 35 40 Temperature, °C Specific po wer demand r ela tiv e t o SMR, % 45 50 55
Specific power demand SMR vs. dual N2 expander @ 40 bar/580 psi feed gas pressure vs. ambient temperature
Based on exemplary calculations for a simple propane chiller, there appears to be improvement potential for the N2 expander cycle of up to 15% compared to the stated values for the uncooled cycle. Feed gas precooling is technically simple, whereas refrigerant precooling is more complex, but also more rewarding.
In a best-case scenario, the power disadvantage of a pre-cooled N2 expander cycle may be as low as 10% to 15% above a (non-precooled) SMR cycle.
Additional observations. Aside from power consump-tion, two other parameters with impact on investment cost are significantly different for the two refrigeration processes. Whereas the SMR cycle uses a two-phase refrigerant, the N2 refrigerant in the N2 expander cycle is always in the gas phase. It is not surprising that volumetric flows (and, therefore, pipe diameters) are larger in the N2 expander cycle than in the SMR cycle at any given duty. Also, refrigerant pressures (and, therefore, pipe schedules) typically need to be significantly higher to get to reasonable pipe diameter and process efficien-cies. In reference to the given example:
• The suction line diameter of the refrigerant compressor is 20 inches (in.) for the SMR cycle and 24 in. for the N2 expander cycle
• The high-pressure refrigerant operates at approximately 40 bar (600 psi) for the SMR cycle and 70 bar (1,000 psi) for the N2 expander cycle, resulting in Class 300 piping for the SMR cycle and Class 600 piping for the N2 expander cycle.
Technical and operational pros and cons. A number of
additional aspects should be considered when comparing both technologies, as a thorough response requires more technical background information.
Refrigerant use and makeup system. Both the SMR and N2 expander refrigeration cycles operate in closed loops; i.e., they do not “consume” refrigerant during operation. Typically, the compressors and seal systems used in these refrigeration cycles are not completely leak-tight, and, therefore, leakage must be replaced by “makeup.” A makeup system is required in every case. For the N2 expander cycle, this system may consist of a liquid nitrogen (LN2) tank with an evaporator as the sim-plest solution. Additionally, for the SMR cycle, makeup stor-age of the hydrocarbon components C2 to C5 is also required. Note: C1 makeup is sourced from the feed gas.
Refrigerant makeup rates are typically much higher for N2 expander plants. This higher makeup rate is due to design dif-ferences between the SMR cycle and the N2 expander cycle compressor seals:
• N2 compressors and expanders/boosters are tradition-ally a product of the air separation industry, where leakage losses are considered an efficiency loss. Therefore, inex-pensive labyrinth seals are a standard solution. Labyrinth seals offer leakage rates of around 3% to 6% of the flow. Alternatively, carbon ring seals offer a reduced leakage rate (around 0.2% of flow) at a slightly higher cost and are, therefore, typically used for N2 refrigerant compressors. • SMR compressors are products of the oil and gas
process-ing industry, where hydrocarbon leakage is considered a hazard and must be minimized. Dry gas seals (DGSs) are the standard design, offering minimal leakage rates (only 1% to 10% of the leakage rate of wet gas seals). They are mostly independent from the compressor throughput. However, dry gas seals feature significantly higher com-plexity and come at a much higher cost (approximately $250 thousand USD), which is why DGSs are not com-monly used for N2 compressors.
Note: Hermetically sealed compressors, exhibiting zero re-frigerant loss, have also been reviewed to complete the picture. In the analyzed capacity range and at the assumed cost of make-up components, they do not seem to be an economical escape route, either for the mixed refrigerant or the N2 compressor. Al-ternately, hermetically sealed expanders/boosters appear more attractive, despite only contributing a minor part of the total leakage rate in an N2 expander cycle.
Although refrigerant leakages from the cycle are considered unavoidable, it does not automatically mean that those losses must be fully matched by external makeup imports. It is tech-nically feasible to recover major parts of refrigerant losses. The question is whether or not this alternative is the most economical.
Whereas large-scale LNG plants usually take the C2 to C5 makeup components from the fractionation process, in most cases, this is not an economical option for small-scale LNG plants, although it is technically feasible and has been
success-25 30 35 40
Feed pressure, bar (a)
Specific po
wer
, kWh/
t
45 50 55 60 65
Liquefaction power vs. feed gas pressure @ 40°C/104°F ambient temperature
FIG. 5. Liquefaction power vs. feed gas pressure.
SMR N2 expander 30°C N2 expander 40°C N2 expander 50°C 25 35 45 55 65 0 5 10 15 20 25 30 35 40
Feed pressure, bar (a)
Specific po wer demand r ela tiv e t o SMR, %
Specific power demand, SMR vs. dual N2 expander vs. feed gas pressure
fully demonstrated. Therefore, makeup import from external sources is usually considered, and refrigerant components are limited to C2 and C4. This comes at the expense of a small ef-ficiency loss, which is considered in the efef-ficiency comparison. This small efficiency loss helps to minimize both the invest-ment cost for the makeup system and logistical/procureinvest-ment efforts for the plant operator.
While an inexpensive/high-leak seal design is technically an option for N2 expander cycle machinery, it is an economic question of which setup offers the best lifecycle cost, as will be discussed later.
Makeup system operation. In the N2 expander cycle, the operator must monitor the cycle pressure and add N2 when the pressure drops below certain limits. The machinery seal type and resulting leakage rate of the system determine the fre-quency for adding makeup. This frefre-quency may range from a continuous operation to a weekly occurrence.
Operating efforts may be doubled in case a C3 precooling cycle is added to the N2 expander cycle (depending on C3 com-pressor seal design). For the SMR cycle, leakage and resulting makeup rates are lowered by an order of magnitude. Nonethe-less, the operator must monitor the refrigerant composition in addition to the cycle inventory. An online analyzer (i.e., a gas chromatograph) is provided to this end, and biweekly check-ing of inventory and composition is recommended. (Contrary to statements found in some literature, the authors’ experience
has shown that SMR cycle efficiency is quite forgiving to off-spec MR composition and is sufficient to achieve close to the recommended component mix.) To add makeup components, automated functions can be activated by the operator on the control panel without any need for further field operator inter-vention. Operator failure to maintain refrigerant composition may result in slowly decreasing process efficiency.
Operation at off-design conditions. Liquefaction capacity can be adjusted for both refrigeration technologies. In principal, capacity is influenced by the refrigerant system inventory; i.e., reduced refrigerant system inventory will result in lower pres-sures, lower refrigerant mass flows and lower LNG production. For the N2 expander cycle, such inventory adjustment is a widely used method to achieve efficient partial-load operation. The operator must only release or add inventory to decrease or increase the plant load. By doing so, the refrigerant compres-sor antisurge valves can remain closed over a wide load range. In this way, process efficiencies near design can be maintained. To avoid losing released refrigerant, a dedicated buffer drum can be added for temporary storage. This can be quite a large and expensive vessel, depending on the plant capacity, but op-eration of such a system is relatively simple. The typical N2 ex-pander process can reach a partial load as low as 30%.
The SMR technology features the maintenance of a two-phase refrigerant of a certain composition. Releasing inven-tory is more complex and, therefore, is only done occasion-ally. Dumping of released refrigerant usually is not an option, so temporary storage is required. Without such optional extra equipment, partial-load operation is realized by reducing the compressor throughput (e.g., via inlet guide vanes) and, below a certain load, opening the recycle valves to protect the com-pressor from surge. Partial-load process efficiency will drop drastically when operating in recycle mode. To maintain correct two-phase flow patterns in the PFHE, partial-load operation is limited to approximately 50% in this setup.
In the frequent case where extended partial-load operation is expected—mostly during the initial operating period of an LNG plant—no extra equipment is needed. In that case, opera-tions require the filling of the SMR cycle inventory up to the level corresponding to the desired plant load. This step-by-step procedure allows for highly efficient partial-load operation (as low as 30%) at no additional cost.
Additionally, SMR technology gives the option to vary the refrigerant design composition to improve process efficiency at off-design operating conditions (typically, ambient tempera-tures). This can be realized to a limited extent by modifying the ratio between heavy mixed-refrigerant (HMR) and light mixed-refrigerant (LMR) flow; otherwise, manual adjustment of the composition is required.
To avoid loss of refrigerant, such an adjustment should be made in the normal frequency of adding makeup, unless a refrigerant buffer is provided. Therefore, this method is only suitable for longer-term (typically, seasonal) adjustments, rath-er than daily adjustments, although it may still result in lowrath-er annual power consumption.
Startup time. Startup from a warm condition to a full load must be performed slowly with the SMR option. This is necessary to keep thermal stress in the PFHE within permis-sible limits, because liquid refrigerant has a far higher
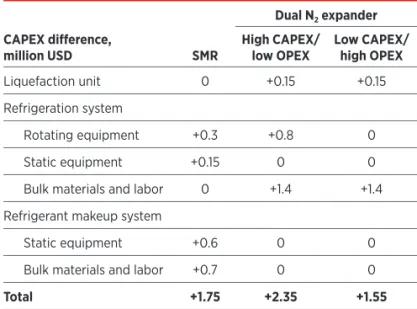
heat-TABLE 2. Differences in capital cost for SMR vs. N2 expanders CAPEX difference,
million USD SMR
Dual N2 expander
High CAPEX/
low OPEX Low CAPEX/ high OPEX
Liquefaction unit 0 +0.15 +0.15
Refrigeration system
Rotating equipment +0.3 +0.8 0
Static equipment +0.15 0 0
Bulk materials and labor 0 +1.4 +1.4 Refrigerant makeup system
Static equipment +0.6 0 0
Bulk materials and labor +0.7 0 0
Total +1.75 +2.35 +1.55
TABLE 3. Differences in operating cost for SMR vs. N2 expander OPEX difference,
million USD per year SMR
Dual N2 expander
High CAPEX/
low OPEX Low CAPEX/ high OPEX
Electric power (0.06 USD/kWh)
0 +0.7 +0.7
Refrigerant makeup/seal gas MR hydrocarbon components (0.4 USD/lb)
+0.15 0 0
Nitrogen (0.1 USD/lb) +0.07 0 +0.75
transfer coefficient than does gas. With liquid refrigerants, the PFHE core temperature approaches refrigerant temperature faster. Typically, the startup of an N2 expander process can be achieved in about half the time required for the
startup of an SMR process.
For a cold plant restart (e.g., after a trip where the PFHE remains cold), there is no difference in start-up time between the two refrigeration technologies. Plant maintainability. Compressors are the main focus when assessing plant maintainability. There are significant differences in rotating equip-ment quantities and design between refrigeration technologies. For the SMR cycle, there is only one compressor and, therefore, only one set of capital spare parts to be procured.
The N2 expander cycle comprises two additional expander/booster sets. Therefore, three machines require regular maintenance, and three sets of capital spare parts must be procured. The typical seal sys-tems used in this scenario have good operating
re-cords, and spare parts are a much lower matter of expense than for DGSs. Also, the likelihood of unscheduled maintenance issues is greater on three pieces of compression equipment vs. a single piece of compression equipment.
One possibility to achieve at least equal maintainability is to use hermetically sealed expander/booster sets with mag-netic bearings that are more or less maintenance-free, in addi-tion to their advantage of zero refrigerant leakage.
The N2 expander cycle situation is more impacted when a precooling cycle is added to enhance process efficiency, as this configuration adds a fourth compressor.
Environmental and process safety. The handling and stor-age of LNG is key when it comes to safety and permits for LNG plants. There is no difference between the two refrigeration technologies in this regard. The methodology for determining exclusion zones typically results in similar separation distances that are accounted for in a standard plant layout. Risks of ex-plosion and jet fires resulting from high-pressure natural gas piping systems are also comparable, as is the requirement for explosion or fire protection.
The small advantage an N2 expander plant may have is can-celed when C3 precooling or ammonia precooling is added. These considerations drive the novel CO2 precooling system to appear on the agenda for floating LNG (FLNG).
To achieve the same compact layout at an equal level of safe-ty, the SMR plant will only incur additional cost for safety mea-sures when forced into a congested plant layout by the available plot space—e.g., in an FLNG plant.
While some publications suggest that the N2 expander cy-cle is friendlier to the environment than the SMR due to its use of N2 as the refrigerant, this is only a partial truth. The refrig-erant is operated in a closed cycle, with the compressor seals as the only significant point of leakage. The small seal leakage from an SMR cycle compressor will usually be flared, resulting in CO2 emissions, or it may be recycled. In this case, the N2 expander cycle has an environmental benefit, since its seals will release only harmless N2. However, when evaluating energy ef-ficiency with a corresponding CO2 footprint, this advantage is turned on its head, and the SMR cycle has more benefits.
Economics. Differences in investment and operating cost have
been determined for some examples to ensure that evaluation of the different technologies is considered on an equal basis. The
ex-ample provided is deemed representative. It encompasses a typi-cal LNG liquefier (i.e., liquefaction, refrigeration and makeup units) in a US Gulf Coast location with a capacity of 200,000 gpd. For the N2 expander cycle, two options are shown in TABLE 2:
1. Process machinery, either seal-less or fitted with refrig-erant recovery, resulting in higher investment cost but lower utility consumption and operating cost
2. Process machinery fitted with standard seal systems (C-rings on the refrigerant compressor and labyrinths elsewhere), resulting in lower investment cost but higher utility consumption and operating cost.
Capital cost. Capital expenditures (CAPEX) include en-gineering, procurement and construction (EPC) and turnkey delivery of the LNG liquefier. In each cost line item, the lowest option has been set to zero, and the incremental cost of the al-ternatives is indicated. Optional features (e.g., refrigerant buf-fer systems) have not been considered.
Observations on this comparison include:
• SMR compressors are expensive equipment compared to the air separation unit machinery of the N2 expander cycle
• Piping quantities are greater than 100% higher for the N2 expander cycle compared to the SMR cycle, resulting in significantly higher materials and construction cost • Total cost differences between the three alternatives are
small—only about 5% when considering the absolute cost of the exemplary liquefier system, or 1% when con-sidering the absolute cost of the exemplary, complete, greenfield LNG plant.
Operating cost. Operating expenditures (OPEX) assessed in TABLE 3 account only for power and refrigerant makeup con-sumption and are based on 8,000 hours per year. The cost for operating personnel will be identical, whereas cost differences for equipment maintenance are difficult to assess precisely.
Observations on this comparison include:
• The SMR cycle shows the expected benefits with respect to power consumption
• For the N2 expander cycle, the cost of LN2 makeup reaches the same order as the cost of power
Having demonstrated only minor
capital cost differences between the
two refrigeration technologies, it can
be concluded that a decision is best
based on operating cost and operability
issues. For applications with high annual
operating hours near design load, the SMR
technology has a strong advantage with
respect to operating cost.
• When considering a 15-year lifecycle cost, the relative OPEX disadvantage of the N2 expander cycle to the SMR reaches the same order of magnitude as the abso-lute cost of the exemplary liquefier system.
Recommendations. Having demonstrated only minor
capi-tal cost differences between the two refrigeration technologies, it can be concluded that a decision is best based on operating cost and operability issues.
For applications with high annual operating hours near design load, such as baseload or peakshaving LNG plants, the SMR technology has a strong advantage with respect to oper-ating cost. Its disadvantages, including longer startup time and reduced partial-load capability, are less relevant.
For applications with low annual operating hours and wide load-profile requirements, such as boiloff gas reliquefaction units, the N2 expander cycle, with a refrigerant buffer system, offers significant advantages with short startup time, as well as wide partial-load capability and efficiency, while low operating hours compensate for higher specific operating cost.
Additionally, in remote areas where C2 and C4 makeup com-ponent delivery comes at high logistical effort and price, the OPEX gap between the SMR cycle and the N2 expander cycle will be smaller. However, this situation will rarely arise in the US.
The extra investment in an N2 expander cycle low-leakage system typically will have an attractive payback time of less than three years.
NOTES
1 The SMR process used in this study is Linde’s proprietary single-cycle, multistage mixed-refrigerant process LIMUM. The N2 expander process is BHP Billiton’s licensed dual-nitrogen expander process.
2 SMR power consumption is used as a reference point for comparison and is, therefore, set to 100% throughout the temperature/pressure range.
THORSTEN KOHLER graduated from the University of Erlangen-Nuremberg,
Germany in 1997 with a master’s degree in chemical engineering, and he joined Linde Engineering in 1997 as a systems and commissioning engineer for adsorption plants. Mr. Kohler moved to Linde Engineering’s process design group for LNG and natural gas processing plants in 2002. Since 2006, he has been working as lead process engineer on small- to mid-scale LNG projects, including proposal work, contract executions and commissioning.
MATTHIAS BRUENTRUP graduated from Munich Technical University in Germany
in 1996 with a master’s degree in engineering, and joined Linde Engineering in 2000 as a project manager. He has been working on small- to mid-scale LNG projects since 2005 in various positions, including as proposal manager and senior project manager. Based on this experience, Mr. Bruentrup became a product manager for small- to mid-scale LNG plants in 2012.
RON D. KEY graduated from the University of Tulsa in Oklahoma with bachelor’s and master’s degrees in chemical engineering, and joined Linde Engineering in 1988. He holds six process-related patents. Mr. Key is presently serving as the vice president of technology and sales at Linde Process Plants Inc., and he is an experienced business leader in engineering, procurement, fabrication and construction.
TINA EDVARDSSON graduated from Chalmers University of Technology in
Sweden in 1985 with a master’s degree in chemical engineering, and joined Linde Engineering in 2012. She holds four process-related patents. Ms. Edvardsson is presently serving as the director of business development at Linde Process Plants Inc. She has more than 25 years of experience in developing processing and power plant projects in the domestic and international markets. Eprinted and posted with permission to Linde Process Plants, Inc. from Hydrocarbon Processing
January © 2014 Gulf Publishing Company
Linde Process Plants, Inc.
6100 South Yale Avenue, Suite 1200, Tulsa, Oklahoma 74136, USA Phone: +1.918.477.1200, [email protected], www.LPPUSA.com