Mark Twain’s Cat: Industry Investment Experience,
Categorical Thinking and Stock Selection
*
Xing Huang
†Michigan State University - Department of Finance
October 2013
Abstract
This paper studies the impact of prior investment experience in an industry on the subsequent purchase of new stocks in the same industry. Using trading records data for households at a large discount broker from 1991 to 1996, I establish that the experience of positive excess returns in a given industry increases the probability of purchasing similar stocks in that industry relative to other industries. This result is robust to industry momentum, wealth effects, and investor heterogeneity. The effect decays when the experience is further in the past. Furthermore, I find that investor sophistication mitigates this experience effect. These results are consistent with mechanisms where investors put more weight on their own experience than on other available historical information when updating the beliefs about an industrys future return. The results are also consistent with investors learning about their stock-picking ability in an industry from their experienced outcomes.
*The cat, having sat upon a hot stove lid, will not sit upon a hot stove lid again. But he won’t sit upon a cold stove lid, either. –Mark Twain
†Email: huangx@bus.msu.edu. I am grateful for very helpful suggestions and comments of Stefano DellaVigna, David Laibson, Ulrike Malmendier, Gregor Matvos, Terrance Odean, Andrei Shleifer, Adam Szeidl, Nancy Wallace and seminar participants at UC Berkeley (Finance, Financial Economics Lunch) and London Business School Trans-Atlantic Doctoral Conference. I would also like to thank an anonymous discount broker for providing data on individual investors’ trades and Terrance Odean for his help in obtaining and understanding the dataset. All errors are my own.
1
Introduction
How do individuals select stocks? Do they incorporate all available historical information and update their beliefs in a Bayesian fashion? Or do they weigh differently their personal investment experiences and other statistical information? A growing body of evidence shows that past experience affects investors’ choices in many financial decisions, including
house-hold risk taking, mutual fund investment style, and corporate financing decisions1. Past
experience may influence households’ purchase decisions on common stocks as well. Barber
et al.(2010) show that the effect of positive past investment experiences in a particular stock increases the likelihood of repurchasing the stock that was owned previously. But do past investment experiences also influence investors’ propensity to buy other similar stocks? This question is important because it helps shed light on how investors update their beliefs about stock returns.
In this paper, I explore whether investors put more weight on their idiosyncratic per-sonal experience of investment in an industry when they make decisions about purchasing new stocks. Consider, for example, two individual investors, A and B, who form portfo-lios in 1991. Investors A and B both invest in the insurance industry, but they invest in different companies. A picks Pioneer Financial Services Inc. while B picks Conseco Inc. One year later, investor A has a paper loss of 30% whereas investor B’s investment doubles. Given the idiosyncratic realization of returns, after enjoying a huge gain from investing in
insurance industry, will B, when compared to A, be more prone to invest in other stocks
in that industry? The psychology literature suggests that personally experienced outcomes have a greater impact on personal decisions than information acquired merely by reading,
which comes without personal involvement (Weber, Bockenholt, Hilton, and Wallace, 1993;
Hertwig, Barron, Weber, and Erev, 2004). The experience hypothesis predicts that in an industry where investors have prior investment experience, it is more likely for them to buy new stocks after they have experienced good rather than bad returns.
This paper exploits data from detailed trading records for households at a large discount
1Barber, Odean, and Strahilevitz(2010),Chan, Chen, and Lakonishok(2002),Choi, Laibson, Madrian,
and Metrick(2009), Graham and Narasimhan(2004),Kaustia and Knupfer (2008),Malmendier and Nagel
broker from 1991 to 1996 (Barber and Odean, 2000) as a measure of investors’ personal investment experiences, and explores whether the past experiences of these investors affect their subsequent purchase decisions at the industry level. The results indicate that the likelihood of investors purchasing new stocks in an experienced industry increases with their experienced excess return. Furthermore, the effect of experienced outcomes becomes weaker for the purchase decisions on stocks in more different industries. Specifically, experience in one industry influences the purchases in a similar industry by a smaller amount, and has almost no effect on the purchases in a dissimilar industry.
While these results are consistent with the view that past experience influences stock selection, there are four alternative mechanisms that may also drive the correlations between the past experiences and the future purchases in the same industry. First, momentum traders (Hong and Stein, 1999; DeLong, Shleifer, Summers, and Waldmann, 1990; Barberis and Shleifer, 2003) may be more likely to purchase new stocks in an industry that performed well in the past, regardless of their personal investment experience in that industry. To control for this momentum effect, I include past industry average returns in the regressions
and show that my results are robust. A second alternative story is a wealth effect: a
high experienced return may increase wealth, generating new purchases in all industries. The results mentioned above - that the experience effect spills overs only slightly to other-industry purchases - do not support this story. I also show that my results are robust to controls measuring the change in the investor’s portfolio value. Third, an investor with a high investment ability is more likely to gain high returns and in the meantime may also be more active, which could drive the positive relation between experienced outcomes and future purchases. I measure investment ability by three trading characteristics variables and also test how the correlation varies with different degrees of sophistication. The evidence does not support this story either. A fourth relevant story is portfolio rebalancing. But because households should decrease their holdings in the industry that earns relatively higher returns in the past to rebalance their portfolio, this story actually leads in the direction opposite to the prediction of the experience hypothesis.
After controlling for industry momentum and time-varying investor heterogeneity, the results show that investors with positive market-adjusted returns in one industry have 1.86
pp higher propensity to buy new stocks in the same industry as opposed to those who earn negative market-adjusted returns. This magnitude corresponds to 16.60 percent of the average probability of 11.18 pp for purchasing new stocks in an industry. However, this effect that results from the experience of positive excess returns drops significantly with regard to the purchase of new stocks outside of the industry in which the investor has experience. The magnitude of this effect on the purchase of new stocks in an industry that is the most similar to the experienced industry is only one third of that for the purchase of new stocks in the original industry, whereas the effect on purchasing new stocks in an industry that differ significantly from the experienced industry is negligible.
I also test for the long-term effect of lagged experience outcomes. Because the sample only extends from 1991 to 1996, the longest horizon is chosen to be half of that sample period, i.e., three years. The results indicate that more recent experience has a stronger influence on purchase of new stocks. The effect of experience outcomes drops dramatically if
the experience happens more than one year before the month of purchase. Gallagher (2012)
finds a similar effect in the context of flood insurance; after a flood, the take-up rate steadily decreases in the flooded communities.
If the experience hypothesis is driving the relation between experienced outcomes and future purchases, the magnitude and significance of the results should vary with investor sophistication and portfolio diversification. As investors become more sophisticated, their past experiences may cancel each other, with the result that more recent experiences have less influence. I divide the households in the sample into four subgroups according to their self-reported investment sophistication as provided in the dataset and test the effects of experienced outcomes separately for each subgroup. The results indicate that the effect is most pronounced for the group with no experience or knowledge in investing, but insignificant for the group with extensive investment experiences, which provides further evidence in support of the experience hypothesis.
Furthermore, investors with more diversified portfolios may care less about the individual performance of each component; consequently, the experienced outcome on the industry level would have less effect. I also explore the variation in portfolio diversification by adding an interaction term between the experience variables and measures for portfolio diversification
in the regression. As predicted above, the results indicate that influence of past experiences declines with the diversification of the household portfolio.
The evidence that past investment experiences have an impact on future purchases at the industry level suggests that investors may apply categorical thinking in their stock invest-ments. To gain additional insight into the operation of categorical thinking in conjunction with the experience effect, I investigate how the latter experience effect varies with the re-finement of categories. I create a proxy to measure the ability of the experienced stocks to represent other stocks in the same industry. The results indicate that the experience effect is stronger when the experienced stocks are more representative. I also test within the same industry to determine whether the effect of experience in a given subindustry would spill over to another subindustry. The results do not suggest that investors have finer categorical thinking than Fama-French 10-industry classification.
This paper is related to several strands of literature. First, it contributes to the growing literature on investor behavior; specifically, I address how investors choose which stocks to purchase. Some papers focus on investors’ cross sectional preferences of stocks,2 while others discuss investors’ stock purchase in a time series that connects buying decisions with past
in-vestment experience.3 This paper exploits the latter approach and emphasizes the affects of
past experience on future purchase of new stocks at different levels of categorization.
Camp-bell, Ramadorai, and Ranish (2013) also study the influences of investors past experiences on other behaviors, such as trading frequency, disposition bias and diversification. They find that turnover, disposition bias and underdiversification diminish when investors experience poor returns resulting from them.
The literature also indicates that experience affects a number of other financial decisions,
including IPO subscriptions (Kaustia and Knupfer, 2008), 401(k) accounts portfolios (Choi
2For example,Barber and Odean (2007) study the attention-grabbing stocks and find that individual
investors are net buyers of attention-grabbing stocks. French and Poterba(1991) and a lot of other papers document the home bias puzzle that individuals and institutions in most countries hold modest amounts of foreign equity even though observed returns on national equity portfolios suggest substantial benefits from international diversification.
3For example, recent researches find that investors tend to buy stocks with strong recent performance
(Odean,1999;Barber, Odean, and Zhu,2009;Jackson,2003). Barber et al.(2010) establish the trading pat-terns in more details about how investors’ repurchase of stocks previously sold is affected by their investment experience in those stocks.
et al.,2009), stock market participation (Malmendier and Nagel,2011), the investment style
of fund managers (Chan et al., 2002), corporate external financing (Malmendier and Tate,
2005;Malmendier et al.,2011), etc. Even though the tests employed in this study are based on the idiosyncratic personal experiences of investors, an examination of the variation in
experiences across cohorts (as in Malmendier and Nagel(2011)) may lead to similar results.
Specifically, assume investors begin investing in the stock market in their mid twenties. For households whose members are between the ages of 30 and 40, I compute experiences as the average of industry returns during the preceding 10 years. Likewise, for the households whose members between the ages of 50 and 60, experiences are measured by the average of
industry returns during the preceding 30 years. Figure 1plots the difference in the fraction
of households investing in an industry between above age cohorts against the difference of the experience in the same two groups. The figure suggests that more investors hold the stocks of an industry when their experience in that industry is better, which is consistent with the experience hypothesis.
This paper also contributes to the literature’s examination of investors’ categorical
think-ing or category learnthink-ing behavior. Barberis and Shleifer (2003) assume that investors
cat-egorize risky assets into different styles and trade among styles depending on their relative performance, which derives excessive comovement of assets in the same style, but little
co-movement of assets in different styles and other asset pricing predictions. Peng and Xiong
(2006) provide justification of category-learning behavior when attention is a scarce
cog-nitive resource; they also generates features in return comovement and other predictions. The present paper provides empirical evidence that investors extrapolate their experience of stocks in one industry to their decision about similar stocks in that industry, and these results provide microfoundation for the effect of experience under categorical thinking or learning.
Section2describes the datasets used in the paper as well as the methodology, and presents summary statistics. Section3details the results for the examination of the influence of
expe-rience on the future purchase of new stocks. Section 4explores the underlying mechanisms
through an examination of how this experience effect varies with investor sophistication, portfolio diversification and categorization. Section 5 concludes.
2
Datasets and Methodology
2.1
Data Description
The dataset used in this paper includes the trading records of 78,000 households at a
large discount brokerage house over the period 1991-1996. This dataset is used by Barber
and Odean (2000) and others. Each household has at least one account, but some have many. I combine the trades of accounts within the same household and build observations at the household level. This paper only focus on investors’ direct investments on common stock, so I exclude their investments in mutual funds, American depository receipts(ADRs), warrants, and options. The sample is further refined by removing observations with errors in trading records, short selling trades, etc. The number of households in the final sample is 47,993. More details about the restrictions I impose to select the sample for analysis are listed in the appendix. I use the Center for Research in Security Prices (CRSP) database to obtain information on stock prices for calculating investor experienced return or portfolio related variables.
One feature of this paper is to discuss investors’ stock selection choices among a man-ageable number of categories, more specifically, industries. The Standard Industrial
Classi-fications (SIC) codes are obtained from two resources: CRSP and Compustat.4 For most of
the tests, stocks are classified into 10 industry groupings based on their SIC code
accord-ing to a algorithm devised by Fama and French (1997). The 10 industry groupings include
(1) consumer nondurables, (2) consumer durables, (3) manufacturing, (4) oil, gas, and coal extraction and products, (5) high technology, (6) telephone and television transmission, (7) wholesale, retail, and some services, (8) healthcare, medical equipment, and drugs, (9) utili-ties, and (10) others. I also exploit the Fama-French 48-industry classification in robustness tests and to define subindustries in further analysis.
4The first step is to match the Cusip of the stocks invested by the households with corresponding SIC
code in CRSP. If a corresponding SIC code can not be matched in CRSP, a second round match is proceeded in Compustat.
2.2
Investors’ Investment Experiences and Purchase Decisions
I construct investors’ experienced returns in each industry by their trading records. I select a fixed window to measure experienced returns. For example, the experience window spans from the beginning to the end of each year. Note that the returns in a fixed window could be either realized or not. I do not use realized returns to measure experiences, because I want to avoid introducing any potential endogeneity.
The measures of experienced outcomes build on the market-adjusted experienced returns. For every household ℎ, I denote by 𝑟ℎ𝑗𝑡 the annualized return (either realized or not) of the
stock 𝑗 during the experience window 𝑡. The experienced returns of industry 𝐼, 𝑟ℎ𝐼𝑡, is
defined as value-weighted average returns of stocks belonging to the industry (𝑗 ∈𝐼):
𝑟ℎ𝐼𝑡 = ∑︀ 𝑗∈𝐼𝑥ℎ𝑗𝑡𝑟ℎ𝑗𝑡 ∑︀ 𝑗∈𝐼𝑥ℎ𝑗𝑡 (1)
where𝑥ℎ𝑗𝑡is the dollar value allocated on stock𝑗 at the date of purchase, or at the beginning of the window if the date of purchase is before the window starts. The market-adjusted experienced return in industry 𝐼, 𝑒𝑟𝑚ℎ𝐼𝑡, is the difference between𝑟ℎ𝐼𝑡 and the market return of period 𝑡, 𝑅𝑚𝑡:5
𝑒𝑟ℎ𝐼𝑡𝑚 =𝑟ℎ𝐼𝑡−𝑅𝑚𝑡 (2)
I consider three measures of investors’ past experienced outcome, which are three indicator variables denoting good, top and bottom experiences. The dummy for good experience,
𝐺𝑜𝑜𝑑𝑒𝑥𝑝ℎ𝐼𝑡, equals to one if household ℎ earns a positive market-adjusted return in indus-try 𝐼 during period 𝑡, i.e. 𝑒𝑟𝑚
ℎ𝐼𝑡 > 0. The dummy for top (bottom) experience, 𝑇 𝑜𝑝𝑒𝑥𝑝ℎ𝐼𝑡
(𝐵𝑜𝑡𝑡𝑜𝑚𝑒𝑥𝑝ℎ𝐼𝑡), equals one if 𝑒𝑟𝑚ℎ𝐼𝑡 is above the 90th (below the 10th) percentile of
market-adjusted experienced returns by all households during period 𝑡. While these indicator
vari-ables are all based on market-adjusted experienced returns which are relative measures of experience, the results are robust to other measures, such as those based on the raw level of experienced returns.
Investors’ purchase decisions are measured by an indicator variable 𝐵𝑛𝑒𝑤
ℎ𝐼,𝑡+1, which takes
5I will use lowercase letters to denote the experienced returns of households, such as 𝑟
ℎ𝐼𝑡, 𝑒𝑟𝑚ℎ𝐼𝑡; and
a value of one if household ℎ purchases new stocks (those not previously owned in the
experience window) in industry 𝐼 in decision period 𝑡+ 1 following the experience period
𝑡. Note that the purchase decisions only focus on new stocks, but not on previously owned
stocks. If I do not exclude the previously owned stocks, the effect of past experiences on the industry level may be confounded with the effect on the experienced stocks themselves.
Barber et al. (2010) find that investors are more likely to repurchase the stocks which have been previously sold for a gain; they also find investors prefer to purchase additional shares of stocks that have lost value since being purchased. Since the experienced return (previously defined) could be either realized or not, the effect on previously owned stocks can push the results either way. Therefore, to separately identify the effect on the industry level, I will only consider purchases of new stocks in the following tests.
2.3
Summary Statistics
Table 1 represents the summary statistics. Panel A reports the frequencies of the trades
of buying new stocks and repurchasing previously owned stocks through the years of the decision periods (1992-1996). The purchases of new stocks account for a large portion (about 85%) of investors’ overall purchase decisions.
Panel B and Panel C summarize statistics related to past experiences. Panel B reports the distribution of households’ experience across industries for each year of experience win-dow. First, there are relatively more households trading in some of the industries, such as (3) manufacturing, (5) high technology, (7) wholesale, and (8) health care, which attract house-holds over 10%. But overall, househouse-holds’ participation in each industry is roughly balanced, which could help rule out the possibility that the results are driven by a concentration of trades in some particular industry. Second, this table could also show the distribution of households’ experience among the industries is stable across years.
Panel C provides a first look at the distribution of experience outcomes within each industry for each year of experience window. We can observe both the cross sectional and the time series variations. For example, during 1991, a great portion of the households
(81.2%) had bad experiences in the energy industry, while over half of the households had
households in the energy industry do not always have bad experiences. In 1993, over half of the households investing in energy had good experiences.
3
Industry Investment Experience and Stock Selection
In this section, I will study the effects of experienced returns in one industry on the decision to purchase new stocks in the same industry. I estimate a baseline specification using a probit model, and then present graphical evidence, followed by several robustness tests, such as using different measures of experienced outcomes, different industry classifications, addressing alternative explanations, etc. Finally, I examines the long term effect of prior experience outcomes on stock selection.
3.1
Graphical Evidence
The monotone increasing relationship between prior experienced outcomes and future purchases can be also illustrated as in Figure2. I divide all the industry experienced outcomes into five bins, ordered by market-adjusted returns in each industry of each period. The right-most bars (group 5) correspond to the top 20% experienced returns, while the left-most bars (group 1) correspond to the bottom 20% experienced returns. The black bars in both figures represent the probability of buying new stocks in the experienced industry.
Figure2(a) employs the original data. It shows a roughly monotone increasing relationship:
as experienced returns go up from quintile 1 though 5, investors are more likely to buy new stocks in the experienced industry, especially so in the upper tail of the experienced return.
Figure 2(b) plots the average of generalized residuals within each quintile. The residuals
are obtained from a probit model of regressing purchases of new stocks in one industry on control variables. The details about control variables will be discussed later. After removing the effects of controls (industry average, wealth effect and etc), the monotone increasing relationship becomes more striking.
3.2
Baseline Model
I start by modelling the probability of purchasing new stocks in one industry with a
probit model. The dependent variable (𝐵𝑛𝑒𝑤
not previously owned in period𝑡) in industry 𝐼 of period𝑡+ 1. The specification is written as follows:
𝑃(𝐵ℎ𝐼,𝑡+1𝑁 𝑒𝑤 = 1) = Φ(𝛽0+𝛽1𝐸𝑥𝑝ℎ𝐼𝑡+𝛽2𝐺𝑜𝑜𝑑𝑒𝑥𝑝ℎ𝐼𝑡+𝛽3𝑇 𝑜𝑝𝑒𝑥𝑝ℎ𝐼𝑡+𝛽4𝐵𝑜𝑡𝑡𝑜𝑚𝑒𝑥𝑝ℎ𝐼𝑡
+ Γ′𝑋ℎ𝐼𝑡) (3)
where Φ(·) denotes the cumulative standard normal distribution function. 𝐸𝑥𝑝ℎ𝐼𝑡is a dummy
variable equal to one if household ℎ has investment in industry 𝐼 in period 𝑡. In the model,
each observation corresponds to a household/industry/year pair. Because I use the Fama-French 10-industry classification, each household/year pair corresponds to 10 observations. The primary coefficients of interest are on the variables of experienced outcomes, which
are measured by three dummy variables, 𝐺𝑜𝑜𝑑𝑒𝑥𝑝ℎ𝐼𝑡, 𝑇 𝑜𝑝𝑒𝑥𝑝ℎ𝐼𝑡, 𝐵𝑜𝑡𝑡𝑜𝑚𝑒𝑥𝑝ℎ𝐼𝑡, equal to
one if household ℎ earns positive, above the 90th percentile, below the 10th percentile
market-adjusted returns in industry 𝐼 of period𝑡. The experience hypothesis that investors
overweight their experienced outcomes predicts a monotone positive relationship between experienced outcomes and future purchases, i.e. 𝛽2 >0,𝛽3 >0,𝛽4 <0.
3.2.A Control Variables
These predications may be consistent with other explanations as well, such as (1) industry momentum trading, (2) wealth effects, and (3) investors’ heterogeneity. I include a vector of controls (𝑋ℎ𝐼𝑡) to address these issues:
Industry Momentum Trading. Moskowitz and Grinblatt (1999) find a strong and prevalent momentum effect in the industry component of stock returns, which provides a way for investors to conduct momentum trading on industry level. Industry-level momen-tum trading could also lead to a positive relationship between prior experienced outcome and subsequent purchases. To control for this confounding effect, I include three industry average variables. They are all based on market-adjusted industry average return,𝐸𝑅𝐼𝑡=𝑅𝐼𝑡−𝑅𝑚𝑡,
where 𝑅𝐼𝑡 denotes the value-weighted average return of industry 𝐼 during period 𝑡.
Cor-responding to the dummy variables measuring experienced outcomes, the three industry
average variables are created as: (1) 𝐺𝑜𝑜𝑑𝑖𝑛𝑑𝐼𝑡: an indicator of industries with positive
(2) 𝑇 𝑜𝑝𝑖𝑛𝑑𝐼𝑡: an indicator of the industry with the highest market-adjusted industry
aver-age return; (3) 𝐵𝑜𝑡𝑡𝑜𝑚𝑖𝑛𝑑𝐼𝑡: an indicator of the industry with the lowest market-adjusted
industry average return.
Wealth Effect. Investors with good experiences in some industries are more likely to have increases in their overall stock portfolios. If investors tend to purchase new stocks in all the industries when their overall portfolios earn profits, the positive correlation between good experiences and future purchases in a specific industry may hence show up. To address this explanation, I include a dummy variable indicating the overall value of the household’s portfolio on common stocks increases during the experience window.
Investors’ Heterogeneity. Investors differ in their investment ability and level of expertise. Some investors with superior ability may be better at picking misvalued securities
or predicting economic prospects. These investors are more likely to gain high returns
and have good experiences. Even though the new purchases are made randomly across industries, we may observe the positive correlation between good past experiences and future
purchases. To ensure that investment ability is not driving the relation, I create three
variables measuring trading characteristics as a proxy of investor’s investment ability. An investor with higher investment ability may trade more frequently, own a larger portfolio or hold a greater number of stocks in the portfolio. The three variables calculated by using the beginning-of-month position data from the experience window are: (1) Average number of stocks in the of-month portfolios; (2) A logarithm of the average size of beginning-of-month portfolios; (3) A logarithm of the average of monthly turnover rate calculated following Barber and Odean (2000).6
3.2.B Basic Results
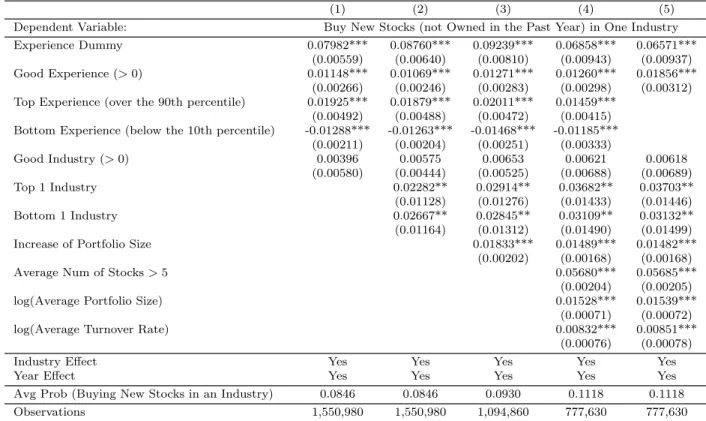
Table 2presents the results. In addition the controls mentioned above, all specifications include year effects and industry effects. The standard errors are clustered by industry-year
6In each month during the sample period, I identify the common stocks held by each household at the
beginning of month 𝑡 from their position statements. To calculate monthly sales turnover, I match these positions to sales during month 𝑡. The monthly sales turnover is calculated as the shares sold times the beginning-of-month price per share divided by the total beginning-of-month market value of the household’s portfolio. To calculate monthly purchase turnover, I match these positions to purchases during month𝑡−1. The monthly purchase turnover is calculated as the shares purchased times the beginning-of-month price per share divided by the total beginning-of-month market value of the portfolio. Finally, monthly turnover is calculated by averaging monthly sales turnover and monthly purchase turnover.
level. I report the marginal effect of each variable in the table.
The results for experience-related variables are consistent across all specifications. I find a significant and monotone increasing relationship between households’ experienced outcomes and their future purchases within the same industry. Columns (1)-(4) include all three experienced-related variables and divide investors’ experienced outcomes into four categories: (1) bottom; (2) bad but not bottom (base category); (3) good but not top; (4) top. According to Column (1), the propensity of buying new stocks in an industry is significantly 1.15 percentage points (pp) higher when the investor enjoys a good but not top experience relative to bad but not bottom. The propensity increases by 1.93 pp more when the investor earns a top experience. In addition, having a bottom experience makes the investor even more reluctant to purchase again in the same industry, the propensity drops by 1.29 pp compared to the base category. These results are consistent with the experience hypothesis that investors have higher propensity to purchase new stocks in the same industry if they experience higher returns in their past investment.
To better understand the economic magnitude, I only include the dummy indicating good experience in Column (5). Relative to having a bad experience, the investor with a good experience has a 1.86 pp higher probability to buy new stocks in that industry. This
magnitude corresponds to 16.60 percent increase (= 1.86 pp/11.18 pp) of the probability
if we normalize it by the average probability of buying new stocks in an industry within a single period (11.18 pp).7
As a comparison with the effect of personal experiences, the effect of industry average returns is quite different and exhibits a U-shaped relationship. The non-extreme industry average variable does not have a significant influence. but the industries with the highest and lowest market-adjusted return both have positive impacts on households’ future purchases.
7In addition, I want to point out that the setting of baseline model is actually estimating a lower bound
of the effect. If the investors are sorted into some industry they think they have information advantage or they are more familiar with, their experienced outcomes may have less influence. And as more and more experience the investors get in some industry, the effect of new experience tends to decrease. Ideally, I would like identify the industries that investors are not sorted into (for example, the investors are attracted by some exogenous events and then start to invest in some industry) and be able to observe investors’ trading records since the first time they enter that industry. Therefore, given the setting of current dataset, the estimated magnitude of experience effect may be dampened due to sorting or diminishing influence as investors cumulate more and more experience in a certain industry.
This evidence is consistent with the “attention grabbing” effect found in Barber and Odean
(2007). Individual investors tend to purchase stocks in the industries which exhibit big price moves, because the stocks in those industries catch their attention. The results of the wealth effect and trading characteristics controls are reported in Column (4). Consistent with our expectations, investors have a higher probability of buying new stocks when they earned money in the past year, trade more frequently and have a larger portfolio invested in the stock market.
As a side note, the marginal effect of the experience dummy is also significantly positive. It implies a significantly positive unconditional effect of prior investment experience. In other words, regardless of outcomes, personal involvement, on average, has a positive effect on the probability of future purchases in that industry. Several explanations could explain this effect. For example, the involvement catches investors’ attention, therefore, the stocks in this industry are more likely to enter the choice set for future purchase; or investors are sorted into certain industries because they may have worked in those industries, have information advantages and tend to buy stocks in those industries. The experience dummy is not the focus of this paper, but it is important to put it as a control in the regression.
3.3
Robustness Tests
These results are robust to alternative experience measures, subsample, explanations and industry classification. Table 3presents a series of robustness tests.
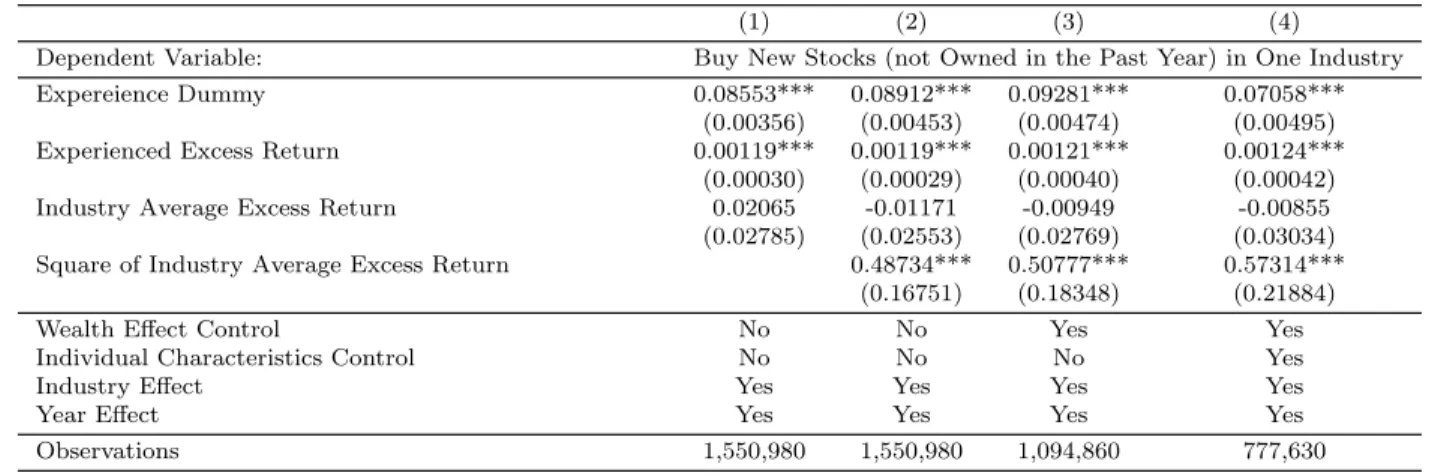
Instead of using dummy variables to measure experienced outcomes and industry aver-age returns, Panel A directly applies the level of market-adjusted experienced returns and industry average returns. The coefficient on the experienced return is significant and pos-itive, confirming that investors have higher propensity to buy new stocks in an industry if they earned higher returns in the same industry in the past. Different from the effect of past experience, the effect of industry average return is nonlinear and represents a U shape,
which is also consistent with the evidence found in Table 2.
In Panel B, I drop the industry-year observations if the household does not have
in-vestment in the industry during the past period. Then I run specification (3) without the
monotone increasing relationship between experienced outcomes and future purchases within the same industry.
Panel C considers an alternative story of mental accounting. If investors apply mental
accounting (Thaler (1999)) and regard each industry as an account, they may rebalance
portfolios only within an industry but not across industries. Such investors purchase stocks in an industry with the money from recent sales in that industry. Because sales are more likely
to happen following good experiences due to disposition effect (Odean (1998)), purchases
following the sales are more likely to happen as well. To address this issue, I exclude the purchases that happen within 30 days after the most recent sales in the same industry. In other words, the dependent variable is a dummy variable which indicates purchases of new stocks without recent sales. The results are virtually unchanged, though the magnitude does drop slightly. According to Column (5), good experience increases the propensity of buying new stocks without recent sales by 0.92 pp relative to bad experience, which corresponds to an increase of 11.35 percent (= 0.92 pp/8.08 pp) if normalized by the average probability of buying new stocks without recent sales in an industry.
I also exploit the Fama-French 48 industry classification as a robustness check. To make the definition of the top and bottom industries match with the definition of the top and bottom experiences, I define the top (bottom) industries as those with the top 5 (bottom 5) industry average returns. The results are reported in Panel D. The results are consistent with those using Fama-French 10 industry classification. Moreover, Column (5) implies that the economic magnitude of the experience effect on Fama-French 48 industry level is also close to that on Fama-French 10 industry level shown in Table2: the effect of a good experience in Fama-French 48 industry corresponds to an increase of 14.08 percent (= 0.27 pp/1.96 pp) in the probability of future purchases in that industry if normalized by the average probability of buying new stocks in an industry. This evidence may suggest that the effect of good experiences within a category do not become stronger when the category switches from 10 industry to a much finer category - 48 industry. I will further analyze how the experience effect varies with different levels of categorization in Section 4.
3.4
Dynamic Effects
I have so far investigated the influence of prior stock investment experience on a one year horizon. In this section, I will further explore whether the effect lasts for a longer time, and how the significance and magnitude change for lagged experience of different time horizons. To exhibit more details about the dynamic effects, I switch to use a monthly window in this section. Given using rolling window regression, the larger size of the experience window reduces the sample size. I will investigate the effects of investment experience in the last 36 months and hence start the decision window from January 1994. This choice represents a compromise between having a reasonable length of history of experience and having enough households in the sample. Since some households open the account or stop trading during the sample period, their trading records do not cover the whole sample period and may not be applicable for the test of the long term effects of experience. Therefore, in this section, I restrict the sample to the households who have already opened accounts since 1991 and still actively trade in 1996.
For each household, I use the data of 36 months before the decision month to create the lagged monthly experience related variables and corresponding control variables. The
dependent variable indicates the investment decision within a month (𝑡+ 1) after January
1994, which is a dummy variable equal to one when the household purchase new stocks (never bought in the past 36 months) in one industry during that month. The specification is written as a probit model as follows:
𝑃(𝐵ℎ𝐼,𝑡+1𝑁 𝑒𝑤 = 1) = Φ(𝛽0+ 36 ∑︁ 𝑚=1 𝛽1𝑚𝐸𝑥𝑝ℎ𝐼,𝑡+1−𝑚+ 36 ∑︁ 𝑚=1 𝛽2𝑚𝐺𝑜𝑜𝑑𝑒𝑥𝑝ℎ𝐼,𝑡+1−𝑚+ Γ′𝑋) (4)
The coefficients on lagged good experience, 𝛽1𝑚, are plotted in Figure 3. The figure shows
that the effect of experience decreases as the experience happened during earlier periods. The coefficients are significantly positive for the experience in the recent 17 months (except the most recent one), but statistically insignificant when it goes further than 17 months. The effects of monthly experiences within the past year are on average 0.40 pp. This magnitude is lower than that in the baseline model because of the change of window frequency to a
monthly level. However, when normalized by the average probability of buying new stocks in an industry in the decision month 2.36 pp, the magnitude still maintains in the same level that good experience increases the propensity of buying new stocks in the same industry by about 16.95 percent (= 0.40 pp/2.36 pp).
3.5
Summary
Investors’ future purchases are influenced by their past experienced returns. If they ex-perience a higher return in an industry, their propensity of purchasing new stocks in that industry increases. This effect is robust after controlling for industry momentum trading, wealth effect, investor heterogeneity and mental accounting. The results remain the same when using different measures of experience, subsample, industry classification. The influ-ence of experiinflu-enced outcomes becomes weaker when the experiinflu-ences go further in the past; the experience from 16 months ago or earlier has insignificant effect.
4
Underlying Mechanisms
The results of the baseline model show a significantly positive relationship between good experience and probability of buying new stocks in the same industry. This section further examines the underlying mechanisms: does the relationship vary with the degrees of investor sophistication, portfolio diversification and categorization?
4.1
Investor Sophistication
The influence of experienced outcomes may vary with investor sophistication. If the experience hypothesis is true, the influence of experienced outcomes on future stock purchase decisions is more likely to be stronger for the less sophisticated investors, because given longer history of more sophisticated investors, the recent good or bad experienced outcomes may be canceled by previous ones and have less influence. However, it can also go in the opposite direction if the alternative story of investment ability is true. If the positive relation between past experienced return and future purchases is created by the better performance and more frequent trading of investors with higher investment ability, this relation should be stronger for the investors with higher sophistication.
I use self-reported experience/knowledge in the dataset as a proxy of investor sophisti-cation. When the household opened an account, they would be asked to fill out a form to report their perception of their experience or knowledge in investment. The four levels they could be used to classify themselves are: extensive, high, limited and none knowledge about investing.8
I conduct the regressions of specification (3) separately for each group of investors and see how the coefficients change among the subgroups. The results are presented in Table
4. As the table shows, the marginal effect of good experience becomes weaker as investors
become more sophisticated. For the most sophisticated subgroup with extensive knowledge about investing, the coefficient is insignificant.9
This evidence is more consistent with the experience hypothesis. The most sophisticated investors have a long history of experiences, and may obtain specialized skills in investing certain industries through their historical experienced outcomes. They are more likely to make new purchases in these specialized industries but are not affected much by their re-cent experience outcomes. In contrast, the least sophisticated ones are new to the stock investment and do not have a long history of experience to cancel out recent experienced outcomes, therefore are more likely to switch across industries depending on whether their experienced outcomes in that industry are good or bad.
4.2
Portfolio Diversification
I next explore the variation in portfolio diversification. Investors with different diversi-fication in their portfolio may take different approach to invest. The investors with more concentrated portfolios may devote themselves to seeking stocks with extraordinary alpha, while some others attempt to diversify their portfolio to reduce idiosyncratic risk. I hy-pothesize that past investment experience matters more to those alpha seekers relative to diversification oriented investors. People who put all their eggs in one basket have to pick
8Because of the missing self-reported data, the sample used in this part is much smaller than the whole
sample, but in unreported tables, I show that the main summary statistics of distribution of trades among industries and distribution of experience across industries and years don’t change much.
9I also run one regression including the observations of all the groups, and interact the sophistication
group with past experience. The results show that the difference of the marginal effect of good experience is statistically significant between the none knowledge group and the extensive knowledge group.
the best basket and their past experience could play a role in their decision making. In contrast, people who put their eggs in multiple baskets would care less about which bas-kets they choose. Therefore, I expect to see that the relationship between past experienced outcome and future new purchases in the same industry is more significant for the investors with more concentrated portfolios.
I test this hypothesis by adding an interaction term between experience-related variable and a diversification measure into the baseline model, the specification is as follows:
𝑃(𝐵ℎ𝐼,𝑡+1𝑁 𝑒𝑤 = 1) = Φ(𝛽0+𝛽1𝐸𝑥𝑝ℎ𝐼𝑡+𝛽2𝐺𝑜𝑜𝑑𝑒𝑥𝑝ℎ𝐼𝑡+𝛽3𝐸𝑥𝑝ℎ𝐼𝑡·𝐷𝑖𝑣𝑒𝑟𝑠𝑖𝑓 𝑖𝑒𝑑ℎ𝑡
+𝛽4𝐺𝑜𝑜𝑑𝑒𝑥𝑝ℎ𝐼𝑡·𝐷𝑖𝑣𝑒𝑟𝑠𝑖𝑓 𝑖𝑒𝑑ℎ𝑡+𝛽5𝐷𝑖𝑣𝑒𝑟𝑠𝑖𝑓 𝑖𝑒𝑑ℎ𝑡+ Γ′𝑋ℎ𝐼𝑡) (5)
I use two measures for portfolio diversification following Ivkovic, Sialm, and Weisbenner
(2008). The first measure is a portfolio Herfindahl Index (𝐻𝐼), which is defined as the sum of the squared weights of each stock 𝑘 in the household stock portfolio (𝑤𝑘), i.e. 𝐻𝐼 =∑︀𝑘𝑤𝑘2. The more diversified the portfolio is, the Herfindahl index is smaller. If a household owns only one common stock, the Herfinndahl Index reaches its maximum and equals to one.
Therefore, I define the dummy variable 𝐷𝑖𝑣𝑒𝑟𝑠𝑖𝑓 𝑖𝑒𝑑𝑖𝑡 equal to one when the Herfindahl
index of investor 𝑖’s portfolio is less than the median in the sample. The second measure
is the number of stocks held in the portfolio. A portfolio with more stocks is considered as more diversified. Similarly, I define the 𝐷𝑖𝑣𝑒𝑟𝑠𝑖𝑓 𝑖𝑒𝑑𝑖𝑡 variable as equal to one when the number of stocks held is greater than 5, which is the median of the sample.
According to results in Table5, the influence of experienced outcomes is stronger among
the investors who hold more concentrated portfolios, since the coefficient on the interaction term between good experience and diversified portfolio is negative and statistically signifi-cant. As for investors with concentrated portfolios, good experience in an industry increases their probability of buying new stocks in the same industry by 1.32 pp. This effect is damp-ened by about 2/3 when the portfolio is more diversified.
4.3
Categorization
Up to this point, I have been using Fama-French 10 industry as the classification of industries. To shed more light on to what extent investors categorize stocks, I will explore how the impact of past experiences varies if I apply a broader categorization or a finer categorization.
4.3.A Spill-over Effect across Industry
I start by testing whether past experiences of Fama-French 10 industries have spill-over effects on the purchases of other industries. The light blue and white bars in Figure2display the probability of purchasing new stocks in other industries by sorting households’ experi-enced market-adjusted returns in the past year. The right-most bars (group 5) correspond to the top 20% experienced returns, while the left-most bars (group 1) correspond to the bottom 20% experienced returns. I create a distance measure among industries to select, among other industries, the one most similar to the experienced industry and the one most different from the experienced industry. For each year, the distance is calculated by averag-ing daily absolute difference between the stock returns of two industries. Suppose there are
𝑁 trading days in one year, the distance between industry 𝐼 and industry 𝐽 (both defined
by Fama-French 10-industry) is described as 𝐷𝐼𝐽 = 𝑁1
∑︀𝑁
𝑡=1|𝑅𝐼𝑡 −𝑅𝐽 𝑡|.10 The matches are intuitive as well. For example, for most of the years, the most similar industry to the industry of oil, gas, and coal extraction and products is the utility industry, while the most different industry is the high technology industry.
Figure 2(a) plots the original probability of purchasing new stocks. The probability in
the most similar industry slightly increases as the experienced return goes up, while the probability in the most different industry almost maintains itself at the same level across different levels of experienced returns. In a word, the effect of past experienced returns becomes increasingly weaker when the industry becomes more different from the experienced industry. Using the residuals from regressing the purchase decision on the controls, Figure
2(b) confirms this evidence.
10I also experimente with another distance measure𝐷
𝐼𝐽= 𝑁1
√︁ ∑︀𝑁
𝑡=1(𝑅𝐼𝑡−𝑅𝐽 𝑡)2, and the results remain
Table 6 uses a regression framework to test whether spill-over effect on other industries is significant while controlling for the wealth effect, investor heterogeneity, year and industry effects. As in Figure 2, I consider the effect on two other industries: the most similar to the
experienced industry and the most different. According to Table 6, compared to the effect
of good experience on the purchases in the same industry, the effect in the most similar industry is only marginally significant, and the magnitude is far smaller than that in the same industry; the effect in the most different industry is even smaller and insignificant. If we also take a look at all the control variables, the significance and magnitude do not change much no matter if it is for the experienced industry or for other industries. This result is consistent with our intuition that wealth effect and investor characteristics should have the same effect on each industry.
The evidence in Figure 2 and Table 6 suggests that the impact of past experience does
not spill over, or if it does only in a tiny amount, to other industries.
4.3.B Categorical Thinking within Industry
In this section, I further investigate whether investors categorize stocks more finely than Fama-French 10 Industry. Specifically, I will consider finer categorization in two dimensions. In the first dimension, the investor may have a finer categorization through the representa-tiveness of the stocks in which the investor has experience. If investors purchased stocks that are representative of the industry, is the impact of experienced outcomes larger compared to if investors invested in unrepresentative stocks? I construct a measure for the
representa-tiveness of each stock. The measure for an experienced stock 𝑗 in industry 𝐼 is computed as
the correlation between the stock return𝑟𝑗𝑡 and the equal-weighted industry return 𝑅𝐼𝑡.11 A higher correlation indicates that the experienced stock is more representative of the stocks in the same industry. The representative stocks identified by this measure are intuitive as well. For example, the representative stocks in the industry of wholesale, retail and some ser-vices include May Department Store, Target, Home Depot, etc., while the non-representative stocks in this industry include Perfumania, Skyline Chili Inc., etc.
I divide the experiences into two groups according to the representativeness of the
ex-11I use equal-weighted industry return to address the concern that the measure would be biased toward
perienced stocks. After removing the effects of controls, Figure 4 displays the probability of purchasing new stocks for experiences on representative stocks and non-representative stocks, respectively. According to the figure, the probability of purchasing new stocks in-creases with experienced returns for both groups, and the probability inin-creases by a larger amount for the more representative group. It means that investors are influenced more by experiencing more representative stocks. If they profit from investing in Target, they may have higher probability to buy other stocks in the wholesale, retail and services industry again. In contrast, a good experience from investing in Perfumania may not have as much impact.
The representativeness captures one dimension of finer categorization based on the statis-tical feature of stock returns, and individual investors may perceive finer categorization in a more intuitive way. They may further divide stocks into subcategories beyond Fama-French 10-industry classification, such as Fama-French 48-industry. If the investors consider stocks under Fama-French 48-industry classification, it should be true that the influence of past experience within the same subindustry (Fama-French 48 Industry) is stronger than that on another subindustry, even though these two subindustries belong to the same Fama-French 10 industry.
The industries under Fama-French 48-industry classification may correspond to multi-ple industries under Fama-French 10-industry classification. To keep the test clean, I only consider one specific industry by Fama-French 10-industry classification in the test. Table
7 reports the results using the data from the Manufacturing industry according to
Fama-French 10-industry classification. As Column (1) shows, good experience in a subindustry is significantly positive related to subsequent purchases of new stocks in the same subindus-try. Column (2) presents the impact on another random subindustry in the Manufacturing industry. The coefficient on the good experience variable is also significantly positive and very close to the impact on the experienced subindustry (Column (1)). If an investor gains a good experience in one subindustry, she may buy new stocks in another subindustry within the same industry with the same probability as she may buy in the experienced subindustry. This evidence may suggest that investors do not think as finer as Fama-French 48-industry classification. To complement the test, I also report the impact on a random subindustry
outside Manufacturing (Column (3)). The coefficient is insignificant, which is consistent
with Table 6: the impact does not spill over beyond Fama-French 10 industry.
Overall, I find that, within Fama-French 10 industry, experiences on more representative stocks have a stronger impact on future purchases in the same industry; but the impact does not seem to become stronger if we further segment Fama-French 10 industry to Fama-French 48 industry.
4.4
Discussion
This experience effect is consistent with two possible mechanisms.12 The first mechanism
is that investors may put more weight on their experience outcomes than on other available historical information when undertaking a Bayesian updating their beliefs about stocks in the same industry. This is a natural explanation for why experience outcomes affect purchase decisions. Good experiences drive posterior expected returns upward, and consequently investors are more likely to buy new stocks in that industry. Another explanation is that investors may construe their experienced outcomes as indications of their ability to invest in a particular industry. Therefore, an investor may (correctly or falsely) learn that she has an advantage in investment in the energy industry when her energy stocks outperform the market; she then buys more stocks in the energy industry to take advantage of this perceived
ability. Table 8provides suggestive evidence for this mechanism. I run a Tobit regression of
the number of trades in one industry (including both buys and sales) on the previous year’s experience-related variables pertinent to that industry, controlling for industry average and individual characteristics. The results show that investors will trade more frequently in an industry after they have had good experience in that industry. This evidence is consistent with the hypothesis that investors may perceive that they are better at picking stocks in the industries in which they had good experiences.
These two mechanisms are not mutually exclusive, and both of them could have impli-cations on investors’ welfare. Under the first mechanism, investors’ past experiences may bias their belief and lead them to miss good investment opportunities. As one practitioner
12Experience could also influence investors’ behavior through other channels. For example, in the context
ofBarber et al.(2010), experienced buying or selling price could affect investors’ reference point and further influence investors’ action since investors tend to avoid anticipated regret. Because my research focuses on the decision of buying stocks not previously owned, the role of affecting reference point may not apply.
notes, “the problem is that in accumulating experience, he also acquires prejudices against industries and stocks because he has lost money in them. It is easy to ... become an
in-vestment bigot with a closed mind on many subjects.”13 Does this behavior hurt investors’
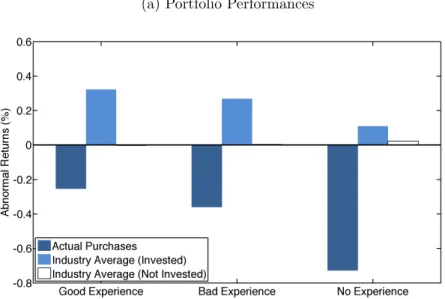
performances? Figure 5compares the returns of actual purchases by the investors with the
returns of two hypothetical strategies: (1) the index of industries in which the investors have picked stocks; and (2) the index of industries which investors could pick but choose not to. I form calendar-time portfolios corresponding to these strategies. For each day, the calendar-time portfolio of actual purchases is constructed to include all stocks bought by households within the prior 21 trading days; and the portfolio of (not) invested industry is formed by investing in indices of the industries in which households have (not) bought
stocks during the prior 21 trading days.14 The weight is equally allocated to each
stock-household (industry-stock-household) pair. Figure 5a displays the monthly abnormal returns of
these three portfolios controlling for Fama-French three factors (Fama and French, 1993).
According to the figure, past experiences do not seem matter much for each portfolio, and in general returns of actual purchases are negative, while the returns of industry averages are
positive. For comparison, Figure 5b plots the difference of the monthly abnormal returns
between actual purchases and the industries invested by households. As the figure shows, the stocks picked by investors earn a much lower return compared to the average returns of corresponding industries. The industry-adjusted returns of picked stocks are statistically significant and negative, indicating that on average individual investors have inferior
stock-picking ability. Additionally, Figure5cplots the difference of the monthly abnormal returns
between industries that are invested and not invested by households. According to the figure, these two returns are quite close to each other and the difference between the two is statis-tically insignificant regardless of whether investors bought in the industries with good, bad, or no experiences. In other words, even though investors tend to purchase more in industries regarding which they have had good experience, they are not missing much as a result of bias towards good experience industries. Individual investors would not systematically pick
13Seehttp://dailyreckoning.com/the-worst-possible-investing-mistake/
14I exclude the stocks bought on the day of forming the portfolio. It is to address the concern that if
investors tend to buy stocks after observing good returns of the industry average of that day, then including the stocks bought on the day of forming the portfolio may mechanically observe the returns of actual purchases lower than the industry average returns by the way constructing the portfolio.
the wrong industries for investment. What may actually hurt their performance is that they appear to systematically pick the wrong stocks for investment.
Considering the evidence that on average individual investors appear to have inferior stock-picking ability as shown in Figure 5, it is more likely that investors incorrectly assess their ability as high because of experienced positive outcomes. As a result, investors are more likely to trade in industries in which they have had good experiences as well as to increase their trading frequency after good experiences. Their performance will then decline, both as a consequence of their inept stock picking ability and the increased transaction costs
of their more frequent trades. Odean and Gervais (2001) point out that investors become
overconfident because they tend to overestimate their trading ability based on their successes and downplay their failures. The evidence in this paper raises another mechanism of building up overconfidence. Investors categorize their portfolio and infer their ability to trade in each category from their past performances. This categorization increases the chances that they will find good performances among categories they invested in and mistakenly attribute their success to talent for investing in those categories. This, in turn, causes the inertia which decreases the likelihood of giving up a stock picking strategy before diversifying their portfolio or exiting stock market.
5
Conclusion
This paper investigates the influence of personal investment experience on subsequent stock selection decisions. Using trading records data for households from a large discount broker collected over the period between 1991 and 1996, I demonstrate that investors have a higher propensity to purchase new stocks in an industry if during the past in that same industry they earned positive excess returns. I also provide evidence that the significance and magnitude of the influence of prior experienced outcomes varies over different time horizons, categorizations, degrees of investors’ sophistication and investors’ portfolio diversification.
The influence of past investment experience may result from investors overweighing their own experience relative to other available historical information when updating their beliefs about stocks in a category (e.g. the industry examined in this paper). The results may also be explained by investors learning about their ability of picking stocks in a certain category
from their experiences. I provide evidence that investors may not systematically miss good opportunities as a consequence of this biased belief updating. Nevertheless, the good experi-ence by inept investors in a given category may lead them to assume that they possess insight regarding decisions in this category. In this case, finer categorization will delay the exit of such inferior investors and cause welfare loss. Furthermore, the aggregation of the influences of investors’ personal investment experiences may have a systematic effect on asset pricing; for example, this experience effect may provide a source of industry momentum effect that is different from the existing explanations in the literature. Finally, if past experience out-comes influence investors’ decisions by affecting information acquisition or the constitution of their information set, we may be able to make richer predictions about the information incorporation in the market.
References
Barber, B. M. and T. Odean (2000). Trading is hazardous to your wealth: The common
stock investment performance of individual investors. Journal of Finance 55, 773–806.
Barber, B. M. and T. Odean (2007). All that glitters: The effect of attention and news
on the buying behavior of individual and institutional investors. Review of Financial
Studies 21(2), 785–818.
Barber, B. M., T. Odean, and M. Strahilevitz (2010). Once burned, twice shy: How pride
and regret affect the repurchase of stocks previously sold. Working Paper.
Barber, B. M., T. Odean, and N. Zhu (2009). Systematic noise. Journal of Financial
Markets 12(4), 547–569.
Barberis, N. and A. Shleifer (2003). Style investing. Journal of Financial Economics 68,
161–199.
Campbell, J. Y., T. Ramadorai, and B. Ranish (2013). Getting better: Learning to invest
in an emerging stock market. Working Paper.
Chan, L. K., H. L. Chen, and J. Lakonishok (2002). On mutual fund investment styles. The
Review of Financial Studies 15(5), 1407–1437.
Choi, J. J., D. Laibson, B. C. Madrian, and A. Metrick (2009). Reinforcement learning and
savings behavior. Journal of Finance 64(6), 2515–2534.
DeLong, J. B., A. Shleifer, L. H. Summers, and R. J. Waldmann (1990). Positive feedback
investment strategies and destabilising rational speculation. Journal of Finance 45, 375–
395.
Fama, E. F. and K. R. French (1993). Common risk factors in the returns on stocks and
bonds. Journal of Financial Economics 33(1), 3–56.
Fama, E. F. and K. R. French (1997). Industry costs of equity. Journal of Financial
French, K. R. and J. M. Poterba (1991). International diversification and international equity
markets. American Economic Review 81(2), 222–226.
Gallagher, J. (2012). Learning about an infrequent event: Evidence from flood insurance
take-up in the us. Working Paper.
Graham, J. R. and K. Narasimhan (2004). Corporate survival and managerial experiences
during the great depression. Duke University Working Paper.
Hertwig, R., G. Barron, E. U. Weber, and I. Erev (2004). Decisions from experience and the effect of rare events in risky choice. Psychological Science 15, 534–539.
Hong, H. and J. C. Stein (1999). A univied theory of underreaction, momentum trading and
overreaction in asset markets. Journal of Finance 54, 2143–2184.
Ivkovic, Z., C. Sialm, and S. Weisbenner (2008). Portfolio concentration and the performance
of individual investors. Journal of Financial and Quantitative Analysis 43, 613–656.
Jackson, A. (2003). The aggregate behavior of individual investors. Working Paper.
Kaustia, M. and S. Knupfer (2008). Do investors overweight personal experience? evidence
from ipo subscriptions. Journal of Finance 63, 2679–2702.
Malmendier, U. and S. Nagel (2011). Depression babies: Do macroeconomic experiences
affect risk taking? The Quarterly Journal of Economics 126(1), 373–416.
Malmendier, U. and G. Tate (2005). Ceo overconfidence and corporate investment. ournal
of Finance 60, 2661–2700.
Malmendier, U., G. Tate, and J. Yan (2011). Overconfidence and early-life experinces: The impact of managerial traits on corporate financial policies. Journal of Finance, Forthcom-ing.
Moskowitz, T. J. and M. Grinblatt (1999). Do industries explain momentum? Journal of
Odean, T. (1998). Are investors reluctant to realize their losses? Journal of Finance 53, 1775–1798.
Odean, T. (1999). Do investors trade too much? American Economic Review 89(5), 1279–
1298.
Odean, T. and S. Gervais (2001). Learning to be overconfident. Review of Financial
Stud-ies 14, 1–27.
Peng, L. and W. Xiong (2006). Investor attention, overconfidence and category learning.
Journal of Financial Economics 80, 563–602.
Thaler, R. H. (1999). Mental accounting matters.Journal of Behavioral Decision Making 12,
183–206.
Weber, E. U., U. Bockenholt, D. Hilton, and B. Wallace (1993). Determinants of diagnostic
hypothesis generation: Effects of information, base rates, and experience. Journal of
Figure 1: Motivating Example: Difference in Stock Holdings by Industry of Young and Old Groups vs Difference in Their Experienced Industry Returns
The stock holdings of an age group in industry 𝑖 are measured by the fraction of households investing in industry𝑖 in a certain year within the age group. The young group is defined as the households with age between 30 and 40, while the old group is defined as the households with age between 50 and 60. The vertical axis denotes the difference in the stock holdings by industry of these two groups. The horizontal denotes the difference in their experienced industry returns. The experience of the young group in industry
𝑖 is measured as the average of industry 𝑖 returns over the prior 10 years, while the experience of the old group is measured over the prior 30 years. Each observation corresponds to a year-industry pair. Industry is classified according to Fama-French 10 industry classification. “High Tech” industry is excluded in this analysis.
Figure 2: The Impact of Personal Investment Experience in an Industry on Subsequent Investment in Experienced Industry vs Other Industry
The observations are sorted by the value weighted average annualized excess return on the investment in an industry and divided into five groups. Group 1 has the lowest experienced return while group 5 has the highest. Figure (a) plots the original probability of buying new stocks, i.e. the percent of households buying new stocks in an industry. Figure (b) plots the generalized residuals from a probit model of regressing purchasing new stocks in an industry on controls of the baseline model.15The dark blue bars correspond to the experienced industry. The light blue and white bars correspond to the industry that is the most similar to or the most different from the experienced industry, respectively. The most similar and the most different industries are selected by measuring the distance between the stock returns in that industry and those in the experienced industry. The distance is measured by averaging daily absolute difference between the stock returns of two industries.
(a) Original (b) Removing Effects of Control Variables
15The generalized residual of the probit model𝑃 𝑟(𝑌
𝑖= 1) = Φ(𝑋𝑖′𝛽) is computed as:
𝑌𝑖−Φ(𝑋𝑖′𝛽)
Φ(𝑋𝑖′𝛽)(1−Φ(𝑋𝑖′𝛽))𝜑(𝑋 ′
𝑖𝛽)
Figure 3: Dynamic Effects of Monthly Lagged Industry Experienced Outcomes
This figure shows the dynamic effects of experienced outcomes in the past 36 months on subsequent purchases of new stocks. The sample includes all the investors who already have investment from 1991 and still trade in 1996 in the dataset. The solid line connects the estimated coefficients of a rolling-window probit regression of purchasing new stocks on monthly experienced outcomes during the past 36 months. Time 0 corresponds to the decision window during which the decisions whether purchasing new stocks are made. The decision window starts from January 1994 through December 1996. The regressions are controlled for industry momentum. The broken lines show the 5% and 95% confidence intervals.
Figure 4: The Impact of Investment Experience: Variation in Representativeness of Experi-enced Stocks
The observations are sorted by the value weighted average annualized excess return on the investment in an industry and divided into three groups. Group 1 has the lowest experienced return while group 3 has the highest. The figure plots the generalized residuals from a probit model of regressing purchasing new stocks in an industry on controls of the baseline model.16The blue bar corresponds to the observations with experiences in the non-representative stocks, while the red bar corresponds to those with experiences in the representative stocks. The sample only includes the observations whose representativeness measures are available. The representativeness measure for one experienced stock 𝑗 in industry 𝐼 is computed as the correlation between the stock return 𝑟𝑗𝑡 and the equal-weighted industry return 𝑅𝐼𝑡. The representative
stocks are defined as stocks with representativeness measures greater than the median.
16The generalized residual of the probit model𝑃 𝑟(𝑌
𝑖= 1) = Φ(𝑋𝑖′𝛽) is computed as:
𝑌𝑖−Φ(𝑋𝑖′𝛽)
Φ(𝑋𝑖′𝛽)(1−Φ(𝑋𝑖′𝛽))𝜑(𝑋 ′
𝑖𝛽)