STRUCTURE OF THE WORLD ECONOMY
Outline of a Simple Input-Output Formulation* Nobel Memorial Lecture, December 11, 1973 by
WA S S I L Y LE O N T I E F
Harvard University, Cambridge, Massachusetts, USA.
I
The world economy, like the economy of a single country, can be visualized as a system of interdependent processes. Each process, be it the manufacture of steel, the education of youth or the running of a family household, gener-ates certain outputs and absorbs a specific combination of inputs. Direct inter-dependence between two processes arises whenever the output of one becomes an input of the other: coal, the output of the coal mining industry, is an in-put of the electric power generating sector. The chemical industry uses coal not only directly as a raw material but also indirectly in the form of electri-cal power. A network of such links constitutes a system of elements which depend upon each other directly, indirectly or both.
The state of a particular economic system can be conveniently described in the form of a two-way input-output table showing the flows of goods and services among its different sectors, and to and from processes or entities (“value added” and “final demand”) viewed as falling outside the conven-tional borders of an input-output system. As the scope of the inquiry expands, new rows and columns are added to the table and some of the external in-flows and outin-flows become internalized. Increasing the number of rows and columns that describe an economic system also permits a more detailed de-scription of economic activities commonly described in highly aggregative terms.
Major efforts are presently underway to construct a data base for a syste-matic input-output study not of a single national economy but of the world economy viewed as a system composed of many interrelated parts. This global study, as described in the official document, is aimed at
“helping Member States of the United Nations make their 1975 review of world progress in accelerating
development and attacking mass poverty and unemployment. First, by studying the results that prospective
environmental issues and policies would probably have for world development in the absence of changes in national and international development policies, and
* The author is indebted to Peter Petri for setting up and performing all the compu-tations, the results of which are presented in this lecture, and to D. Terry Jenkins for preparing the graphs and editorial assistance.
156
secondly, by studying the effects of possible
alternative policies to promote development while at the same time preserving and improving the environment. By thus indicating alternative future paths which the world economy might follow, the study would help the world community to make decisions regarding future development and environmental policies in as rational a manner as possible.“1
Preliminary plans provide for a description of the world economy in terms of 28 groups of countries, with about 45 productive sectors for each group. Environmental conditions will be described in terms of thirty principal pollut-ants; the use of non-agricultural natural resources in terms of some 40 dif-ferent minerals and fuels.
I I
The subject of this lecture is the elucidation of a particular input-output view of the world economy. This formulation should provide a framework for assembling and organizing the mass of factual data needed to describe the world economy. Such a system is essential for a concrete understanding of the structure of the world economy as well as for a systematic mapping of the alternative paths along which it could move in the future.
Let us consider a world economy consisting of (1) a Developed and (2) a Less Developed region. Let us further divide the economy of each region into three productive sectors: an Extraction Industry producing raw materials; All Other Production, supplying conventional goods and services; and a Pol-lution Abatement Industry. In addition to these three sectors, there is also a consumption sector specified for each region. The function of the Abatement Industry is to eliminate pollutants generated by the productive sectors, con-sumers, and the Abatement Industry itself.
The two input-output tables displayed as Figure 1 describe the inter-sector-al flows of goods and services within the Developed and the Less Devel-oped economies. The flow of natural resources from the Less DevelDevel-oped to the Developed Countries, as well as the opposite flow of Other Goods from the Developed to the Less Developed Countries are entered in both tables: positively for the exporting region, and negatively for the importing region.
In each of the two tables the right-most entries in the first and second row represent the total domestic outputs of the Extraction Industry and of Other Production, respectively.
Each positive number along the third (Pollution) row shows the physical amount of pollutant generated by the activity named at the head of the column in which that number appears. The negative quantity shown at the intersection of the third column and the third row represents the amount of
1 Quoted from: “Brief Outline of the United Nations Study on the Impact of
Prospec-tive Environmental Issues and Policies on the International Development Strategy.” April 1973.
157 Fig. 1. W. Leontief
W O R L D E C O N O M Y I N 1 9 7 0
(Billions of 1970 dollars)
DEVELOPED COUNTRIES Total output 63 6 4pollutant eliminated by Abatement activites.2 Inputs such as power,
chemi-cals, etc. purchased by the Abatement Industry from other sectors, and value added paid out by that industry are entered as positive amounts in the same third column. The difference between the total amount of pollution generated in all sectors and the amount eliminated by the Abatement sector is represent-ed by the net emission figure, the right-most entry in the third row. Finally, labor inputs used in each sector and payments made to other income-receiving agents are shown in the bottom two rows.
2 All quantities are measured in billions of dollars “in current prices”; pollutants are
The numbers in these two tables are strictly speaking, fictitious. But their general order of magnitude reflects crude, preliminary estimates of intersec-toral flows within and between the Developed and Less Developed regions during the past decade.
For analytical purposes, the outputs and inputs of the Extraction Industry and Other Production, as well as the amounts of pollutants generated and abated, can be interpreted as quantities measured in the appropriate physi-cal units (pounds, yards, kilowatts, etc.). The same is true of the services of some of the so-called primary factors: labor inputs, for example, are entered in the second to last row of each table. A similar physical measurement of the other components of value added, even if it were possible in principle, is impossible given the present state of knowledge. In pure, or should I say speculative economic theory, we can overcome this kind of difficulty by intro-ducing some convenient albeit unrealistic assumptions. But a theoretical for-mulation designed to permit empirical analysis has to account for the fact that at least some components of value added cannot be interpreted as pay-ments for measurable physical inputs, but must be treated as purely mone-tary magnitudes.
I I I
The flows described in the two input-output tables are interdependent. They have to satisfy three distinct sets of constraints. First, within each production or consumption process there exists a technological relationship between the level of output and the required quantities of various inputs. For example, if we divide each figure in the first column of the first table of Figure 1 (the inputs of the Extraction Industry) by the total output of that sector (the last figure in the first row), we find that to produce one unit of its output this sector absorbed .3372 units of the output of Other Production, used .2867 units of Labor Services and spent .3332 dollars for other value added. More-over, for each unit of useful output the Extraction Industries generated .0859 units of pollution. Other sets of input-output coefficients describe the techni-cal structure of every sector of production and consumption in both groups of countries.
While statistical input-output tables continue to serve as the principal source of information on the input requirements or “cooking recipes” of various industries, increasingly we find economists using engineering data as a supplemental source. Complete structural matrices of the two groups of coun-tries used in our example are shown in Figure 2.
The second set of constraints that has to be satisfied by every viable system requires that the total (physical) amounts of outputs and inputs of each type of good must be in balance, i.e., total supply must equal total demand. In the case of a pollutant, net emission must equal the total amount generat-ed by all sectors less the amount eliminatgenerat-ed by the abatement process.
For example, the balance between the total output and the combined in-puts of extracted raw materials can be described by the following equation:
W. Leontief 159
x1 and x2 represent the total outputs of the Extraction Industry and of Other Production respectively; x3, the level of activity of the Abatement sector; y, the sum total of values added, i.e., Gross National Income. The “technical c o e f f i c i e n t ” aij represents the number of units of the product of sector i absorbed (or generated in the case of pollution) by sector j in producing one * The coefficients in these tables do not sum to unity because the pollution generated by industry and by final demand is only partially abated in the developed countries and not abated at all in the less developed countries.
160 Economic Sciences 1973 Fig. 3. PHYSICAL SUBSYSTEM 1.3 1.4 1.5 1.6 1.7 1.8 1.9 2.4 2.5 2.6 2.7 2.8 1 -1 = 0
Cl
unit of its output; cj is a “consumption coefficient” describing the number
of units of the output of sector j consumed (or generated in the case of pollu-tion) per unit of total value added, i.e., per unit of Gross National Income.
Figure 3 displays the complete set of linear equations describing the physi-cal balances between outputs and inputs of all sectors in both countries in
terms of compact matrix notation. The last of these equations - written
below in its explicit form - describes the flows of exports and imports that link the Developed and Less Developed areas into a single world economy.
The balance of trade B, i.e., the difference between the monetary value of the two opposite trade flows, depends not only on the quantities T1 and T2 of traded goods but also on their prices, pl and p2. The higher the price a country receives for its exports, or the lower the price it pays for imports, the better are its “terms of trade”.
W. Leontief 161 The last of the three sets of relationships describes the interdependence of the prices of all goods and services and the values added paid out, per unit of output, by each industry. For example, a typical equation in this set states that the price at which the Extraction sector sells one unit of its output equals the average outlay incurred in producing it. This includes the costs (i.e., quantities X prices) of inputs purchased from other sectors, wages paid and all other value added:
The technical coefficients (aij a n d Q’S) appearing in this equation are
the same as those appearing in the structural matrices of Figure 2. The
abate-ment ratios qi represent the fraction of the gross pollution emission of
in-dustry i that is eliminated (at that inin-dustry’s expense)* by the Abatement Industry.
In this example, the system of physical balances contains 9 equations with 15 variables, while the price-values-added system has 8 equations with 14 variables. But these 14 variables are reduced to 12 and the number of equa-tions to 6 if one assumes from the outset that the internationally traded pro-ducts of the Extraction Industry and Other Production have the same price in the Developed and the Less Developed Countries. Equations 2.7 and 2.8 worked out explicitly read:
The combination of both systems viewed as a whole contains 29 unknowns but only 17 equations. Thus, to arrive at a unique solution, we have to fix the values of 12 variables on the basis of some outside information, i.e., their values have to be determined exogenously.
Two types of quantitative information are required for the solution of this system. First, some data are used in the form of appropriate structural coef-ficients. Other kinds of factual information are introduced by assigning specif-ic numerspecif-ical values to appropriate “exogenous” variables.
In view of the uneven quality of data that will constitute the empirical ba-sis of the present inquiry, it would be a tactical mistake to pour all the factual information we possess into the rigid mold of a single, all-embracing, inflexible * This formulation is based on the assumption that the pollution generated by a partic-ular sector is being eliminated at its own expense. In case the abatement cost is being paid out by the government out of its tax revenues, the price equations have to be modi-fied accordingly. See W. Leontief, “Environmental Repercussions and the Economic Structure,” Review of Economics and Statistics , August 1970 and The Measurement of Economic and Social Performance , edited by Milton Moss, Studies in Income and W e a l t h S e r i e s , N o . 3 8 ( N e w Y o r k : C o l u m b i a U n i v e r s i t y P r e s s , 1 9 7 3 , p p . 5 6 5 - 5 7 6 .
162 Economic Sciences 1973
explanatory scheme. The decision of which variables should be treated as dependent and which should be fixed exogenously is essentially a tactical one. The theoretical formulation is a weapon; in deciding how to use it we must take into account the nature of the particular empirical terrain.
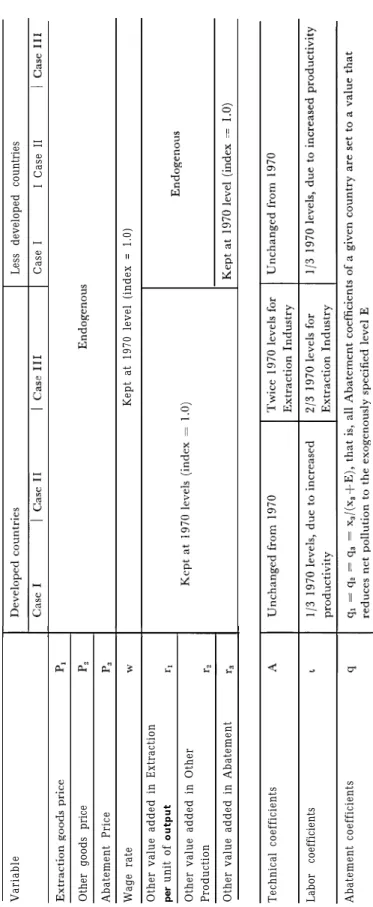
To assess the influence of factors considered external to our theoretical description of the world economy, we earmark six physical and five value added variables as “exogenous”. Figures 4 and 5 show which variables are endogenous and assign values to all exogenous variables. These assumptions permit us to project changes in our simple world economy from a state re-presentative of the present (“1970”) to three alternative hypothetical states about thirty years hence (“2000 (I)“, “2000 (II)” and “2000 (III)“).
Total labor input in Developed Countries, L1, is exogenous: under full or
nearly full employment, its magnitude depends on demographic and cultural factors not accounted for within our formal theoretical system. Substantial endemic unemployment in the Less Developed Countries makes it advisable to consider the level of total employment as depending on the level of output - that is to treat L2 as endogenous.
The output of the Extraction Industry in the Developed Countries is re-stricted by the limited availability of natural resources. We account for this
limitation by making 1x1 exogenous. In the Less Developed Countries, where
natural resources are still plentiful, the output of the Extraction Industry,
2x1, depends partly on a small domestic market but primarily on the import
requirements of Developed Countries. Thus, 2x1 can be treated as a dependent
variable.
The situation is reversed in the case of Other Production. In Developed Countries the output of manufactured goods normally adjusts to the level
of final demand, making 1x2 a dependent variable. Yet in the Less Developed
Countries the output of Other Production, 1x2, is restricted by external factors such as weak infrastructure and limited capital. In this case rising domestic
inputs usually stimulate a growing demand for imports. Hence, 2x2 is treated
as independent and T1 and T2 as dependent variables.
In the price-value added system of equations, all money wages and other
value-added payments in the Developed Countries (w, rl, r2 and r3) are
exogenously determined. This means that the prices of all three products can be derived endogenously. In Less Developed Countries the situation seems to be different: since the prices of commodities produced by Extraction and Other Production are determined by the cost of their production (including the exogenous value added) in the Developed Countries, the value added that can be paid out by the two sectors producing these goods in the Less Developed Countries, 2r1 and 2r2, simply reflect the difference between a given price and the production costs.
Raw materials are, as a rule, relatively more abundant and more cheaply extracted in Less Developed Countries, thus the value added earned by Ex-traction Industries in Less Developed Countries can be expected to be rela-tively high. Ricardo speaks in this connection of “mining rents”. On the other hand, technical input coefficients or, more properly, costs in Other
Figure 5 PRICE SYSTEM ASSUMPTION
S
Variable Other goods price Abatement Price Wage rate Other value added in Extraction per
unit of
outpu
t
Other value added in Other Production Other value added in Abatement Less developed countries Case I
Kept at 1970 level (index = 1.0)
W. Letontief 165 tion of the Less Developed Countries can be expected to be higher than in Developed Countries. Because of this, the value added earned per unit of out-put in that sector tends to be relatively low.
Since a principal purpose of the aforementioned United Nations project is a “realistic evaluation of the effects of alternative types of environmental policies on the economic prospects of Less Developed Countries”, net pollution
emissions E1 and E2 are treated as exogenously determined in two of our
pro-jections.
Assigning specific numerical magnitudes to all exogenously determined variables permits effective use of a variety of external data in arriving at a unique numerical solution of the formal input-output system. As the empiri-cal inquiry advances, exogenous variables can be internalized through intro-duction of additional equations.
The most important but also the most demanding step in implementing an empirical input-output system is the determination of values of hundreds or even thousands of structural coefficients. The relevant methodologies are so varied and specialized that I abstain from discussing them in this general context.
I V
As has been explained above, three different sets of factual assumptions pro-vided the basis for the three alternative projections of the state of one simple world economy for the year “1970” to the year “2000.” Figures 4 and 5 contain their full specification, while the results of the computations are sum-marized in three pairs of input-output tables presented in the Appendix.
The bar charts displayed in Figure 6 and 7 facilitate a systematic examina-tion of these findings. The width of each bar represents the relative size of the corresponding economic activity measured in base-year dollars. The length of each bar indicates the percentage increase or decrease in the level of each activity as the world economy passes from one state to another. Exogenous variables are identified by asterisks.
The long bars in the uppermost rows of these economic profiles indicate an upsurge in output and total consumption and a downward movement of prices: a “great leap forward” from 1970 to 2000. Case I is a projection that critically depends on two assumptions. First, the employed labor force in Developed Countries will increase with population growth. Second, labor productivity in both regions (the reciprocal of the labor coefficient) will be three times as high in 2000 as in 1970, with all other input coefficients re-maining the same. Strict enforcement of standards contained in the United States Clean Air Act of 1967 (as amended in 1970) will bring about a sharp drop in unabated emissions in the Developed areas, while in Less Developed Countries the absence of any abatement activity will force the pollution level up. International trade will expand faster than domestic economic activi-ties. Prices (measured in wage units) will decline, while the value added in Less Developed Countries will rise in the Extraction Industry but fall in Other Production.
166 Fig. 6.
How would the future economic picture change if strict anti-pollution stan-dards were also observed in Less Developed Countries? The answer is pre-sented in the second row of bar graphs on Figures 6 and 7. In the Developed Countries there will be practically no change. In Less Developed Countries the inauguration of abatement activities aimed at limiting pollution to twice its 1970 level would bring about expanded employment while requiring some sacrifices in consumption. Value added would fall sharply in the Extraction Industry and somewhat less in Other Production.
How would the situation thus attained be affected by a significant increase in the operating costs of the Extraction Industry in the Developed Countries? The bottom row of profiles in Figures 6 and 7 shows how the conditions in both regions of the world economy would be affected if the productivity of labor in the Extraction Industry of Developed Countries rose only 1 1/2 rather than 3 times between 1970 and 2000 while the amounts of other Extrac-tion inputs doubled per unit of output. The output of Other ProducExtrac-tion in the Developed Countries would register a slight increase and the level of con-sumption a slight decrease. Concon-sumption in the Less Developed Countries would experience a substantial increase. The mechanism responsible for such a redistribution of income between the Developed and Less Developed
Coun-W. Leontief 167 Fig. 7.
Less Developed Countries
tries involves a steep increase in the price of Extraction goods compared to other prices, a corresponding rise in value added (rents yielded by the Extrac-tion Industry of the Less Developed Countries) and finally, a substantial in-crease in imports accompanied by slight reduction of exports from these coun-tries, both reflecting a marked improvement in their “terms of trace.”
I refrain from drawing any factual conclusion from the economic projec-tions presented above. The computer received fictitious inputs and necessarily issued fictitious outputs. All theories tend to shape the facts they try to ex-plain; any theory may thus turn into a procrustean bed. Our proposed theoret-ical formulation is designed to protect the investigator from this danger: it does not permit him to draw any special or general conclusions before he or someone else completes the always difficult and seldom glamorous task of ascertaining the necessary facts.
Extraction Industry Other Production Pollution
DEVELOPED COUNTRIES
LESS DEVELOPED COUNTRIES
Total
O u t p u t
9 8 17765 25