Technical Report
TR-2007-022
Frequent Pattern Mining for Kernel Trace Data
by
Christopher LaRosa, Li Xiong, Ken Mandelberg
Mathematics and Computer Science
EMORY UNIVERSITY
Frequent Pattern Mining for Kernel Trace Data
Christopher LaRosa, Li Xiong, and Ken Mandelberg
Department of Mathematics and Computer Science
Emory University, Atlanta, GA 30322
{clarosa, lxiong, km}@mathcs.emory.edu
Abstract
Operating systems engineers have developed tracing facilities to log process execution at the kernel level in order to better understand actual execution taking place on real systems. Uncovering certain types of useful information in this trace data is nearly impossible through manual inspection of a trace log. To detect interesting inter-process communication patterns, and other recurring runtime execution patterns on systems, we employ data mining techniques, in particular, frequent pattern mining, to analyze operating system trace logs. We present a framework for mining kernel trace data, making use of frequent pattern mining in conjunction with special considerations for the temporal characteristics of kernel trace data. We present the pre-processing and data reduction steps necessary to convert operating-system trace logs into easily mined data. We illustrate how an operating system’s abstractions serve as a basis for both classification and data reduction. Finally we experimentally validate our approach in terms of feasibility, effectiveness, and cost through two case studies. We use our framework to isolate processes responsible for systemic problems on Solaris and LINUX systems and demonstrate our framework is versatile and efficient.
1. Introduction
The introduction of low-impact kernel-level tracing tools allows for comprehensive and transparent reporting of process and operating system activity. An operating system trace log provides detailed, explicit information about which processes use which system resources at what time. This time series data contains underlying knowledge, such as common execution patterns. This information can assist in both simple and complex systems-related tasks: application debugging, security enforcement, performance optimization, operating systems debugging, and dynamic reconfiguration. However, while kernel trace collection tools have advanced and matured, there remains a lack
of proper trace analysis tools for extracting useful knowledge from raw trace logs.
1.1 Motivation and Goals
Most current trace collection tools, such as the Linux Trace Toolkit (LTT) [20] and Solaris’s dTrace [2], provide powerful mechanisms for collecting data. Unfortunately for their users, the tools provide limited or no functionality for analyzing the data collected. Neither LTT nor dTrace provide analysis functionality beyond simple aggregations, which must be specified before a trace can begin. Neither tool provides a mechanism to look for patterns either during a trace or after a trace is completed. The omission of such functionality is likely not an oversight; the data collected by tracing systems is abundant and complex.
The lack of proper kernel trace analysis tools motivates us to build a framework that applies data mining techniques to analyze kernel trace data. The framework is designed to discover patterns that could not be detected with existing tools or manual inspection. We would like to study pre-processing and data mining techniques that can be used to identify interesting recurring inter-process communication patterns in noisy kernel trace data. These execution patterns can potentially help a variety of users including system administrators, application programmers, operating systems engineers, and security analysts.
Systems administrators would benefit from data mining functionality for detecting frequent execution patterns and resource usage patterns that escape detection using traditional system-monitoring tools. When they are charged with optimizing systems’ performance, frequent execution patterns form a starting point for detecting otherwise non-obvious, but significant systemic problems.
Application programmers would benefit from mining functionality in debuggers. Augmenting debuggers with mining functionality would provide an opportunity to both enlighten developers about the effects of their code on overall system functioning and ensure better quality software.
Operating System Engineers can use data mining to analyze the output of kernel tracing tools to tune the performance of the most complex program running on a computer: the operating system itself. In contrast to user space programs, which sit atop a deterministic virtual machine, the operating system sits atop an exception driven real machine. Observing the same course of execution twice for a single workload inside the operating system, where frequent traps and interrupts continually change the order of execution, remains a near impossibility. It is this partially ordered nature of OS execution that makes detecting sequential patterns in trace data difficult.
In the systems area, data mining techniques have been successfully used in the past for profiling and detecting mal-ware [17], optimizing data placement and prefetching for fast retrieval [13], and detecting operating system bugs introduced by copying and pasting of kernel source code [14]. To our knowledge, ours is the first effort for a general-purpose solution that mines across multiple kernel subsystems and the first attempt to tackle the task of mining kernel trace logs.
1.2 Issues and Challenges for Mining Kernel
Trace Data
While data mining techniques [5, 9] have been successfully applied to mine time-series data in a variety of applications, mining kernel trace presents a unique set of challenges. We discuss each of them below.
Log Data Volume and Complexity. The complex
and voluminous data generated by kernel tracing tools
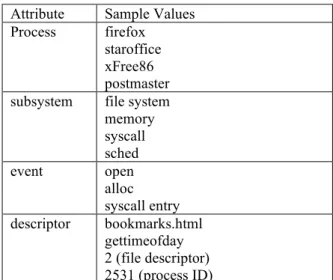
create our first mining challenge. A typical kernel tracing tool, the Linux Trace Toolkit (LTT), can each report thousands of kernel-event records every second. During our experimentation on a Pentium 4 workstation, LTT logged nearly a million events per minute during normal user activity. Each kernel event is a multi-attribute tuple containing, a record of which process caused the event, the sub-system of the operating system involved with executing the event, the actual event type, the address or descriptor for any resource accessed during the event, and the time at which the event occurred. Sample values for these attributes are shown in Table 1.
Pattern Complexity. Further adding to the challenge of mining kernel trace data, is our desire to detect
complex patterns in multiple attribute data. To uncover
systemic problems on a system, we cannot focus our attention on one subsystem or application, mining only for patterns across a single attribute. For example, isolating the source of a memory allocation problem would necessitate looking for events in at least two
Attribute Sample Values Process firefox
staroffice xFree86 postmaster subsystem file system
memory syscall sched event open alloc syscall entry descriptor bookmarks.html gettimeofday 2 (file descriptor) 2531 (process ID)
Table 1. Trace Attributes with Sample Values
attributes: the event attribute for each event that affects memory usage, and the process attribute to determine which program generated the event. Uncovering complex inter-process, inter-subsystem interactions requires mining along multiple attributes.
Temporality. Another important consideration for mining a kernel trace is appropriate treatment of the time-series data. In trying to detect patterns in a computer’s ordered execution, the timestamp attribute plays a key role in defining what constitutes an interesting pattern. The timestamp attribute allows us to find more interesting patterns and information using data mining techniques than we could obtain by computing event aggregations and averages for data in kernel trace logs. In addition, the unique scheduling characteristics of the operating system make the kernel trace mining task not a straightforward application of existing sequence mining algorithms.
Meaningful Pattern Reporting. Finally we must consider a way to interpret the results of our mining system. One main concern in generating our output of patterns is that events related to systemic problems could appear in the logs with not too high frequencies, whereas some normal events could appear with high frequency. Our system needs to identify those not-too-frequent patterns that indicate problems. In addition, we should provide efficient ways to hide very frequent patterns that do not indicate problems. Because our users – those people interested in kernel-level activity – will be very technical, our concern is not how to hide technical details from the user, but how to direct the user toward the most meaningful results. Toward this end we develop a set of tools to help in measuring the quality of the mining system’s output.
1.4 Contributions and Organization
Bearing the above issues in mind, we design a framework for effectively and efficiently mining kernel trace logs and implement a suite of kernel mining tools to test the design. Our framework makes a number of unique contributions. First, we transform the problem of kernel trace data pattern mining to maximal frequent itemset mining. We provide special treatment for the unique temporal characteristics of kernel trace data and propose a combined approach of window folding and window slicing to group trace events into itemsets using their timestamp as a measure of temporal proximity (Section 2.2). Second, we develop a data filtering technique that allows versatile and flexible cross-attribute pattern mining (Section 2.3). Third, we develop and implement a suite of tools that use a bit
packing strategy to maintain the full semantics of each
trace event inside an integer and allow for efficient mining (Section 3). Finally, we perform experimental studies where the tools are used to detect systemic problems on Solaris and LINUX systems. We test our tools with a range of algorithmic parameters, showing the feasibility, effectiveness, and cost of the approach (Section 4). In particular, the extensive experiments provide insight as to how parameters can be selected in order to generate interesting patterns with minimal interference from typical, non-problematic execution events. We conclude the paper with a review of related work (Section 5), a brief summary and a discussion of futures directions (Section 6).
2. Kernel Trace Mining Framework
Kernel trace logs are massive, ordered records of events that occur inside the operating system. Their contents provide detailed, explicit information about which processes use system resources. Our goal is to find common execution patterns so that we can better understand the internal execution that is taking place on a machine. In this section, we present an overview of our framework and show how we model kernel trace mining by considering sequential mining.
2.1 Overview
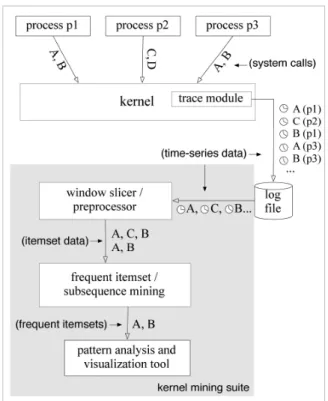
We present a conceptual diagram of our framework for mining kernel data in Figure 1. In our system, un-modified processes, such as daemons and user applications, make requests of the operating system in the form of system calls. A trace module inside the operating system transparently monitors these calls and other internal activity. The trace monitor writes a detailed, time-series record of these events to a log file. The preprocessing utilities in our suite harvest the time-series data from a log and translate it into itemset
Figure 1. System Architecture
data for frequent itemset mining. The preprocessor output is passed into a frequent itemset mining tool and the output patterns are passed to a program for display and analysis.
2.2 Mining Frequent Sequential Patterns
Finding frequently occurring patterns in ordered or time-series data like our trace logs is a mining task commonly referred to as Sequential Pattern Mining. This section details how typical sequential pattern mining algorithms are not appropriate for kernel trace mining and how we account for the special temporal characteristics of kernel trace data and model the problem as frequent itemset mining.
2.2.1 Sequential Mining Problem
Before we describe how we model the trace mining problem, we first give a brief review of the sequential pattern mining [5]. Given an ordered series of events,
S, and a minimum support, min_sup, mining for frequent sequences involves finding the set of all ordered series of events, F, that occur at least min_sup
times in S. For example, with min_sup = 2 and S = <A, C, B, A, B> we have the frequent sequences F = <A, B>, <A>, <B>. These frequent subsequences are referred to as serial episodes.
Additional constraints may be placed on the sequential mining problem. Constraining the interval i
Figure 2. Alternative Scheduling of a Single
Load
elapsed between any two consecutive items in a serial event. On an integral timescale an interval of 0 requires all serial events to have no intervening events. With our original S, min_sup=2, i=0, only the single event series <A> and <B> would be reported as frequent series; there would be no multi-itemsets in our results.
Kernel trace logs have unique temporal characteristics due to the partially ordered execution resulting from OS scheduling. We discuss below why we need a special treatment of the kernel trace data compared to typical time-series data. We propose two important techniques for the treatment, namely, event folding and window slicing. Event folding creates a series of parallel events and window slicing creates a sequence database. Together these steps create a database of parallel events. As a result, we treat the parallel events as unordered and reduce the problem of sequential pattern mining to frequent itemset mining.
2.2.2 Window Folding
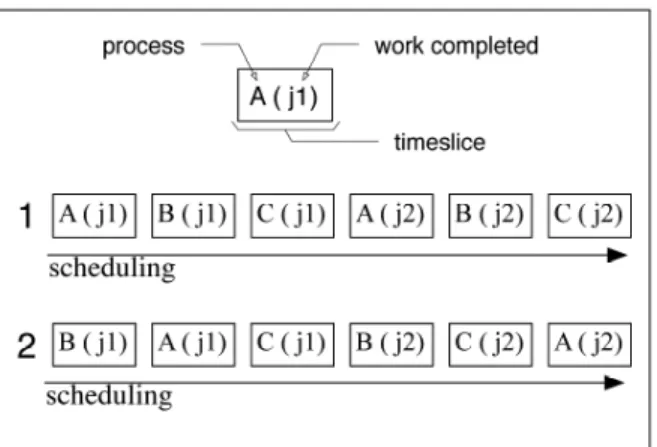
For the purposes of examining system trace data we need to maintain a sufficiently large interval to account for sequence gaps and re-orderings introduced by the operating system’s scheduler. On any modern OS the scheduler will regularly suspend the execution of a process so that other processes may execute. The maximum period for which a process may execute uninterrupted by the scheduler is referred to as the timeslice. Intervals used by our mining algorithms need to be sufficiently long to detect patterns that exist across multiple timeslices. Certainly if we hope to find inter-application patterns we need to consider more than one process at a time. Furthermore, because the scheduler does not guarantee any ordering of process execution to processes, detecting common process interactions requires relaxing the definition of sequence mining further to allow changes in ordering.
Suppose jobs j1 and j2 require inter-process communication among processes A, B, and C. A and B’s execution can happen in any order. Furthermore, C is dependent on B having completed its work. The two similar jobs j1, j2 could be completed according to either of the execution schedules shown in Figure 2.
Both sequences illustrate the same pattern of collaborative work being done by the same processes but in different orders of execution. Unless we relax the ordering constraint typically enforced in sequence mining, we will fail to generate any sequences demonstrating the interesting interaction between processes A, B, and C.
In order to expose inter-process interactions on timeshared systems we relax the ordering requirement to consider events occurring within a certain temporal distance to be parallel events. The temporal distance is referred to as a folding window.
2.2.3 Window Slicing
Our task now becomes finding frequent parallel
episodes – frequently occurring sets of temporally
proximal events. Unfortunately, representing a list of all groups of parallel events with a folding window size w for a sequence with N items leads to a growth of data O(w*N). Although this growth is constant, the constant will be significant for typical window sizes. For the w values used in our experiments, storing every parallel event window would require several hundred to several thousand times more storage than the original trace representation and result in increased processing overhead. To avoid expanding our dataset we adopt a technique called window slicing.
Window slicing is introduced in [13] as an effective technique to perform sequence mining of an extended sequence. Window slicing converts an extended sequence into a sequence database, a collection of relatively shorter sequences. The non-overlapping version of window slicing technique divides time-series data using a window period. Events that take place in the same window are treated as a single sequence record in the event database. We adapt this form of window slicing to our data while simultaneously performing event folding using the same period. This slice-and-fold step gives us an unordered database of parallel events.
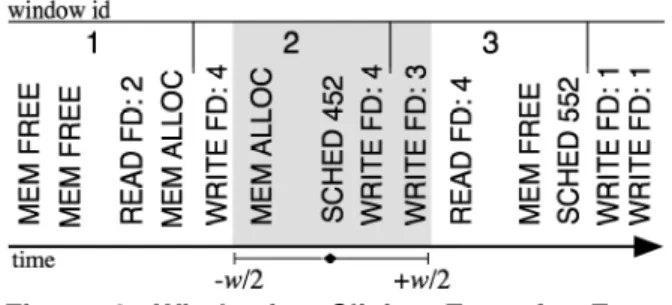
Without loss of generality, we consider LTT logs where timestamps are recorded as the number of microseconds elapsed since the UNIX epoch. We define a parameter w, the fold-slice-window period in microseconds. Using w we calculate a window ID for each log entry, Lx, using the formula:
Figure 3. Windowing Slicing Error for Event SCHED 452
Any two log entries that share a window ID are treated as parallel events. The window ID serves as an itemset ID for our frequent itemset mining.
Clearly, for a window of size w, some event sequences of size w will not be included in our sequence database using this window slicing method (Figure 3). However by using a window long enough to capture frequent patterns at least once in each window, we minimize the disruptive effects of window slicing on our data. Our tools detected problem patterns while using the window slicing technique. Our experimentation confirms previous work in [13] that shows window slicing will not adversely affect the result quality of our mining for sufficiently large windows.
2.2.4 Frequent Itemset Mining
By combining the window folding and window slicing methods, we can treat the parallel events as unordered and so our task of mining trace data has been reduced to frequent itemset mining.
Specifically we look for maximal frequent itemsets, the elements of which comprise common maximal execution patterns in the original trace. We use maximal frequent itemset mining (MFI) in favor of frequent closed itemset mining (FCI) and frequent itemset (FI) mining because the volume of MFI output is much lower that that produced by FCI and FI mines. This is important because we want our output to be human-readable. Furthermore frequent closed itemset mining introduces noise into our results because slightly differing supports for items in a maximal frequent itemset, which exists as a result of window-slicing and scheduling, cause multiple frequent closed itemsets to be reported – none of which provide any more insight than the single maximal frequent itemset.
2.3 Attribute-Based Data Filtering
Algorithms will deliver cleaner results more quickly if steps are taken to eliminate noise in input. To this end, we deploy a simple data filtering technique to reduce data. Data filtering essentially applies a projection of the input sequence data on the specified attribute values. We deploy a pass-through filter that
discards records that do no match any rule in a user specified list. Our rules are a series of formatted strings adhering to our attribute format
proc-subsystem-call-descriptor-size. We allow wildcard matching for an
attribute with the asterisk character. For example, the rule *,MEM,*,*,* allows any call to the memory subsystem to pass into the dataset we use for mining. In our own experimentation, detailed in Section 4.5, attribute filtering helps yield more readable results.
3. System Implementation
Using our framework as a guide, we implement a system for kernel trace mining. Our system includes a series of tools in C++ and perl that transform time-series LTT and dTrace output into a time-series of integers for frequent itemset mining. For maximal frequent itemset mining we adopt MAFIA [1], a highly efficient algorithm for outputting maximal frequent patterns. Our preprocessing tools work together to perform the following tasks in the listed order: resolve operating system descriptors to file and executable names (Section 3.2), create uniform dictionaries for attribute representation (Sections 3.1 and 3.2), and filter data (Sections 2.3.2).
The user is required to provide parameters for a period for window folding and slicing, optional attribute data filters that will be applied before mining, and minimum support for MAFIA’s frequent itemset mining,
3.1 Bitpacking
An important preprocessing step in our system is to convert our series of log entries into a collection of integers, with each integer representing one system call. Mining applications typically support data in integer format and are optimized for this format. Converting kernel trace data to this representation allows for easy testing of mining algorithms on kernel trace data.
We allocate subfields of an integer to store the value of each attribute in our data set. Four dictionaries are created for storing a string-value pair for the process, subsystem, event, and resource descriptor attributes. The dictionary ID for each attribute of a record is stored in a region of our integer representation. Because we want to represent the entire record using a 32-bit value and the size attribute of our record is itself a 32-bit value, some form of lossy data reduction is necessary for this attribute.
We would like attribute values that carry similar meaning in the initial dataset to have identical representation in the data that we mine. Two reads of 3 and 4 bytes would both be considered small, whereas two reads of 2 Mbtyes and 3Mbytes would both be
considered large. For each log record Lx, we store log8
Lx.size in our integer representation. This allows us to
store an approximation for each size value in far fewer bits than the native representation. It also gives many similarly sized attributes the same representation in our data.
3.2 Kernel-trace specific preprocessing
For each reference to a file, program, or hardware resource in our log, we want to use the same representation in our dataset. On any system a program, file, or hardware resource can be referenced by multiple IDs. On a multi-user system or server there may be dozens of instances of the same program running; each one will always have a unique process ID. Numerous processes may write to the same output device, each one referring to the device by a different file descriptor. Kernel tracing tools typically report file and process activity by file descriptor or process ID, not the path or executable name.
For each reference to a file, program, or hardware resource in our log, we want to provide an identical representation to our mining tools. We accomplish this by using the process-ID-to-executable mapping available in the /proc file system when the trace begins. Because the operating system recycles process IDs, we update this mapping whenever a program is executed. We use a similar approach for resolving file descriptors to filenames, but do not have information about file descriptors already open at the start of a trace.
4. Experimentation
We performed a set of experiments evaluating the feasibility, effectiveness and cost of our proposed framework. Our goal is to answer the following important questions: 1) Can kernel trace mining help system users in system-related tasks such as performance tuning and systems debugging? 2) How do different algorithmic components and parameters in our framework affect the mining results? 3) What is the performance overhead of the mining system?
In this section, we present two real-world case studies. In the first study, we use the kernel trace mining framework to effectively detect a known problem program, the GNOME applet gtik. We briefly describe the problem and our experiment setup for the GNOME applet, present the mining results, illustrate the effects of different algorithmic components and parameters of the mining framework, and finally discuss the performance overhead of the system. In the second study, we use our tools to isolate a poorly performing server application on a Solaris system. Using our framework implemented with Solaris and
dTrace largely paralleled our experience under LINUX and LTT.
4.1
Problem
Scenario
and
Previous
Approaches for isolating
gtik
The GNOME stock ticker applet gtik version 2.0 is a process now known to induce systemic problems because of the number of high-impact X programming calls. However, identifying this process as a heavy consumer of system resources presents a challenge.
Because much of the work being created by the gtik
applet takes place inside the X server, detecting the applet as the source of system overhead using traditional tools such as top is impossible. A recent study [2] used dTrace to identify the applet on a multi-processor Solaris system. The study used the output of
mpstat, a tool for monitoring processor activity, as a starting point for writing a series of dScripts. dScripts provide control and analysis functionality for Solaris’ dTrace kernel tracing mechanism. In all, five ad-hoc dScripts were necessary to trace the suspicious activity reported by mpstat back to gtik. These scripts required not only knowledge of X programming calls, but also implementation knowledge of an X server. Furthermore this solution using dTrace and custom dScripts was only possible because of the clues provided at the onset by mpstat’s cross call report, a feature that is not available on single processor machines.
Given this problem scenario, we study how the proposed kernel trace mining system can help in detecting the problematic process through pattern discovery in kernel traces.
4.2 Experiment Setup
Using the LINUX Trace Toolkit we collected traces of kernel level activity, including system calls. We mined the traces collected using our suite of data preprocessing tools and maximal frequent itemset mining. We then examined the output of this mining to look for meaningful patterns of activity.
We collected four 1 minute traces from a machine running version 2.5.7 of the Linux Kernel, patched with version 0.9.5 of the Linux Trace Toolkit, and running the version 2.8.3 of the Gnome Desktop. The computer was equipped with sufficient RAM to ensure no swapping would affect application performance during our traces.
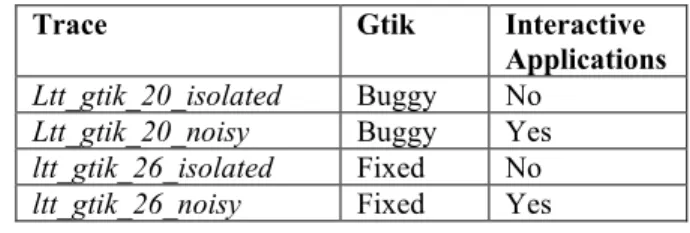
Table 2 summarizes the characteristics of the four traces. Two traces were conducted while the gtik
applet version 2.0, the version known to induce systemic problems, was running: The first trace,
ltt_gtik_20_isolated, contained one minute of trace
Trace Gtik Interactive Applications
Ltt_gtik_20_isolated Buggy No
Ltt_gtik_20_noisy Buggy Yes
ltt_gtik_26_isolated Fixed No
ltt_gtik_26_noisy Fixed Yes
Table 2. Experiment Traces
user activity. The second trace, ltt_gtik_20_noisy, was conducted while a user surfed the web using FireFox and edited a document in OpenOffice. The next two traces, ltt_gtik_26_isolated and ltt_gtik_26_noisy, were collected under similar circumstances, but with an improved version of the gtik applet running. Version 2.6 reduced the number of high-impact X programming calls, but the program still communicated with the X server very frequently – a phenomenon we saw in our mining results.
4.3 Mining Results
We first present a set of results showing clear patterns that can be used to identify the problematic
gtik process. Because we were aware that the symptoms pointing to the systemic problem with gtik
trace applet would be observable through calls in the operating system's file system and memory sub-
Experimental Configuration
input: ltt_gtik_20_noisy
fold-slice-window period: 25,000 (micro. sec.)
minimum support: .5 filters: *,FS,OPEN,*,* *,FS,CLOSE,*,* *,FS,READ,*,* *,FS,WRITE,*,* *,SCHED,*,*,* *,MEM,*,*,* Output itemset 1: XFree86, FS, WRITE XFree86, FS, READ XFree86, MEM, FREE Xfree86, MEM, ALLOC itemset 2:
gtik2_applet_2, MEM, ALLOC gtik2_applet_2, MEM, FREE gtik2_applet_2, FS, WRITE XFree86, FS, READ XFree86, MEM, FREE XFree86, MEM, ALLOC
Figure 4. Experimentation Input/Output
systems, we began our mining efforts by filtering to allow only calls to those subsystems.
The frequent itemset, along with the experimental configuration, is listed in Figure 4. Frequent itemset 2 directly points to the systemic problem on the trace machine. The pairing of gtik’s writes and XFree86’s reads, and the two processes’ complementary allocs and frees of memory suggest that gtik is responsible for much of the XFree86’s work. The first frequent itemset in our sample result reveals no non-obvious information – we expect the XFree86 server, which is responsible for all graphic display on the system, will be making almost constant system calls. The output produced by our mining system for this trace was exceptionally clear. It consisted of only 2 frequent itemsets, one which pointed directly to the systemic problem, and no noise generated by other programs running on the system.
We also conducted experiments across all attributes with no data filtering which is discussed later in Section 4.5. In each of our traces we were able to detect frequent itemsets pointing to the gtik and X server interaction. Even with an interactive load that consumed 40 percent of CPU load, meaning the presence of considerable noise for our data mining algorithm to contend with, the gtik and X11 interaction was clearly visible in our output.
4.4 Parameter Effects on Mining Quality:
Fold-slice-window and
MinSup
To test the durability of our system we also performed an extensive set of experiments over a range of data filtering and mining parameters. We investigated the effects of two important mining parameters, fold-slice-window and minsup. We detail results for the ltt_gtik_20_noisey trace in this section because it contains the noisiest data and accordingly presents the greatest challenge to our mining system. To further test the system’s ability to eliminate noise from results we conducted these experiments across all attributes with no data filtering (see Section 4.5). We conducted each of our experiments using fold-slice-window periods varying from 10,000 microseconds to 1 second at discrete intervals. At each of these intervals we looked for maximal frequent itemsets with minimum supports between .1 and .9. We report 4 possible outcomes for each of these experiments: Present in single itemset – only 1 frequent itemset was reported and it contained the problematic interaction, Present in multiple itemsets – the pattern was detected in at least one frequent itemset reported and no itemset contained events generated by processes other than gtik or XFree86, Present with
Figure 5. Variations in Mine Quality
also contained noise from processes not involved in the systemic problem, Not present – the problematic inter-process pattern was not reported in any itemset.
Figure 5 presents the mining outcomes with varying fold-slice-window periods and minimum supports. For all windows ranging from 25,000 micro-seconds to 250,000 micro micro-seconds we could detect the problematic inter-process interaction. We found that the minimum support parameter played a significant role in determining the quality of a result where the signal was strong. Where the fold-slice-window period was long – and the problem interaction between gtik
and XFree86 was nearly guaranteed to be reported in
every window – the high minimum support value effectively pruned noise from other processes out of the output itemsets. At the opposite end of the spectrum, where the problem interaction was present in only a few of the short windows, a high minimum support value pruned away the interaction from the results.
Manual inspection of our output revealed that poor mining outcomes (such as Not Present and Present
with Interference) generally exhibited one of two
properties: no inter-attribute patterns or uninteresting (noisy) inter-attribute patterns, while a desired mining outcome exhibited interesting inter-attribute patterns. We discuss below each type of the outcome results.
No inter-attribute patterns – for mines with short windows we never saw inter-process itemsets in the output. This makes sense since our windows were not likely to span across multiple processes’ execution timeslices. For these windows we received what amounted to a list of the most-frequent calls on the system – something we could have accomplished with aggregation functionality. Our hope of finding interesting inter-attribute patterns for these windows remained low. For longer windows noise from processes (not interesting to us) made for excessively long and inconclusive itemsets.
Uninteresting (noisy) inter-attribute patterns – as
window size increased it became impossible to tell which processes were interacting. Events that were not of significance began to make their way into our results
Figure 6: Result Quality as a Function of Parameter Values
as the fold-slice-window period began to span multiple timeslices for each process, increasing the likelihood of processes generating noise in our output.
Interesting inter-attribute patterns -- for
sufficiently high minimum supports and large enough windows we could see interesting inter-process interactions clearly in a few, reasonably short itemsets. Using parameters from this range gives the user the best opportunity to get easily interpretable, meaningful output from the system. Figure 6 presents a representative sketch of desired outcomes versus poor outcomes with varying parameter values.
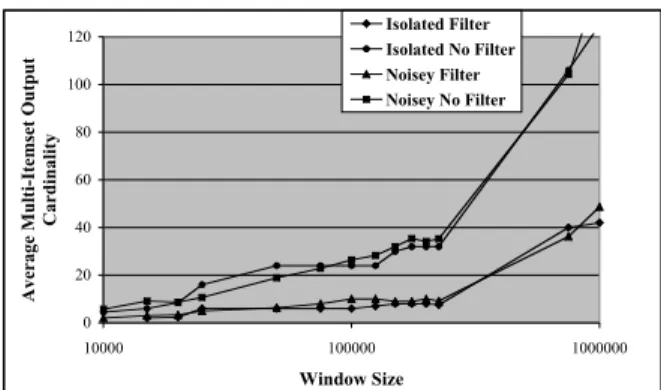
4.5 Effects of Attribute Filtering
Because itemset length plays a key role in determining algorithm selection and performance, we pay special attention to the average cardinality of our input itemsets. We also pay special attention to the average cardinality of frequent itemsets found by the system, since smaller itemsets are much easier for the user to interpret. Both of these measures are significantly affected by our data filtering parameters. We treat each window as a set of unordered tuples and therefore it is necessary to report only one instance of each kernel event found in any window to our mining algorithm. Longer fold-slice-window periods mean fewer windows appear in our dataset and more kernel events will appear in each window. It also means that there is an increased likelihood of duplicate events in each window. Performing data filtering limits the range of domain cardinality for each attribute – effectively imposing an upper bound on the number of possible distinct events in any one window. As the
0 100 200 300 400 500 600 700 800 900 1000 10000 100000 1000000 Window Size
Average Cardinality of Input Itemsets
Isolated Filter Isolated No Filter Noisey Filter Noisey No Filter
Figure 7. Attribute Filtering Effects Input
Itemset Cardinality
window size increases, the average cardinality of our windows approaches this upper bound.
We studied the effects of a filter allowing only memory events, scheduler events, along with read, write, open, and close calls as versus mining across all attributes without filtering. We tested the filter along window sizes ranging from 10,000 to 1,000,000 microseconds. Figure 7 and Figure 8 show the effects of attribute filtering on input itemset cardinality and output itemsets cardinality respectively. Whereas attribute selection played a significant role reducing the cardinality of input itemset, it did not play as significant a role determining the cardinality of our output itemset. The mining algorithm’s removal of infrequent items from our data curbed the cardinality growth of the output as the window size increased.
In conclusion, data filtering does make for more readable output, but the user can get meaningful results without the filtering. This is especially important for users investigating unknown problems, where appropriate filters may not be known.
4.6
SuspectServer
Case Study
In our second case study, we replicated the functionality of a server that performed poorly in certain deployment environments. Specifically, if bash
was not configured as the default shell, the server would exec a shell script (that contained yet another exec) for each connection the server brokered. The performance problem clearly escaped the developer – who probably wrote the script while using the bash shell. It also escaped the system administrator, who had trouble detecting the bug because the server invoked short-lived executables that went undetected by traditional system administration tools. Eventually the system administrator resorted to manual kernel tracing.
We implemented a program called SuspectServer
that simulated the regular shell script executions of the actual server. Our implementation, when running,
0 20 40 60 80 100 120 10000 100000 1000000 Window Size
Average Multi-Itemset Output
Cardinality
Isolated Filter Isolated No Filter Noisey Filter Noisey No Filter
Figure 8. Attribute Filtering Effects on Output
Itemset Cardinality
incurred a .23 CPU load on a 1.2 Ghz dual-processor UltraSparc with 2GB of RAM. Even while overall load remained heavy, at no point did top report a load above .5 percent (a CPU load of .005) for our SuspectServer.
The short-lived scripts also escaped detection in top. We implemented a tracing package in dTrace that recorded information similar to that collected by LTT.
Using our data mining tools we were able to identify the system calls that directly illustrated the recurring fork and execute problems. The calls, illustrated in Figure 9, were inside an 80-item frequent itemset.
The telltale calls did not form an exclusive frequent itemset as they did in some mining results in our gtik
case study. However the benefit that comes from our mining is substantial. Looking through a few frequent itemsets, each with cardinality less than 100, is far easier than scanning the log from which they were derived – a 73K item log, collected over 11 seconds while SuspectServer was running.
4.7 Performance Evaluation and Practical
Impact
Finally, we discuss the performance of our mining system. Our preprocessing tools performed reasonably well to be considered for actual use. Using very coarse grained monitoring we observed that running each mining task from the window-slicing step to the output took an average of 20 seconds on a 2 Ghz. processor. This number is from our noisiest trace with no data filtering. Furthermore, our tools stand to benefit from numerous optimizations – both algorithmic and those possible through more efficient IO programming.
Our first preprocessing step, resolving operating system IDs, takes minutes to complete. This step only needs to be performed once for each trace – so multiple experiments (with different fold-slice-window, minimum support, and data filtering parameters) can be performed more quickly. Each experiment beyond the first typically takes well under a minute to
0,SuspectServer,SYS,exece,/bin/sh,8 0,hostname,SYS,exece,/bin/uname,8
0,sh,FS,CLOSE,/platform/SUNW-Sun-Blade-2500/lib/libc_psr.so.1,8 0,sh,FS,OPEN,/platform/SUNW-Sun-Blade-2500/lib/libc_psr.so.1,8
Figure 9: MSKD Output for window= 411,000,000ns minsup=.9 – abbreviated
complete. Furthermore, if our tools were more tightly coupled with the tracing module, this preprocessing step could be eliminated.
The performance of the actual mining step, where we used MAFIA to perform our maximal frequent itemset mining, was especially promising. Every mining of a 60-second LTT trace took less than 1 second to complete.
Furthermore, mining our dTrace log files collected under Solaris was very efficient. We tested our framework with 100 different window sizes, across 5 levels of varying support. Average mining time was less than 2 seconds per mine on a 2.0 Ghz. PowerPC. In their present state, our tools need to perform 10 to 50 mines to find optimal results; this takes at most a two minutes.
The efficiency of MAFIA for mining maximal frequent itemsets and the straightforward improvements possible in our implemented data processing tools mean that this system, as described, is feasible for actual use.
5. Related Work
Pattern mining in time series data has been an emerging technique applied for a variety of applications [5, 19]. We briefly review in this section the most relevant works that apply data mining for operating systems.
In developing a kernel-wide data-mining system, we consider research outcomes for systems targeting each of an operating system’s constituent subsystems. Research has been conducted to develop better data pre-fetching at the disk and network level [3, 4]. [3] exploited an existing sequence mining algorithm for data placement optimizations. As systems become increasingly distributed and complex, mining will play an increasingly important role in evaluation and optimization. Already, traditional file-system benchmarking applications are inadequate for meaningful performance evaluation in large-scale storage area networks (SANs) [16, 18]. The tools we developed for mining kernel trace data could be adapted to analyze multiple time-sequence logs from different components of a SAN or other distributed system.
Tracking operating system activity for intrusion detection is a mature area of research [7, 8, 10, 12]. This work usually focuses on tracking individual users and processes. Mining-based approaches for system security are emerging as responsive and resilient strategies for system security [10, 11]. Mining techniques have also been successfully used for profiling and detecting mal-ware [17, 6], and for detecting operating system bugs introduced by copying and pasting of kernel source code [14]. In particular, [14] outlines a data mining approach for quality assurance during software development. Such an approach would pair well with our data mining framework when used by developers.
Our work differs from above in that it is the first general-purpose solution that allows for mining for patterns across multiple subsystems in kernel traces to detect systemic problems.
Finally, directly related to the performance of our system is work related to maximal frequent itemset mining [1] and sequence mining [21, 15]. For future adaptations of our systems, stream mining of frequent itemsets is a key area of interest [9].
6. Conclusion and Future Work
We developed a framework for mining kernel trace data. We translate the task of mining kernel trace data into frequent itemset mining. We experimentally show that our system detects excessive inter-process communication and short-lived process interaction on real systems. Our system detects these patterns for a range of parameters and in noisy data. The preprocessing and data filtering techniques we develop allow users to define flexible attribute filters, which help to deliver cleaner, more readable results. Furthermore, our mining system detects problem inter-processes interactions through a single analysis step – something that is impossible using existing system analysis tools.
Our research continues along several directions. While our experimental results gave guidelines in selecting parameters for yielding the most interesting patterns, we are exploring the idea of learning and building a library of normal execution (house keeping) patterns on a normal running system. These patterns would be used for filtering mining results to generate
less-noisy, interesting patterns. In addition, tighter coupling between our tools and the kernel’s tracing facilities would improve performance and make for a more seamless user experience. Closer integration also would eliminate the need for much of the post-processing we perform on kernel trace logs after trace collection, before mining. Finally, tighter integration with the operating system would make real-time, stream-based analysis of a system possible.
8. References
[1] D. Burdick, M. Calimlim and J. Gehrke. MAFIA: A Maximal Frequent Itemset Algorithm for Transactional Databases. IEEE Transactions on Knowledge and Data Engineering, 1490-1504. Vol 17. Issue 11, Nov. 2005. [2] B. M. Cantrill, M. W. Shapiro, and A. H. Leventhal. Dynamic instrumentation of production systems. In Proc. of the USENIX Annual Technical Conference, pp, 15-28, 2004. [3] P. Cao, E. Felten, A. Karlin, and K. Li. A Study of Integrated Prefetching and Caching Strategies. In Proceedings of the 1995 ACM SIGMETRICS, pp 171-182,1995.
[4] J. Griffioen and R. Appleton. Reducing File System Latency Using a Predictive Approach. IN Proc. of the 15th
IEEE Symposium on Mass Storage Systems, 1998.
[5] J. Han and M. Kamber. Data Mining: Concepts and Technqiues, 2nd ed.. Morgan Kaufmann Publisers, ISBN
1-55860-901-6, 2006.
[6] J. Z. Kolter and M. A. Maloof. Learning to Detect Malicious Executables in the Wild, In Proc. 10th ACM
SIGKDD International Conference on Knowledge Discovery and Data Mining, 2004
[7] T. Lane and C. E. Brodley. Sequence matching and learning in anomaly detection for computer security. In AAAI Workshop: AI Approaches to Fraud Detection and Risk Management, pp 43 – 49, 1997.
[8] T Lane and C E. Brodie. Temporal sequence learning and data reduction for anomaly detection. In 5th ACM Conference on Computer & Communications Security, pp. 150 -- 158, 1998.
[9] D. Lee and W. Lee. Finding Maximal Frequent Itemsets over Online Data Streams Adaptively. In Proc. of the 5th
ICDM, 2005.
[10] W. Lee, S. J. Stolfo, and P. K. Chan. Learning Patterns from Unix Process Execution Traces for Intrusion Detection.
In AAAI Workshop: AI Approaches to Fraud Detection and Risk Management, pp 50 – 56, 1997.
[11] W. Lee, S. J. Stolfo, and K. W. Mok. A Data Mining Framework for Building Intrusion Detection Models. In Proc. of the 1999 IEEE Symposium on Security and Privacy, 1999.
[12] W. Lee, S. J. Stolfo, and K. W. Mok. Artificial Intelligence Review, Kluwer Academic Publishers, 14(6):533-567, 2000
[13] Z. Li, Z. Chen, S. M. Srinivasan, and Y. Zhou. C-Miner: Mining Block Correlations in Storage Systems. In Proceedings of the 3rd USENIX Conference on File and
Storage Technologies (FAST), pp. 173--186, 2004.
[14] Z. Lie, S. Lu, S. Myagmar, and Y Zhou. CP-Miner: A tool for Finding Copy-paste and Related Bugs in Operating System Code. IN Proceedings of the 6th USENIX Symposium
on Operating Systems Design and Implementation, pp 289-302. 2004.
[15] J. Pei, J. Han, B. Mortazavi-Asl, H. Pinto, Q. Chen, U. Dayal and M-C. Hsu. PrefixSpan: Mining Sequential Patterns Efficiently by PrefixProjected Pattern Growth. In. Proc. 2001 Int. Conf. Data Engineering (ICDE'01), pp. 215-224, 2001. [16] Thomas M. Ruwart. File System Performance Benchmarks, Then, Now, and Tomorrow. In 18th IEEE Symposium on Mass Storage Systems, 2001.
[17] M. Schultz, E. Eskin, E. Zadok, S. Stolfo, Data mining methods for detection of new malicious executables, in: Proc. IEEE Symposium on Security and Privacy, 2001, pp. 178--184.
[18] E. Thereska, B. Salmon, J. Strunk, M. Wachs, M. Abd-El-Malek, J. Lopez, and G. R. Ganger. Stardust: Tracking activity in a distributed storage system. In ACM SIGMETRICS Conference on Measurement and Modeling of Computer Systems, 2006.
[19] W. Wang and J. Yang. Mining Sequential Patterns from Large Data Sets. Series: The Kluwer International Series on Advances in Database Systems, Vol. 28. ISBN: 0-387-24246-5, 2005
[20] K. Yaghmour and M. R. Dagenais. Measuring and Characterizing System Behavior Using Kernel-Level Event Logging. In Proc. of the 2000 USENIX Annual Technical Conference, 2000.
[21] X. Yan, J. Han, and R. Afshar. CloSpan: Mining Closed Sequential Patterns in Large Datasets, In Proc. 2003 SIAM Int. Conf. Data Mining (SDM'03), 2003.