e-Journal of English Language Teaching Society (ELTS) Vol. 4 No. 1 2016 – ISSN 2331-1841 Page 1
THE EFFECTIVENESS OF TASK BASED
LEARNING IN TEACHING SPEAKING
SKILL TO THE ELEVENTH GRADE
PutriWulandari1, Jos. E. Ohoiwutun2, Abd.Kamarudin.3
Abstract
The research aimed at proving that the use of Task Based Learning (TBL) method is effective in teaching speaking skill to the eleventh grade students of MAN 2 Model Palu. The population of this research was the eleventh grade students of MAN 2 Model Palu. It was selected by using purposive sampling technique. The sample was XI IPS 1 as the experimental group and XI IPS 2 as the control group. The researcher used intact group design, just using post-test to both groups. There are two variables, teaching English speaking by usingTBL method as the independent variable, and English speaking achievement as the dependent variable. The result of the research shows that there is a significant improvement of the students who were taught by using TBL method than thoseby using conventional teaching. It is shown from the average scores between the experimental and the control group. After applying the treatment, the average post-test score of experimental group was 59.02 and the control group was 47. We can conclude that TBL is effective in teaching speaking skill.
Keywords: The effectiveness; Task Based Learning; Speaking skill.
INTRODUCTION
Speaking is important in learning a foreign language. The students should be able to communicate by using their own ideas and feelings orally. They can express themselves and learn how to use the language very well. Byrne (1976:8) states, “The oral communication is two ways process between speaker and listener involving productive skill of speaking the receptive skill of understanding or listening”. In speaking, they can express ideas, opinions, attitudes and feelings spontaneously. The students are supposed to learn English and to interact with other people. Secondary school students have learned English from junior high school to senior high school. It means that they have learned English for six years. They have enough time to achieve English proficiency.
1
e-Journal of English Language Teaching Society (ELTS) Vol. 4 No. 1 2016 – ISSN 2331-1841 Page 2
Teaching speaking is not easy. According to Hornby (1995:37),“Teaching means
giving the instruction to a person give a person knowledge skill”. It means that teaching speaking is giving instruction from a person to another person in order to communicate.
In teaching speaking skill, the researcher applied TBL to her students. The teacher of MAN 2 Model Palu said, “The ability of the students in speaking is still low and the students rarely practice”. Besides, most students feel less confident when they speak orally. They also have desire to speak but they have lack of vocabulary. Thus, the researcher gives an alternative method to make the students active in speaking. It is task based learning.
Task based learning is one of the methods which is used in teaching speaking skill. TBL is divided into several types of activity that can be given to the students. According to Ellis (2003:17), “Task- based learning is a form of teaching that treats language primarily as a tool for communicating rather than as a subject for study or manipulation”. It means
that TBL can develop the students’ competence in order to use a foreign language easily
and effectively in different kinds of situations when they meet outside the classroom. The subject of this research was the eleventh grade students of MAN 2 Model Palu. Considering that problem, the researcher formulated the research question as follows: “Is the use of task based learning method in sharing experience types effective in teaching speaking skill to the eleventh grade students of MAN 2 Model Palu? The objective of this research was to find out whether the use of task based learning is effective in teaching speaking skill to eleventh grade students of Man 2 Model Palu.
METHODOLOGY
In conducting the research, the researcher use dintact group design with one class as an experimental group and one class as a control group. It focused on two groups given by the same test as post-test. In intact group design, the researcher gave treatment to the experimental group while the control group did not. The design of the research
recommended by Hatch and Farhady’s model (1982:21) is as follows :
G1 X T2
G2 T2
Where:
G1 : experimental group X : treatment
e-Journal of English Language Teaching Society (ELTS) Vol. 4 No. 1 2016 – ISSN 2331-1841 Page 3
According to Creswell (2005:145), “Population is a complete set of elements (persons or objects) that possess some common characteristic defined by the sampling criteria established by the researcher”. The population of this research was the eleventh grade students of MAN 2 Model Palu. The number of the students was 132, divided into six classes: XIIIPA 1, XII IPA 2, XII IPS 1, XI IS 2, XII AGAMA 1 and XII AGAMA 2.
Best (1981:8) states, “Sample is a small proportion of population selected for
observation and analysis”. The researcher limits the population in order to conduct the research easily. In taking the sample, the researcher used a purposive sampling technique. In relation to the topic of this research, the dependent variable is speaking skill of the eleventh grade students of MAN 2 Model Palu, while the independent variable is the use of task based learning.
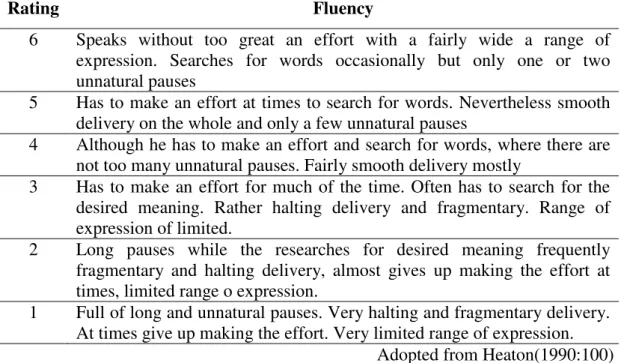
In collecting the data, the researcher used a test as the instrument of the research. The test only consisted of post-test given both the experimental group and the control group. Before doing the post-test to the two groups, the researcher gave the treatment only for experimental group. The researcher counted the raw scores obtained by using the formula by Heaton (1990:100) as follows:
Table 1 Scoring Rubric
Rating Fluency
6 Speaks without too great an effort with a fairly wide a range of expression. Searches for words occasionally but only one or two unnatural pauses
5 Has to make an effort at times to search for words. Nevertheless smooth delivery on the whole and only a few unnatural pauses
4 Although he has to make an effort and search for words, where there are not too many unnatural pauses. Fairly smooth delivery mostly
3 Has to make an effort for much of the time. Often has to search for the desired meaning. Rather halting delivery and fragmentary. Range of expression of limited.
2 Long pauses while the researches for desired meaning frequently fragmentary and halting delivery, almost gives up making the effort at times, limited range o expression.
1 Full of long and unnatural pauses. Very halting and fragmentary delivery. At times give up making the effort. Very limited range of expression.
Adopted from Heaton(1990:100)
The first is to count the individual score. The researcher used the formula by Purwanto (2008) as follows:
e-Journal of English Language Teaching Society (ELTS) Vol. 4 No. 1 2016 – ISSN 2331-1841 Page 4
= 100
Where:
NP = students’ score R = score obtained
SM = maximum score of the test 100 = constant number
Next, the researcher computed the students’ mean score by using the formula proposed by Hatch and Farhady (1982:55) as follows:
=
∑Where:
= mean score
∑ = total of the individual scores
N = total of students
Then, the researcher counted the individual deviation of students’ score of the
experimental group and the control group. The researcher used the formula by Hatch and Farhady (1982:59)as in the following:
= X -
Where:= individual deviation
X = student’s score
= mean score
After that, the researcher squared the standard deviation of students’ score both of groups. The researcher computed it by using the formula by Hatch and Farhady (1982:59).
S
= √∑ Where:s = standard deviation
∑ = sum of individual deviation squared
e-Journal of English Language Teaching Society (ELTS) Vol. 4 No. 1 2016 – ISSN 2331-1841 Page 5
Then, the researcher calculated the standard error first by using the formula which is proposed by Hatch and Farhady (1982:112) in order to find out the value of t-value:
=
√(
√)
2+
(
√)
Where:= standard error of differences between means
= standard deviation of experimental class = standard deviation of control class = total students of experimental class = total students of control class
Finally, the researcher calculated the tvalue by using the formula stated by Hatch and
Farhady (1982:111):
=
( ) Where:
= significant result between experimental and control class
= mean score of experimental group = mean score of control group
( ) = standard error of differences between means FINDINGS
In presenting the data, the researcher only focuses on fluency. The data are taken from the post-test of the experimental and control groups. Meanwhile, the treatment was applied only for the experimental group. However, the researcher conducted the test to both groups. The post-test was administrate in order to prove whether or not the use of task based learning can give contribution in teaching English to the students. The result of the post-test is presented Table 2 and 3.
e-Journal of English Language Teaching Society (ELTS) Vol. 4 No. 1 2016 – ISSN 2331-1841 Page 6
Table 2
Students’ Score on Post-test of the Experimental Group
No Initials Total Score Students’ Score Max. Score
1 AKH 4 80 100 2 AAP 3 60 100 3 Af 3 60 100 4 AAA 3 40 100 5 AS 3 60 100 6 AL 4 80 100 7 AF 3 60 100 8 BPAM 4 80 100 9 FH 4 80 100 10 MR 3 60 100 11 IH 3 60 100 12 MR 4 80 100 13 MAA 2 40 100 14 MRA 3 60 100 15 MRAL 2 40 100 16 NK 3 60 100 17 NAL 4 80 100 18 RA 3 60 100 19 SN 3 60 100 20 WY 4 80 100 21 YB 2 60 100 Total 64 1240
The post-test result of the experimental group shown in the table above indicates that the highest score is 80 and the lowest score is40.In order to find out the mean score, the total of the individual scores is divided by the number of the students which can be seen as follows:
=
∑=
e-Journal of English Language Teaching Society (ELTS) Vol. 4 No. 1 2016 – ISSN 2331-1841 Page 7
Table 3
Students’ Score on Post-test of the Control Group No Initials Total
Score
Students’
Score Max. Score
1 ADR 1 20 100 2 DF 2 40 100 3 DS 2 40 100 4 DK 2 40 100 5 FF 2 40 100 6 GAR 1 20 100 7 H 3 60 100 8 IK 1 20 100 9 MYM 2 40 100 10 MFH 3 60 100 11 MF 4 80 100 12 MR 3 60 100 13 MFK 2 40 100 14 MFD 2 40 100 15 MUL 2 40 100 16 NR 2 40 100 17 NH 2 40 100 18 SW 2 40 100 19 TD 1 20 100 20 TAD 2 40 100 100 Total 43 940
After calculating the post-test score of the control group, the researcher computed
the students’ mean score. The mean computation is presented as follows:
=
∑=
= 47
The mean score of the experimental group is59.04 while the control group is47. It shows that the progress of the students are achieved. The researcher computed the
deviation and square deviation of the students’ scores of the post-test. The result is presented in the following table:
e-Journal of English Language Teaching Society (ELTS) Vol. 4 No. 1 2016 – ISSN 2331-1841 Page 8
Table 4
Deviation Post-test of the Experimental group
No Initials
Post-test
Mean
Score Deviation Square Deviation
(Xx) (X) (Xy) (x2) 1 AKH 80 59.04 20.96 439.32 2 AAP 60 59.04 0.96 0.92 3 AF 40 59.04 19.04 362.52 4 AAA 60 59.04 0.96 0.92 5 AS 60 59.04 0.96 0.92 6 AL 80 59.04 20.96 439.32 7 AFA 60 59.04 0.96 0.92 8 BAPM 80 59.04 20.96 439.32 9 FH 80 59.04 20.96 439.32 10 MR 60 59.04 0.96 0.92 11 IH 80 59.04 20.96 349.32 12 MR 60 59.04 0.96 0.92 13 MAA 40 59.04 19.04 326.52 14 MRA 40 59.04 19.04 326.52 15 MRAL 40 59.04 19.04 326.52 16 NK 60 59.04 0.96 0.92 17 NAL 60 59.04 0.96 0.92 18 RA 60 40 60 40 59.04 0.96 0.92 19 SN 59.04 19.04 326.52 20 WY 59.04 0.96 0.92 21 YB 59.04 19.04 326.52 Total 4110.92
After computing the mean deviation of post-test of the experimentalgroup, the researcher calculated the deviation score of post-test of the experimental group. It is presented as in the following :
S =
√
∑=
√
=
√
=
√
= 14.33
e-Journal of English Language Teaching Society (ELTS) Vol. 4 No. 1 2016 – ISSN 2331-1841 Page 9
Table 5
Deviation Post-test of the Control Group
No Initials Post-test Mean Score Deviation Square Deviation (Xx) (X) (Xy) (x2) 1 ADR 40 47 7 49 2 DF 40 47 7 49 3 DS 40 47 7 49 4 DK 40 47 7 49 5 FF 60 47 13 169 6 GAR 60 47 13 169 7 HAN 60 47 13 169 8 IK 80 47 33 1089 9 MYM 40 47 7 49 10 MFH 40 47 7 49 11 MF 60 47 13 169 12 MR 80 47 33 1089 13 MFK 40 47 7 49 14 MFD 40 47 7 49 15 MUL 40 47 7 49 16 NR 40 47 7 49 17 NH 40 47 7 49 18 SW 40 47 7 49 19 TD 40 47 7 49 20 TAD 40 47 7 49 Total 3540
After computing the mean deviation of the post-test of the control group, the researcher calculated standard deviation of the post-test of the control group which is presented in the following:
S =
√
∑=
√
=
√
=
√
= 13.64
e-Journal of English Language Teaching Society (ELTS) Vol. 4 No. 1 2016 – ISSN 2331-1841 Page 10
Having counted the deviation both experimental group and control group, the researcher then computed the standard error of difference between means which is presented below:
=
√(
√)
2+
(
√)
=
√(
√)
2+
(
√)
2=
√(
)
2+
(
)
2=
√( )
( )
=
√
=
√
= 4.36
Finally, the researcher needs to analyze the data statistically in order to find out the difference between the result of post-test of the experimental and the control groups. The computation is presented as follows:
= ( ) = = = 2.76 DISCUSSION
In this part, the researcher discusses about the findings of the research. The objective of this research was to find out whether the use of task based learning method
can improve the students’ speaking skill of Grade XI students of MAN2 Model Palu. The researcher focused on fluency. The researcher used two groups recommended by the
e-Journal of English Language Teaching Society (ELTS) Vol. 4 No. 1 2016 – ISSN 2331-1841 Page 11
English teacher of MAN 2 Model Palu because they still have problems in teaching English especially speaking.
In the first meeting, the researcher gave brainstorming to the students related to the material to stimulate to the student’s thinking. The researcher presented the case by using picture or poster to build the student’s inspiration. The students tried to give the opinion by discussing and sharing the answer. The students express their opinion in front of the class.
By doing the treatment, the researcher found potential factor during the treatment to get the student’s improvement. When the researcher presented the case that the students tried to give and share the opinion, the students discussed the answer with their friends, and indirectly tried to practice their speaking skill. Besides, the situation became more enjoyable because the students got motivation to speak and to express their ideas freely in the group work without feeling afraid with their sentences.
After conducting the treatment, the researcher gave post-test to the two groups. The aim of the post-test was to find out the improvement of the students’ speaking skill after the treatment. Based on the result, the researcher found some errors which made by the students. In the experimental group there are 3 students or 14, 28%of the students made errors in fluency, while in the control group there are 5 students or 25%of the students made errors in fluency. By seeing the result of both groups, the use of task based learning
was effective in enhancing students’ fluency of speaking.
Another researcher also proved that the use of TBL is effective in teaching speaking skill. The research was conducted by Hayati (2013). The result of her research revealed that the score of the students increased when implementing TBL. It increased the level of fluency from their result of speaking post-test of the experimental group (79.40)and the control group (59.93). Then the students are active and creative about the text in the classroom.
CONCLUSIONS AND SUGGESTIONS
After applying the treatment and comparing the students’ result before and after the treatment, it is shown that the t-counted (2.76) is greater than the t-table (2.02). It can be
concluded that the use of task based learning method in sharing experience types is effective in teaching speaking skill to the eleventh grade students of MAN 2 Model Palu. In relation to the importance of speaking, then the researcher would like to give some suggestions to the teachers and the readers. Firstly, to all English teachers of Senior High
e-Journal of English Language Teaching Society (ELTS) Vol. 4 No. 1 2016 – ISSN 2331-1841 Page 12
Schools, this research results can be relevant source to improve their daily teaching learning process.
Secondly, the application of task based learning method enriches with more real case studies to make learning become more attractive, creative and innovative in using various kinds of interesting teaching techniques which accompany the materials.
Thirdly, further researchers can apply TBL in other skills such as writing, reading, and listening. Besides, the use of appropriate methods of teachers should also consider other factors so that the students will be fluent speakers.
Finally, for readers who want to use task based learning method, the topic should be related to the issue in the society so that the students can easily express their ideas.
REFERENCES
Best, J.W. (1981). Research in Education (Fourth Edition). New York: Prentice-Hall. Byrne,D. (1976). Teaching oral English. London : Longman.
Creswell, W.(2005). Planning, Conducting and Evaluating Quantitative and Qualitative Research. New York: University of Nebraska.
Ellis, R. (2003). Task-Based Language Learning and Teaching. Oxford: Oxford
University Press.
Hatch, E.&Farhady, H. (1982). Research Design and Statistic for AppliedLinguistics. Los Angeles:New Houry Publisher.
Hayati, N. (2013). The Effectiveness of Task Based Learning Method in Teaching
Students’ Speaking Skill. [Online], 1(1) 60-63.
Retricord:http://repository.upi.edu/view/subjects/ING.html. [16 April 2014]. Heaton, B. (1990). Writing English Language Test. London : Longman.
Hornby, AS. (1995).Oxford Advanced Learner’s Dictionary. Oxford: Oxford University Press.
Purwanto. (2008). Metodologi Penelitian Kuantitatif untuk Psikologi dan Pendidikan. Yogyakarta: Pustaka Belajar.