Essays on Collateralized Debt Obligations and
Credit Default Swaps:
Dynamic Correlation Modeling, Measuring Systematic
Risk, and Cross-sectional Pricing of Common Risks
Von der Wirtschaftswissenschaftlichen Fakultät der
Gottfried Wilhelm Leibniz Universität Hannover
zur Erlangung des akademischen Grades
Doktor der Wirtschaftswissenschaften
Doctor rerum politicarum
-genehmigte Dissertation
von
Dipl.-Kaufmann Sebastian Löhr
geboren am 01.06.1979 in Hildesheim
Referent: Professor Dr. Daniel Rösch
Koreferent: Professor Dr. Alfred Hamerle
Tag der Promotion: 14.05.2013
Abstract
Measuring and anticipating systematic risk in credit markets appropriately are currently the core challenges for many researchers, investors and regula-tory authorities around the world, especially with regard to structured finance products such as collateralized debt obligations (CDO). The development of a comprehensive framework for evaluating the risk characteristics of CDOs due to systematic risk may also allow to identify and to measure pricing impacts of systematic risk on both structured securities and credit default swaps (CDS). In credit markets, CDS contracts represent the most common credit derivatives and they also constitute the collateral in synthetic asset securitizations.
This cumulative thesis confirms the relevance of structured finance products such as asset securitizations in financial markets and provides an analytical framework for obtaining detailed insights into their complex risk characteris-tics due to systematic risk. With regard to systematic influences, this ana-lytical framework allows a closed-form comparison of comparably rated bonds and securitized tranches in terms of their default risk and related losses. The analytical results are backed by several Monte Carlo simulations. Due to the higher exposure to systematic risk, securitized tranches react much more sensi-tive to changes in the macroeconomic climate – as source for systematic risk – than corporate bonds, particularly in economic downturns. Based on the core characteristics of asset securitizations namely pooling and tranching, effects of both risk diversification and risk concentration are examined indicating the product-specific risk profiles. While idiosyncratic risk and sectoral risk may be diversified in securitizations, pooling and tranching also lead to the con-centration of systematic risk. The corresponding effect sizes strongly depend on tranche seniorities. The results also indicate that classical credit ratings are insufficient metrics for measuring the entire risk of structured securities, particularly with respect to high-rated, e.g., AAA-rated, tranches.
Correlations, which usually describe the dependency structures within credit-risky portfolios, are identified as the main drivers for credit portfolio risk and constitute a major element in pricing portfolio credit derivatives such as synthetic single-tranche CDO swaps (STCDO). In the standard single-factor Gaussian copula model for pricing STCDOs, benefits of historical asset cor-relations gained from stock market returns are strongly limited for pricing securitized tranches of the 5-year iTraxx Europe credit index. Two alternative
spread-dependent correlation skew models are proposed to model and to fore-cast implied correlations of iTraxx Europe index tranches from 2005 to 2008. The applied panel regressions show that the proposed dynamic mixed-effects regression correlation model (MERM) reaches highest forecast accuracy by ac-counting for i) random time-specific effects and ii) tranche-specific fixed effects on implied tranche correlations. The model-based forecast accuracy is mea-sured in terms of root mean squared forecast errors. The empirical findings also indicate the presence of a systematic risk factor influencing all spreads of the index tranches simultaneously.
Quoted CDS spreads from 2004 to 2010 of 339 U.S. entities divided across ten economic sectors are used in order to examine whether common risk fac-tors are priced in the cross-section of CDS spreads. By using two-pass regres-sions, the credit market climate, the cross-market correlation and the market volatility are identified as systematic risk factors simultaneously affecting the cross-section of CDS spreads, particularly in times of financial distress and even in the presence of idiosyncratic or firm-specific risk factors such as credit ratings, liquidity and leverage. Since swap contracts not only exhibit differ-ent sensitivities to systematic risk by rating class, but also within each rating class, the need for appropriate systematic risk measures is underlined. The proposed basic set of risk factors explains about 83% of the CDS spreads prior to the global financial crisis and about 90% during the crisis. The applied ap-proach allows to identify contract-specific sensitivities to systematic risk and to calculate related premium payments. It may also facilitate the development of a risk-adjusted valuation framework for CDOs, particularly with respect to systematic risk.
The findings of this thesis are addressed to several interest groups, e.g, other researchers in the field of credit risk or derivatives, investors dealing with securitized tranches or swap contracts, risk managers in banks or in-surance companies engaged in the management of credit risk, and regulatory authorities developing capital rules for risk-adjusted capital requirements of financial institutions.
Keywords:
Zusammenfassung
Die Entwicklung geeigneter Verfahren zur Messung und zur vorausschauen-den Berücksichtigung systematischer Risiken in Kreditmärkten stellt gegenwär-tig weltweit eine der zentralen Herausforderungen von vielen Wissenschaftlern, Investoren und regulatorischen Aufsichtsinstanzen dar. Dies gilt insbesonde-re mit Blick auf strukturierte Produkte wie Collateralized Debt Obligations (CDO). Die Entwicklung eines umfassenden Bewertungsrahmens zur Beurtei-lung der Risikocharakteristika von CDOs hinsichtlich systematischer Risiken kann zudem erste Anhaltspunkte dafür liefern, welchen Bepreisungseinfluss systematische Risiken auf Verbriefungstransaktionen und auf klassische Kre-ditderivate wie Credit Default Swaps (CDS) ausüben. CDS Kontrakte stellen die wesentlichen Kreditderivate auf globalen Kreditmärkten dar und fungieren in synthetischen Verbriefungstransaktionen als Referenzaktiva.
Im Rahmen dieser kumulierten Dissertation wird die Relevanz von Verbrie-fungstransaktionen auf Finanzmärkten bestätigt. Zudem wird ein analytisches Modell vorgestellt, das detaillierte Einblicke in die komplexen Risikocharak-teristika von CDOs liefert, die sich speziell aufgrund systematischer Risiken ergeben. Dieser analytische Modellrahmen liefert ferner einen ‘geschlossenen’ Lösungsansatz, um den Einfluss systematischer Risiken auf produkt-spezifische Ausfallrisiken und damit verbundene Verluste zu quantifizieren. Zusätzliche Monte Carlo Simulationen stützen die erzielten analytischen Ergebnisse. Da verbriefte Tranchen systematischen Risiken in einem höheren Maße ausgesetzt sind, reagieren sie sehr viel sensitiver auf makroökonomische Veränderungen als Unternehmensanleihen mit vergleichbarem Ausgangsrating, insbesondere in wirtschaftlichen Abschwungsphasen. Anzumerken bleibt, dass makroökono-mische Entwicklungen im Allgemeinen als Quelle systematischen Risikos an-gesehen werden. ‘Poolen’ und ‘Tranchieren’ stellen die wesentlichen Prozes-se in Verbriefungstransaktionen dar, durch die sowohl Risikodiversifikations-als auch Risikokonzentrationseffekte erreicht werden. Beide Effekte bestim-men letztlich die Risikoprofile verbriefter Tranchen, wobei die beobachteten Effektstärken von der jeweiligen Tranchenseniorität abhängen. Die erzielten Ergebnisse lassen zudem vermuten, dass klassische Kreditratings unzureichen-de Meßverfahren für das produktbezogene Ausfallrisiko von strukturierten Ver-briefungen darstellen, insbesondere in Bezug auf Tranchen, die ein besonders gutes Rating, bspw. ein AAA-Rating, aufweisen.
Korrelationen, die beispielsweise Abhängigkeitsstrukturen in ausfallrisiko-behafteten Portfolien zum Ausdruck bringen, werden als Haupttreiber für das Kreditportfoliorisiko identifiziert und stellen daher einen wesentlichen Faktor zur Bepreisung von Kreditportfolioderivaten wie synthetischen Einzeltranchen-CDOs (STCDO) dar. Im standard Einfaktormodell mit Gauß-Copula Spezifi-kation liefern historische Asset-Korrelationen, die aus Aktienkursrenditen ab-geleitet werden, nur eingeschränkt brauchbare Bepreisungsinformationen für verbriefte Tranchen des iTraxx Europe Kreditindex mit fünfjähriger Lauf-zeit. Daher werden zwei alternative Korrelationsmodelle zur Bestimmung und Prognose impliziter Korrelationen der untersuchten iTraxx Europe Indextran-chen von 2005 bis 2008 vorgeschlagen, die spread-abhängige Variationen der tranchen-spezifischen impliziten Korrelationen berücksichtigen. Basierend auf den durchgeführten Panelregressionen (Paneldatenanalyse), erreicht das vor-geschlagenen dynamische Regressionsmodell MERM unter Berücksichtigung von zufälligen Zeiteffekten und tranchen-fixen Effekten die höchste Prognose-güte. Dabei wird die modelbezogene Prognosegüte durch die Wurzel aus der mittleren quadratischen Prognoseabweichung ausgedrückt. Die empirischen Er-gebnisse deuten ebenfalls darauf hin, dass ein tranchen-übergreifender – also ‘systematischer’ – Risikofaktor zeitgleich die Risikoprämien aller Indextran-chen beeinflusst.
CDS Prämienquotierungen der Jahre 2004 bis 2010 von 339 U.S. amerikani-schen Unternehmen, die sich über insgesamt zehn Wirtschaftssektoren erstre-cken, werden genutzt, um zu untersuchen, ob schuldnerübergreifende Risiko-faktoren im Querschnitt der vorhandenen CDS Spreads bepreist werden. Auf Basis eines zweistufigen Regressionsverfahrens, werden das allgemeine Kre-ditmarktumfeld, die Kreuzmarktkorrelation und die Marktvolatilität als sys-tematische Risikofaktoren identifiziert, die zeitgleich sämtliche Risikoprämien im Querschnitt der untersuchten Swap Kontrakte beeinflussen, insbesondere in finanzmarktbezogenen Krisenzeiten. Dieser Bepreisungseinfluss systematischer Risikofaktoren bleibt auch dann noch bestehen, wenn für idiosynkratische oder unternehmens-spezifische Risikofaktoren wie Kreditratings, Liquidität und den Verschuldungsgrad kontrolliert wird. Da die Sensitivität der untersuchten CDS Kontrakte gegenüber systematischen Risiken nicht nur kontraktspezifisch vari-iert, sondern auch innerhalb der betrachteten Ratingklassen deutlich schwankt, wird der Bedarf nach geeigneten Meßverfahren für systematische Risiken be-sonders deutlich. In der Zeit vor dem Einsetzen der letzten globalen
Finanz-krise erklären die vorgeschlagenen Risikofaktoren des Basismodells ungefähr 83% der CDS Spreads, während sie im Krisenzeitraum ungefähr 90% der ent-sprechenden Risikoprämien erklären. Insgesamt ermöglicht der implementierte Regressionsansatz zum einen eine Identifikation kontraktspezifischer Sensiti-vitäten hinsichtlich systematischer Risiken und zum anderen die Berechnung entsprechender Risikoprämien. Zudem liefert er erste Erkenntnisse zur Ent-wicklung eines risikoadjustierten Bewertungsrahmens für CDOs, insbesondere mit Blick auf die Berücksichtigung systematischer Risiken.
Die Arbeitsinhalte und -ergebnisse dieser Dissertation richten sich an ver-schiedene Interessengruppen: beispielsweise an andere Wissenschaftler im Kreditrisiko- oder Derivatebereich, an Investoren, die mit strukturierten Ver-briefungen oder CDS-Kontrakten handeln, an Risikomanager in Banken oder Versicherungsgesellschaften, die mit dem Management von Kreditrisken be-traut sind, aber auch an regulatorische Aufsichtsinstanzen, die risikoadjustierte Eigenkapitalvorschriften für Banken entwickeln und festsetzen.
Schlagwörter:
Contents
List of Figures iv
List of Tables vi
1 Introduction 1
1.1 Credit Risk and Structured Finance Securities . . . 1
1.2 Outline and Contributions . . . 6
2 Developments in Structured Finance Markets 10 2.1 Impairments of Asset-backed Securities and Outstanding Ratings 10 2.2 Issuance of Asset-backed Securities and Outstanding Volume . 20 2.3 Global CDO Issuance and Outstanding Volume . . . 22
2.4 Concluding Remarks . . . 35
3 Approaches to Credit Risk for Valuing Structured Finance Securities 37 3.1 Introduction . . . 37
3.2 Approaches for Modeling and Measuring Credit Risk . . . 39
3.2.1 An Introduction to Physical Default Risk and Risk-neutral Valuation . . . 39
3.2.2 Structural Models . . . 42
3.2.3 Intensity Models . . . 44
3.2.4 Factor Models . . . 48
3.3 Portfolio Credit Risk and the Valuation of STCDOs . . . 52
3.3.1 The Single-factor Gaussian Copula Model . . . 52
3.3.2 Modeling Dependency Structures: The Copula Approach 59 3.3.3 Valuing Single-tranche CDO Swaps . . . 64
CONTENTS
4 Dynamic Implied Correlation Modeling and Forecasting in
Structured Finance 72
4.1 Introduction . . . 72
4.2 Correlation Approaches and Dynamic Panel Regression Models . 75 4.2.1 Valuation of Single-tranche CDO Swaps . . . 75
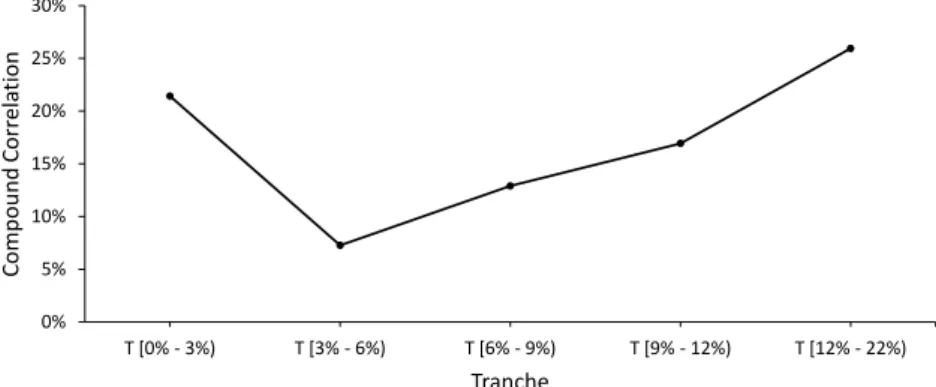
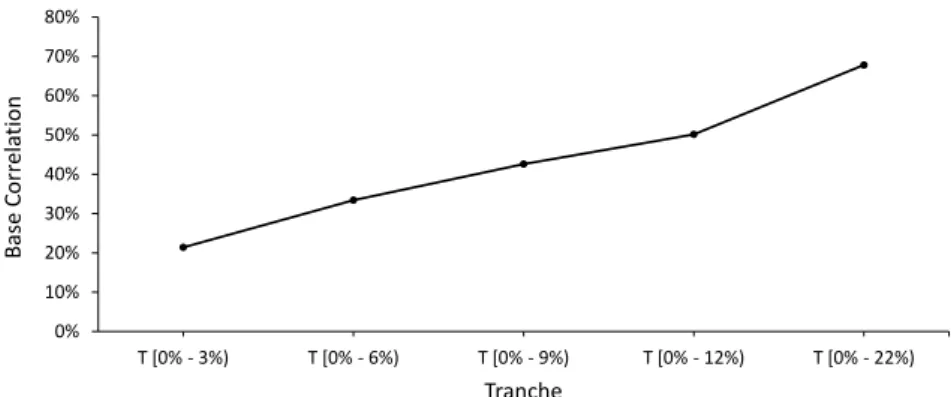
4.2.2 Correlation Approaches: Compound, Base and Asset Correlations . . . 78
4.2.3 Dynamic Panel Regression Approach for Base Correlations 83 4.3 Empirical Analysis . . . 86
4.3.1 Panel Data . . . 86
4.3.2 Analysis of Panel Regressions . . . 89
4.3.3 Results . . . 94
4.4 Summary . . . 103
5 An Analytical Approach for Systematic Risk Sensitivity of Structured Finance Products 105 5.1 Introduction . . . 105
5.2 Risk Measures in the Single-factor Model . . . 107
5.2.1 The Single-factor Model . . . 107
5.2.2 Default Probability of a Tranche . . . 108
5.2.3 Product-specific Expected Losses . . . 110
5.3 Measuring Systematic Risk Sensitivity: The Extended Model . . 111
5.3.1 Introduction of a Super-systematic Factor . . . 111
5.3.2 Conditional Risk Measures of a Bond . . . 112
5.3.3 Conditional Risk Measures of a Tranche . . . 112
5.3.4 Risk-adjusted Attachment and Detachment Points . . . . 113
5.3.5 Product-specific Sensitivity to Systematic Risk . . . 114
5.4 Analysis of Systematic Risk Sensitivity . . . 115
5.4.1 Product-specific Sensitivity of CPDs . . . 115
5.4.2 Product-specific Sensitivity of CELs . . . 120
5.4.3 Product-specific Downside Risk . . . 124
5.4.4 Systematic Risk Sensitivity due to Inter-sectoral Diver-sification . . . 128
CONTENTS
6 Valuation of Systematic Risk in the Cross-section of Credit
Default Swap Spreads 140
6.1 Introduction . . . 140
6.2 Determinants of Credit Default Swap Spreads . . . 144
6.2.1 Theoretical Framework . . . 144
6.2.2 Empirical Data . . . 147
6.3 Empirical Evidence for Pricing Systematic Risk in CDS Spreads 155 6.3.1 Models in the Two-pass Regression Approach . . . 155
6.3.2 Systematic Risk Beyond Ratings . . . 157
6.3.3 Results of Time-series and Cross-section Regressions . . 159
6.3.4 Robustness . . . 165
6.4 Summary . . . 174 7 Conclusion and Suggested Research Outlook 178
A Sensitivity Analysis 183
B Forecast Test Statistics 186
C Proof of Equation (5.15) 189
D Proof of Equations (5.9) and (5.16) 191
E Proof of Equation (5.25) 193
Bibliography 195
List of Figures
2.1 Illustration of the Loss-flow in a Simple Asset Securitization . . 11
2.2 Major Asset-backed Security Classes . . . 14
2.3 Total Impairments of Structured Securities . . . 15
2.4 Impairments of Structured Securities by Sector . . . 16
2.5 Comparison of Outstanding Ratings . . . 17
2.6 Impairments of Asset-backed Securities by Original Rating (in %) 18 2.7 Comparison of ABS and MBS Issuance . . . 21
2.8 The Global CDO and Bond Issuance from 2000 to 2011 . . . 23
2.9 Complexity of Hybrid CDOs: An Example . . . 27
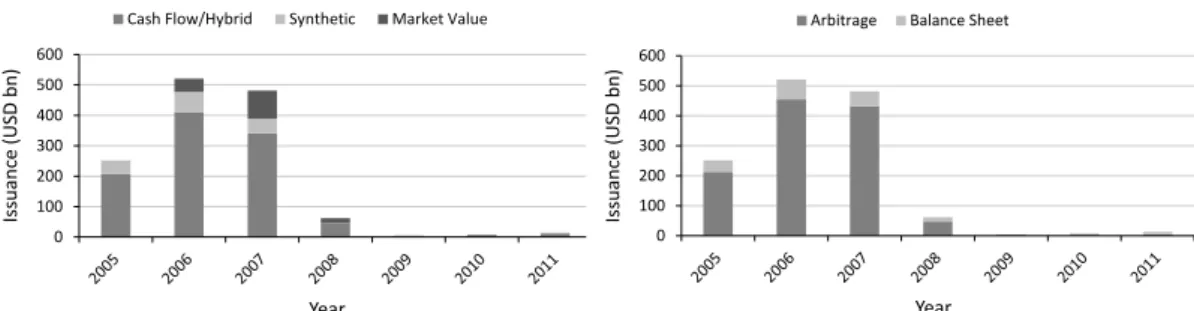
2.10 Comparison of Global CDO Issuance by Type and Purpose . . . 30
2.11 Comparison of Global CDO Issuance by Collateral and Denom-ination . . . 32
2.12 Comparison of Global CDO Outstanding by Type and Purpose 34 4.1 Compound Correlation Smile, 16th of September 2005 . . . 79
4.2 Base Correlation Skew, 16th of September 2005 . . . 81
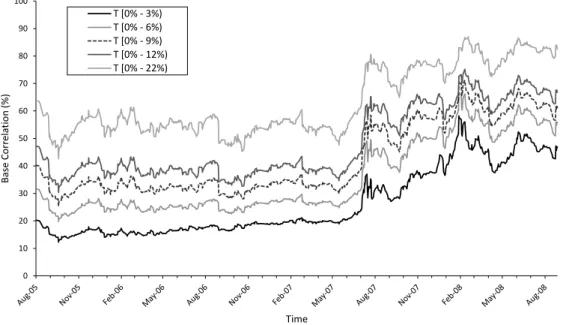
4.3 Spreads of the Standardized 5Y iTraxx Europe from 2005 to 2008 87 4.4 Time Series of Base Correlations from 2005 to 2008 . . . 90
4.5 Distribution of Spread Forecasts for TrancheT[0%,3%)on Decem-ber 2nd, 2005 . . . 92
4.6 MERM Estimation Results . . . 95
4.7 Forecast Performance with Base Correlations for Tranche T[0%,3%) 96 4.8 Forecast Performance with Dynamic Asset Correlations for Tranche T[0%,3%) . . . 97
4.9 Market Spreads versus Model Spread Forecasts . . . 98
4.10 Variance Effects and Intra-class Correlation . . . 102
LIST OF FIGURES
5.2 Indication of Product-based Exposures to Systematic Risk (CPD)119 5.3 Sensitivities of CELs to Systematic Risk . . . 121 5.4 Indication of Product-based Exposures to Systematic Risk (CEL)123 5.5 Impacts of Systematic Risk on Cluster Migrations . . . 125 5.6 Systematic Risk Impacts depending on Variations of δ. . . 127
5.7 Systematic Risk Sensitivity in a Multi-sector Approach (Case 1) 132 5.8 Systematic Risk Sensitivity in a Multi-sector Approach (Case 2) 134 6.1 Average Spreads by Rating . . . 149 6.2 Time Series of Systematic State Variables . . . 152 6.3 Estimation Results of Time-series Regressions . . . 160 6.4 CDS Spread Comparison (market spread vs. model spread) . . 165 6.5 Principal Component Analysis of Time-series Residuals . . . 169 A.1 Sensitivity of Base Correlations . . . 184
List of Tables
4.1 Summary Statistics of 5Y Itraxx Europe Index and Tranche
Spreads . . . 88
4.2 Sample-specific Forecast Periods of the Empirical Analysis . . . 93
4.3 Root Mean Square Forecast Errors by Sample . . . 99
5.1 5-year Cumulative Default Rates . . . 116
5.2 Impacts of Economic Downturns on Probabilities of Default . . 118
5.3 Impacts of Economic Upturns on Probabilities of Default . . . . 118
5.4 Impacts of Economic Downturns on Expected Losses . . . 121
5.5 Impacts of Economic Upturns on Expected Losses . . . 122
5.6 Conditional Risk Clusters and Corresponding Default Rates . . 125
5.7 Migration Probabilities with respect to Systematic Risk . . . 126
5.8 Case Settings within the Multi-sector Approach . . . 129
5.9 Case 1: Economic Impacts on PDs and ELs in a Multi-sector Approach . . . 133
5.10 Case 2: Economic Impacts on PDs and ELs in a Multi-sector Approach . . . 136
6.1 Sample Periods of Multiple Time-series and Cross-section Re-gressions . . . 148
6.2 Investigated Economic Sectors . . . 148
6.3 Sample-specific Correlation Matrix of Common Risk Factors . . 153
6.4 Overview of Common Risk Factors and Predicted Signs . . . 156
6.5 Cross-section Regressions by Rating Dummies . . . 157
6.6 Systematic Risk Indication by Rating Class . . . 159
6.7 Table of Cross-section Estimates . . . 162
LIST OF TABLES
6.9 Table of Cross-section Estimates Including Additional Risk Fac-tors . . . 170 A.1 Interest Rate Sensitivity in Terms of RMSFEs by Sample . . . . 185 B.1 Forecast Test Statistics . . . 187
Chapter 1
Introduction
1.1
Credit Risk and Structured Finance
Securi-ties
Many practitioners and researchers consider Collateralized Debt Obligations (CDO) as one of the most important financial innovations of the recent decades (see Hull & White 2008, Longstaff 2010). However, these structured financial instruments have often been controversially discussed, since they were also identified as a major source of credit losses in the recent credit crisis (see Longstaff 2010). The developments in structured finance markets show both a sharp rise in the demand for these structured instruments up to the year 2007 and a dramatic fall of their issuance volume in the aftermath, which began with the onset of the Global Financial Crisis (GFC). Since 2010, the market developments have shown that asset securitization has been rediscovered as valuable tool for managing credit risk.1
Dealing with risk is the day-to-day business of financial institutions in glob-alized financial markets (Bruyère et al. 2006).2 Thereby, risk is commonly
divided into market risk, operational risk, liquidity risk and credit risk (BIS 2006, 2010a). Particularly credit risk gained increasingly in importance during
the last two decades and encouraged not only the emergence of credit
deriva-1 Credit risk can be seen as default risk or the risk of a decrease in the market value of
a liability due to changes in the obligor’s credit quality (Duffie & Singleton 2003). The management of credit risk may refer to buy-and-hold strategies and to transferring or hedging credit risk in general.
2 For further information about the set of activities related to the risk management of
1.1. CREDIT RISK AND STRUCTURED FINANCE SECURITIES
tives in general, but also the design of more complex securitization structures.3
The growing attention of numerous researchers, market participants, and reg-ulatory authorities around the world was caused by several waves of corporate bankruptcies, for example, in Germany during the nineties (e.g., Herstatt-Bank, Bankhaus Fischer, and SchmidtBank), and during the last financial crisis.4 In this context, the need for more transparent supervision mechanisms
for credit risk has triggered the introduction of a revised capital adequacy framework – known as Basel II – that became effective in January 2007 (BIS 2006). Due to the recent financial turmoil, the Basel Committee on Banking Supervision tightened these seemingly insufficient regulatory requirements in another revision called Basel III. The Basel III framework particularly focuses on the regulatory treatment of asset securitizations and re-securitizations in order to reestablish and maintain stability in global financial markets (BIS 2009b, 2011).
The GFC has also shown that unexpected high default rates have caused credit losses on global credit markets, which were far above investors’ expec-tations, even if those expectations primarily relied on classical credit ratings (Moody’s 2011b).5 Thereby, default rates and related losses were only one
channel, which has shown the wide impacts of credit risk.6 Normally, an
excellent credit rating, e.g., ‘Aaa’, provided by credit-rating agencies (CRA) such as Moody’s, Standard & Poor’s (S&P) and Fitch, suggests the highest creditworthiness of the rated borrower. However, in the last few years particu-larly high-rated financial instruments were strongly affected by macroeconomic shocks – or more generally by systematic risk. Thus, market participants who were invested in these ‘low risk’ products have been surprised by high default rates.
This effect was even stronger for credit derivatives than for corporate debt claims such as classical bonds. Especially, structured financial instruments
3 While in 2003 the annual survey of the Center for the Study of Financial Innovation
(CSFI) (‘Banking Banana Skins 2003’) reported that derivatives and credit risk were the main risks for the banking community, the annual survey of 2012 identified macroeconomic risk and credit risk as the top risks in banking (CSFI 2003, 2012).
4 A well-known example is the bankruptcy of Lehman Brothers Inc. on September 15th,
2008. This default event was a major reason for distrust in the banking community which has caused liquidity troubles within the interbank market in the aftermath.
5 Typically, a rating refers to the obligor’s creditworthiness and thus expresses an opinion
about his ability to fulfill contractual interest and liquidation payments (liabilities).
6 Other channels, for example, were governmental, regulatory and bank internal
1.1. CREDIT RISK AND STRUCTURED FINANCE SECURITIES
like CDOs relying on entire debt portfolios or Credit Default Swap (CDS) baskets leveraged such systematic risk through pooling and tranching. Thus, empirical observations from 2007 to 2010 have shown that the physical default rates of structured securities were multiples of those related to comparably rated bonds (Moody’s 2011b,a). The risk characteristics of securitizations –
even in terms of financial distress – may be the reason why the market for structured securities rapidly broke down in these years, although the demand for asset securitizations was impressive in the decade prior to the GFC.
Simultaneously, credit spreads for corporate bonds and debt-related instru-ments such as CDS or securitized tranches increased across all rated prod-ucts, but the effects on high-rated instruments were disproportionally intense. Risk premiums for ‘Aaa’-rated bonds or tranches increased much more rapidly than those for lower-rated credit assets. In corporate bond markets, this phe-nomenon is known as the ‘credit spread puzzle’ dealing with the mismatch between prices for the product’s physical default risk and the risk neutral val-uation of the product’s total risk (compare Amato & Remolona 2003, Hui 2010). Therefore, solving this puzzle implies having to look beyond the prod-uct’s physical default risk indicated by its rating in order to identify further pricing components compensating for, e.g., related liquidity risk, counter-party risk and systematic risk. With respect to systematic risk, recent studies come to the conclusion that ratings do not appropriately reflect this kind of risk, especially in terms of securitizations (see, e.g., Rösch & Scheule 2009, 2010). Thus, Coval et al. (2009b) state that particularly market participants investing
in asset securitizations should claim premiums beyond the products’s physical default probabilities compensating for impacts of systematic risk.
Recent empirical studies address several determinants of credit spreads with respect to corporate bond markets (among others Collin-Dufresne et al. 2001, De Jong & Driessen 2006, Hui 2010, Iannotta & Pennacchi 2011, Giesecke, Longstaff, Schaefer & Strebulaev 2011, Friewald et al. 2012) in order to decom-pose observed credit spreads into their major pricing elements. These studies often suspect common risk factors as the main drivers for pricing credit risk of corporate debt claims. Besides bond spreads, the analysis of systematic risk factors in pricing CDS contracts seems to be of special interest for several reasons: firstly, single-name CDS represent a substantial section of the credit derivatives market (BBA 2006, SIFMA 2012c). Secondly, several types of
1.1. CREDIT RISK AND STRUCTURED FINANCE SECURITIES
contracts mainly represent the collateral of synthetic CDOs which has been increased in their market relevance since 2002 (BBA 2006, SIFMA 2012c).7 In
fact, only a few studies examine how systematic risk is affecting swap premi-ums (Amato 2005, Blanco et al. 2005, Ericsson et al. 2009, Gala et al. 2010, Gandhi et al. 2012).
Thus far, the recent financial literature and also many public discussions underline the relevance of that topic and show that measuring and anticipat-ing systematic risk are currently the core challenges for researchers, investors and regulatory authorities around the world – not only with regard to struc-tured products. Indeed, the recent literature shows a lack of a comprehensive framework for evaluating the risk characteristics of structured products due to systematic risk, which may also allow to identify and to measure pricing impacts of systematic risk.
Despite the critical discussion of securitizations, a couple of reasons support the commitment of structured securities.8 At least these benefits underline the
need for further empirical research investigating the complex risk profiles of such asset securitizations in terms of default risk and related losses, which determine their ‘natural’ behavior due to systematic risk. Furthermore, scien-tific efforts are gaining in importance even if the discussion of such products is becoming more and more emotional and backed less by empirical evidence, as reported in FCIC (2011).
This cumulative thesis confirms the relevance of structured products in fi-nancial markets and provides an analytical framework for obtaining detailed insights into the risk characteristics of structured products due to systematic risk. The analytical models as well as Monte Carlo (MC) simulations are ap-plied to quantify the impacts of systematic risk on default rates and related losses of securitized tranches. The suggested model setup additionally allows to spotlight the effects of both risk diversification and concentration in secu-ritizations. The major limitations of CRA ratings are also indicated in this framework. Particularly with respect to systematic risk, the empirical stud-ies presented in this thesis firstly suggest that tranche spreads of the 5-year iTraxx Europe credit index may jointly be driven by a systematic component
7 Compare Laurent & Gregory (2005) for a detailed analysis of CDS baskets. 8 Compare Chapter 2 and Rajan et al. (2007) for an introductory overview.
1.1. CREDIT RISK AND STRUCTURED FINANCE SECURITIES
and secondly that systematic risk is also priced in U.S. CDS spreads.9 Related
to the CDS-spread study, some measures for systematic risk are identified and empirically tested for their cross-sectional pricing impact on CDS spreads in order to quantify systematic risk premiums, even after controlling for essential idiosyncratic risk factors such as rating information, firm leverage or market capitalization. The results also show that the risk premium linked to credit ratings does not sufficiently compensate for contract-specific systematic risk exposures. Thus, market participants may claim a separate risk premium for facing systematic risk.
In conclusion, this thesis targets
• a better understanding of ‘complex’ securitizations, their functionality and relevance in financial markets,
• the application of dynamic implied correlation concepts for pricing single-tranche CDO swaps,
• the risk characteristics of structured products due to systematic risk, and • common determinants of credit default swap spreads to quantify the
pricing impacts of systematic risk on such credit derivatives.
The empirical findings related to the latter objective may facilitate the devel-opment of a risk-adjusted valuation framework for CDOs, particularly with respect to systematic risk. Thus, the findings are addressed to several groups, e.g, other researchers in the field of credit risk or derivatives, investors deal-ing with securitized tranches or swap contracts, risk managers in banks or insurance companies engaged in the management of credit risk, and regula-tory authorities developing capital rules for risk-adjusted capital requirements. Eventually, this work may help to return more confidence to structured finance instruments for a ‘healthy’ or rather sustainable handling of these products in order to increase the transparency and stability in global financial markets.
9 Nowadays, such swap contracts constitute not only the most issued and liquid credit
derivatives, but also the major elements of synthetic asset securitizations, such as syn-thetic CDOs. For a good description of the 5-year iTraxx Europe as one of the most popular credit indices and an example for such synthetic CDOs see www.iTraxx.com.
1.2. OUTLINE AND CONTRIBUTIONS
1.2
Outline and Contributions
The remainder of this thesis proceeds as follows. Chapter 2 examines why es-pecially CDOs – one major class of Asset-backed Securities (ABS) – have been widely seen as a popular tool for managing credit risk prior to the GFC.10 For
the time period from 2000 to 2011 developments of the global CDO market are examined by year in terms of their issuance, global outstanding, collateral and purpose. The developments in structured financial markets show the sharp rise of this security class until the year 2007 and their dramatic fall triggered by the beginning of the GFC. The recent market developments also indicate that their popularity has again increased since 2010. Furthermore, the analysis shows that rating-based default rates reported by Moody’s indicate limitations of current rating metrics, especially in macroeconomic downturns. Eventually, the market developments may reflect the influences of systematic risk on struc-tured securities, particularly caused by changes in the global macroeconomic climate as a source for systematic risk.
Chapter 3 reviews the existing paradigms for modeling default risk of a single borrower: structural models and intensity models. Factor models for credit risk are introduced as special case of intensity models and a unifying synthesis of the models is provided. Based on these preliminaries, the models are extended to portfolio credit risk, which is essential for valuation purposes of asset securitizations. In this context, the single-factor Gaussian copula model is specified, which represents the market standard model for pricing CDOs and single-tranche CDO swaps (STCDO), see Hull & White (2008) and Finger (2009). Additionally, the copula approach is briefly presented as flexible framework for modeling joint default times of borrowers in a credit portfolio. Common correlation concepts such as asset and default correlation are introduced in order to reflect dependency structures between borrowers. Correlations are identified as major determinants of credit portfolio risk and thus also constitute important parameters for pricing structured securities.
The empirical study in Chapter 4 contrasts several correlation approaches and confirms the limitations of historical asset correlations in the standard
10 The database of the empirical analysis ‘Developments in Structured Finance Markets’
was provided by the Securities Industry and Financial Markets Association (SIFMA) and refers to U.S. ABS, global CDOs and European securitizations from January 1996 to December 2011. The respective impairment and rating database was provided by Moody’s.
1.2. OUTLINE AND CONTRIBUTIONS
single-factor Gaussian copula model for pricing STCDOs.11 Compound and
base correlations, as two popular concepts of implied correlations, are intro-duced in order to overcome the pricing limitations of a single-correlation ap-proach. Within a dynamic panel regression framework, two alternative spread-dependent correlation skew models are proposed to model and forecast implied correlations of tranches referring to ‘on the run’ series of the 5-year iTraxx Eu-rope credit index. Thereby, random effects are incorporated in order to account for unobservable time-specific effects on implied tranche correlations. The pro-posed dynamic mixed-effects regression correlation model (MERM) is checked for its forecast accuracy in comparison to a dynamic asset correlation model and a fixed-effects regression correlation model (FERM). The empirical find-ings suggest that historical asset correlations gained from stock market returns – as proposed in the financial literature several times – are insufficiently re-flecting the dependency structure across single-name CDS in the credit index. This leads to a mismatch between tranche-specific model spreads and market spreads. Indeed, the highest forecast accuracy measured in terms of root mean squared forecast errors (RMSFE) is reached by applying the proposed MERM. Since each regression model refers to three different sample periods, the predic-tion power of all three models is also checked under varying economic climates: in times of financial distress (during the GFC), in moderate market conditions (pre-crisis) and for the entire period from August 2005 to September 2008. Eventually, the empirical findings also hold for different macroeconomic condi-tions and indicate the presence of a common risk factor influencing all tranche spreads simultaneously.
In Chapter 5, effects of systematic risk on asset securitizations are explicitly addressed.12 The provided analytical framework refers to a basic model
exten-sion of the standard single-factor Gaussian copula model (see Gordy 2003) and allows a closed-form comparison of comparably rated bonds and tranches. The comparison provides insights into product-specific default risks, related losses
11 The empirical study ‘Dynamic Implied Correlation Modeling and Forecasting in
Struc-tured Finance’ refers to daily index and tranche spreads of the 5-year iTraxx Europe credit index and its securitized tranches from August 2005 to September 2008. The index tranches refer to a basket of the 125 most liquid and equally weighted single-name CDS on European entities. The spread database was provided by Markit, contains 4,494 spread notations in total, and covers six ‘on the run’ series of the credit index.
12 In the analytical study ‘Systematic Risk Sensitivity of Structured Financial Products’ the
natural behavior of asset securitization due to systematic risk is demonstrated. In several case studies based on Monte Carlo simulations, the basic assumptions of the analytical model are stepwise relaxed to account for a more ‘realistic’ model setup.
1.2. OUTLINE AND CONTRIBUTIONS
and sensitivities to systematic risk. Even if both products share the same (un-conditional) probability of default in the model setup, they exhibit greatly dif-ferent risk profiles with respect to systematic risk. Furthermore, these findings show that tranches are much more sensitive to systematic risk than corporate bonds due to their increased exposure to systematic risk. The risk charac-teristics of securitized tranches are strongly dependent on the subordination level. A MC approach also demonstrates the effects of pooling and tranching and additionally facilitates the investigation of both risk diversification and concentration effects. While bonds are typically exposed to idiosyncratic, sec-toral and macroeconomic risk, securitizations allow the diversification of both idiosyncratic and sectoral risk, but also lead to the concentration of system-atic risk exposures. The effects may be even more severe for tranches of high seniority. Eventually, the higher concentration of systematic risk exposures in structured products may be responsible for the dramatic increase of impair-ments in economic downturns as it was observable during the GFC (compare Chapter 2). However, the analytical as well as the MC approach indicate that classical ratings are insufficient metrics for measuring risks of structured securi-ties, particularly with respect to high-rated tranches. Overall, the model-based outcome corresponds to the empirical findings in Chapter 2, where historical impairments of securitizations are reported by rating.
In Chapter 6, determinants of CDS spread changes are investigated based on a comprehensive spread data set.13 Several macroeconomic and financial
variables are proposed to explain the cross-section of CDS spreads. The proxies for these common risk variables are applied in a two-pass regression approach in order to examine factor-specific pricing contributions (compare Fama & MacBeth 1973).
In the first pass, the contract-specific sensitivities to systematic risk are eval-uated based on proxies for theCross-market Correlation, theMarket Volatility,
theCredit Market Climate, theSlope of the Term Structure and theSpot Rate.
Since swap contracts not only show different sensitivities to systematic risk by rating class, but also within each rating class, the need for systematic risk mea-sures is underlined. In the second pass, these systematic risk sensitivities are tested for their explanatory power in pricing swap contracts cross-sectionally,
13 The empirical study ‘Valuation of Systematic Risk in the Cross-section of Credit Default
Swap Spreads’ relies on a CDS spread database of 339 U.S. firms divided across ten economic sectors from January 2004 to December 2010. The spread database was provided by Markit and contains 124,413 weekly spread observations in total.
1.2. OUTLINE AND CONTRIBUTIONS
even after controlling for several idiosyncratic risk factors such as the firm’s
Rating, Leverage Ratio, Market Capitalization and the contract-specific Swap Liquidity. Even though credit ratings may determine the general CDS spread
level, these spread levels seem to depend on the macroeconomic climate and, therefore, vary over time. Hence, two-pass regressions are conducted for two different time intervals (subsampling): while the first sample refers to moder-ate economic conditions prior to the GFC, the second sample covers the period of financial distress during the GFC. The empirical findings demonstrate that the premium for the firm’s physical default risk is not sufficiently compen-sating for systematic risk. In addition to the firm’s physical default risk and other idiosyncratic risk premiums, particularly the Credit Market Climate, the Cross-market Correlation andMarket Volatility are cross-sectionally rewarded
in CDS spreads. In contrast to equity markets, the Fama-French factors exhibit rather limited explanatory power for the pricing of swap contracts. Further-more, the main findings are quite robust for different proxies of the interest term structure. Thus, the empirical results hold, even if swap rates are incor-porated instead of Treasury bills. A principal component analysis suggests the presence of an additional common risk factor, which is not explicitly addressed, but significantly priced in the cross-section of swap contracts during the GFC. Overall, this study contributes a framework for identifying contract-specific sensitivities to systematic risk and allows to quantify the factor-specific pric-ing contributions in the cross-section of CDS spreads. Chapter 7 concludes and provides a brief outlook for suggested research.
Chapter 2
Developments in Structured
Finance Markets
The content of this chapter will be published as Löhr S. (2013) ‘Developments in Structured Financial Markets’ in Rösch, D., and Scheule, H. (eds.): ‘Credit Securities and Derivatives: Challenges for the Global Markets’, Wiley.
2.1
Impairments of Asset-backed Securities and
Outstanding Ratings
In 2010 the number of impaired Asset-backed Securities (ABS) fell for the first time in five years to 8,071 from 14,242 in 2009 (Moody’s 2011b). By contrast,
there were only 106 ABS impairments reported for 2006 which was several months before the Global Financial Crisis (GFC) began in June 2007.14
Before analyzing the impairments by year, as well as further market devel-opments, the major ABS structures and its functionality are briefly discussed: the U.S. Securities and Exchange Commission (SEC 2004) defines ABS as financial securities “that are backed by a discrete pool of self-liquidating fi-nancial assets.” The SEC (2004) further defines asset-backed securitization in its regulation rules as “a financing technique in which financial assets [...] are pooled and converted into instruments that may be offered and sold in the capital markets. In a basic securitization structure, an entity, often a finan-cial institution and commonly known as a ‘sponsor’ originates or otherwise acquires a pool of financial assets, such as mortgage loans [...]. It then sells
2.1. IMPAIRMENTS OF ASSET-BACKED SECURITIES AND OUTSTANDING RATINGS
the financial assets [...] to a specially created investment vehicle that issues [...] asset-backed securities. Payment on the asset-backed securities depends primarily on the cash flows generated by the assets in the underlying pool and other rights designed to assure timely payment, such as liquidity facilities, guarantees or other features generally known as credit enhancements."15
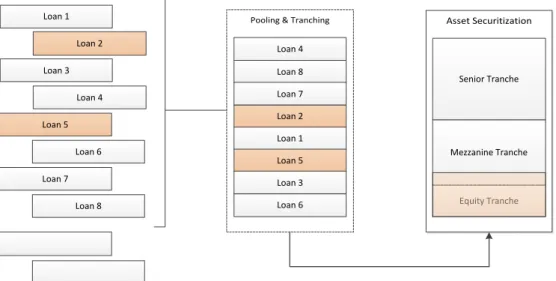
Based on this definition Figure 2.1 summarizes the functionality of a simple asset securitization focusing on the loss flow in such a structure. Corresponding to the SEC’s definition of ABS, the underlying asset pool, which is also called the collateral, typically consists of debt assets that are unable to be traded individually. These debt assets are represented by single-name Loan 1 to 10
on the left hand side of Figure 2.1. Furthermore, Loan 1 to Loan 8 (in any
order) constitute the specified pool of loans (collateral), which is tranched afterwards.
Figure 2.1: Illustration of the Loss-flow in a Simple Asset Securitization
Pooling & Tranching Asset Securitization Loan 2 Loan 3 Loan 4 Loan 5 Loan 6 Loan 7 Loan 8 Loan 1 Loan 8 Loan 7 Loan 2 Loan 1 Loan 5 Loan 3 Loan 6 Loan 4 Equity Tranche Mezzanine Tranche Senior Tranche Loss Loan 9 Loan 10
Notes: This figure shows the loss flow in a simple asset securitization. Other elements such as premium flows, issuance and rating structures and involved participants are omitted for simplicity.
Through pooling and tranching – as main characteristics of securitizations – the original debt claims are converted to tradeable financial instruments (tranches) that may be sold to external investors in accordance to their
in-15 In § 364 of the Standard Financial Accounting Standards No. 140 securitizations are
similarly defined as “the process by which financial assets are transformed into securities." (FASB 2000).
2.1. IMPAIRMENTS OF ASSET-BACKED SECURITIES AND OUTSTANDING RATINGS
dividual risk-return profile.16 The investor’s risk-return profile is determined
by his internal willingness to face risk related to the respective security. De-pending on the instrument’s inherent risk, an investor may expect a premium that compensates him for bearing this risk.17 The Capital Asset Pricing Model
(CAPM), for example, is the most popular factor model for pricing the risk of assets (compare Sharpe 1964). How to calculate credit risk premiums of tranches is discribed in Chapter 3, where the standard single-factor Gaussian copula model is introduced for pricing single-tranche CDO swaps.
The asset securitization in Figure 2.1 consists of three tranches representing generic tranche types: the equity, mezzanine and senior tranche. Often, the originator (sponsor) partly retains the issued securitization to signal the credit quality of underlying debt claims.18 The retained part of the securitization is
mostly the equity tranche, which is also called first loss piece, since it covers first losses in the collateral (see Renault 2007).
If losses in the collateral exceed the size of the equity tranche, measured in its nominal or in percentage of the total portfolio loss, then the next tranche of higher seniority suffers from defaults in the collateral and so on. Referring to Figure 2.1, the cumulated losses ofLoan 2 and Loan 5 exceed the thickness
of the equity tranche and thus also hit the mezzanine tranche. Eventually, both tranches are impaired, the equity tranche completely and the mezzanine tranche in parts. Thus, investors of both tranches suffer from losses in the collateral: while the nominal of the equity-tranche investor has been entirely eliminated, the exceeding losses are covered by the investor who holds the mez-zanine tranche. Consequently, the nominal of senior tranche holders remains unaffected. Hence, according to this subordination principle, subordinated tranches provide loss buffers for more senior tranches. Thereby, tranche losses are generally restricted to the nominal or principal of the respective tranche (thickness). Thus, the risk profiles of securitized tranches may clearly differ from each other in terms of default risk and related losses strongly
depend-16 Note that risk is defined here as uncertainty measured in terms of the standard deviation
of expectations, e.g., referring to expected returns or expected losses (compare Modigliani & Pogue 1974). Indeed, other definitions of risk are available.
17 Under the assumption that risk averse investors attempt to maximize their expected
returns according to their individually acceptable levels of risk – which is one of the most important capital market theories – there should exist a relationship between expected return and risk (compare Modigliani & Pogue 1974).
18 Examples for such originators are banks, monoline insurers, reinsurers, and pensions funds
2.1. IMPAIRMENTS OF ASSET-BACKED SECURITIES AND OUTSTANDING RATINGS
ing on i) the risk characteristics of the collateral and ii) the seniority of the tranche.
Finally, each security funds a fraction of the underlying pool and transfers the related risk to the investors, such as banks, insurance companies, hedge funds, investment banks. In turn, tranche investors receive a premium pay-ment which is periodically paid out, e.g., quarterly, and which is a compensa-tion for the default risk. Thus, related cash flows can be distinguished by their payment directions into the premium leg (pass-through structure) and the pro-tection leg.19 The premium leg contains the investors’ risk premium paid by
the issuer. The risk premium is mostly raised from cash flows generated by the collateral through interest and/or liquidation payments. Premium payments also follow the subordination principle: hence, the premium claims of senior tranche investors are firstly served stepwise followed by claims of investors who purchased subordinated tranches (waterfall principle). Since premium payments strongly depend on the risk-profile of securitized tranches, the pre-miums for the equity tranches are generally much higher than the respective ones of more senior tranches. The protection leg (contingent payments) has to be paid from investors to its counterparts in terms of a default event within the collateral to compensate for occurred losses. In general, the definition of a default event may vary. However, in standard securitizations such default events are triggered by delayed or failed interest payments and liquidation.20
In order to achieve an appropriate risk profile of the entire credit expo-sure, both the originator as well as the contract counterparties may engage in asset securitizations. Required customization as well as optimization of the counterparts’ credit portfolio risk can easily be executed with credit deriva-tives involving so-called bespoke, or customized, CDO tranches (Rajan et al. 2007). Bespoke securitizations are often generated in cooperation with rat-ing agencies such as Moody’s, S&P and Fitch. For example, a srat-ingle investor announces his individual risk-return preference, e.g., expressed by a desired tranche rating in line with a risk-adjusted premium claim, to the issuer and the cooperating rating agency. In the following, the issuer defines both the collateral and the tranche sizes as well as the subordination in order to meet
19 Both payment legs play a crucial role for further valuation purposes referring to structured
securities, compare Chapters 3 and 6.
20 Moody’s, one of the leading rating agencies worldwide, for example, defines an interest
impairment, that is also an default event, as an interest shortfall continuing for 12 months or more (see Moody’s 2011b).
2.1. IMPAIRMENTS OF ASSET-BACKED SECURITIES AND OUTSTANDING RATINGS
the rating agency’s requirements to achieve the target rating.21 Afterwards,
the individually securitized tranche is purchased by the investor who adds di-versity to his portfolio. Besides bespoke asset securitization, the ABS market offers a variety of business opportunities for global rating agencies, which is also indicated by a rapidly increasing number of tranche ratings, as shown later on.
To alleviate the following market analysis of structured securities, Figure 2.2 provides an overview of the major ABS structures.
Figure 2.2: Major Asset-backed Security Classes
Asset-backed Securities (wide sense)
• Home Equity Loans (HEL)
• Auto Loans
• Credit Card Receivables
• Student Loans etc. Asset-backed Securities (more specifically) Mortgage-backed Securities (MBS) Collateralized Debt Obligations (CDO) • Commercial MBS (CMBS) • Residential MBS (RMBS) • Collateralzized Loan Obligations (CLO) • Collateralized Bond Obligations (CBO)
Other Cash-flow Generating Backed Securities
Notes: This figure summarizes the three major classes of Asset-backed Securities and its sub-classes.
In general, ABS may be seen as hypernym for all asset backed securities (wide sense), but more specifically ABS are for themselves seen as financial securities backed by, e.g., home equity loans (HEL), auto loans, leases, credit card receivables, student loans, aircraft leases etc. Other sub-classes of ABS are Mortgage Backed Securities (MBS) and Collateralized Debt Obligations (CDO). MBS can further be separated into Commercial MBS and Residential MBS.22 Collateralized Loan Obligations (CLO) as well as Collateralized Bond
Obligations (CBO) represent sub-categories of CDOs. Hence, depending on the underlying collateral and its characteristics ABS structures may be further sub-classified.
Figure 2.3 underlines the development of annual impairments of structured finance securities (x-axis) from 2000 to 2010 (y-axis) for major Asset-backed
21 The Moody’s long-term ordinal rating scale for bonds and structured finance, for example,
reaches from ‘Aaa’ (highest creditworthiness) to ‘C’ (lowest creditworthiness) embedding 21 categories (grades) (see Moody’s 2009b).
22 Agency MBS are securities issued or guaranteed by government-sponsored enterprises
such as Fannie Mae or Freddie Mac representing a major category of MBS in the U.S. (see SEC 2011).
2.1. IMPAIRMENTS OF ASSET-BACKED SECURITIES AND OUTSTANDING RATINGS
Security (ABS) structures (Moody’s 2011b).23
Figure 2.3: Total Impairments of Structured Securities
0 2000 4000 6000 8000 10000 12000 14000 N u mb er of Imp air me n ts Year
U.S. ABS ex HEL U.S. RMBS/HEL U.S. CMBS Global CDO Other SF
Notes: This figure shows the amount of impairments for major U.S. Asset-backed Security classes from 2000 to 2010. Other SF contains structured finance securities that are not categorized in the four major sectors (ABS, CDO, CMBS, and RMBS). Data Source: Moody’s (2011b).
In contrast to the period from 2000 to 2006, where 1,064 cumulated im-pairments occurred, the number of imim-pairments dramatically increased in the years 2007 to 2009 triggered by the Global Financial Crisis (GFC).24 The
events of the GFC come along with strongly increasing credit spreads25
par-ticularly on the credit derivative markets around the world, e.g., the markets for Credit Default Swaps (CDS) (see Chapter 6). Simultaneously, the credit risk premiums of portfolio credit derivatives related to popular credit indices such as the iTraxx Europe index families and the U.S. CDX index families also increased rapidly, as shown in Chapter 4 with respect to tranches of the 5Y iTraxx Europe credit index.26
The sharp rise of ABS impairments in 2007 can be attributed to the U.S. housing crisis, which was spawned by nationwide U.S. housing price declines
23 Note that Moody’s definition of material impairments includes a downgrade to ‘Ca’ or
‘C’, which often occurs far in advance of any interest shortfall or principal write-down.
24 For more detailed information on the chronology of the GFC compare BIS (2009a). 25 A credit spread may simply be seen as premium compensating, e.g., investors, for the
related default risk, see also Footnote 50 for a literature remark.
26 These credit indices are baskets containing the 125 most liquid CDS contracts (equally
weighted) either from U.S. entities having investment grade (IG) ratings (CDX) or from European entities having IG ratings (iTraxx). For further information to CDOs and credit indices see Chapter 4 and Longstaff & Rajan (2008).
2.1. IMPAIRMENTS OF ASSET-BACKED SECURITIES AND OUTSTANDING RATINGS
combined with a sudden tightening of credit standards and rising interest rates (Moody’s 2011b). Although, the tranche impairments in 2007 (2,153) were
al-ready as twice as high as the cumulated impairments observed over the previous six years, the total amount was rapidly increasing to 12,719 in 2008 which was almost six times higher than in 2007. With 14,242 the peak of impairments was reached in 2009 due to 13,618 principal write-downs (95.61%) and 624 interest shortfalls (4.39%).27
Based on total impairments by year shown in Figure 2.3, Figure 2.4 shows the fraction of impairments in percent for U.S. ABS excluding (ex) HEL, U.S. RMBS/HEL, U.S. CMBS, global CDO and other structured finance (SF) se-curities.
Figure 2.4: Impairments of Structured Securities by Sector
0 10 20 30 40 50 60 70 80 90 100 2006 2007 2008 2009 2010 Pr o p o rt io n Year
U.S. ABS ex HEL U.S. RMBS/HEL U.S. CMBS Global CDO Other SF
Notes: This figure shows the percentages of material impairments from 2006 to 2010 related to the four major asset-backed security classes (or sectors): U.S. ABS ex Home Equity Loans(HEL),U.S. RMBS/HEL,U.S. CMBS,Global CDO, andOther SF.Other SF contains structured finance securities that are not categorized in the four major sectors. Data Source: Moody’s (2011b).
While the U.S. ABS ex HEL market exhibited the highest default frequency until 2007 with on average 36.6% over the years 2000 up to 2006, impairments are clearly dominated by U.S. RMBS/HEL since 2007. In contrast to 2006, where we observed almost balanced impairments across all major ABS classes (except other SF), especially the market for U.S. Residential Mortgage Backed Securities (RMBS), Home Equity Loans (HEL) and global Collateralized Debt Obligations (CDO) suffered from default events related to its borrowers in later years.
27 In the previous 5 years, the proportion of principal write-downs on the total impairments
was above 99% throughout. The number of interest shortfalls is generally small because most either can be cured (repaid) or become principal impairments.
2.1. IMPAIRMENTS OF ASSET-BACKED SECURITIES AND OUTSTANDING RATINGS
In 2007, 1,505 tranche defaults in the U.S. RMBS/HEL market account for more than 69.9% of the total, followed by impairments of global CDO tranches with a proportion of 27.7%. Thus, both securitization classes accounted for more than 97.6% of reported tranche defaults in the first year of the GFC.
In the following years, there was again a slight shift in the proportion of sec-toral impairments: up to the impairment peak in 2009 the U.S. RMBS/HEL proportion of tranche defaults increased to 75.6% (10,774), while the respec-tive proportion of global CDOs clearly decreased to 17.5%. But despite this decrease the absolute number of 2,496 impairments was relatively high and still higher than the overall impairments in 2007.
In 2010, U.S. RMBS/HEL accounted for 78.7%, U.S. Commercial MBS for 16.6% and global CDOs for 3.8% of the 8,071 reported tranche defaults. Thereby, the new impairments of U.S. CMBS increased by 59% from 839 to 1,337. However, we observe a decrease of almost 47% in new impairments in comparison to the previous year in total across the reported ABS classes. The decrease of impairments from absolute 2,496 to 304 (about 88%) is even higher in the global CDO market.
Figure 2.5 shows the proportion of outstanding ratings across the reported ABS classes for January 2007 and 2010 (compare Moody’s 2008, 2011b).
Figure 2.5: Comparison of Outstanding Ratings
Aaa 50.5 Aa 13.9 A 13.4 Baa 14.0 Ba 5.2 B 1.7 Caa - C 1.3 2007 Aaa 18.3 Aa 8.4 A 8.4 Baa 9.4 Ba 8.0 B 9.0 Caa - C 38.3 2010
Notes: This figure shows the percentage of outstanding ratings for January 2007 (total: 86,671) and January 2010 (total: 94,326). The ratings refer to the entire reported Asset-backed security market, particularly to U.S. ABS ex HEL,U.S. RMBS/HEL,U.S. CMBS,Global CDOandOther SF. Other SF contains structured finance securities that are not categorized in the four major sectors. Data Source: Moody’s (2008, 2011b).
Moody’s (2011b) reports that the number of new ratings by closing year
exponentially increased from 1993 to 2006 and reached its peak in 2006 with over 27,000 ratings. During the turmoils of the global financial markets, the number of new ratings decreased strongly and fell below 2,500 in 2010 which is the second lowest level since 1993 (compare Moody’s 2011b). Consequently,
2.1. IMPAIRMENTS OF ASSET-BACKED SECURITIES AND OUTSTANDING RATINGS
a row across all ABS classes.
In 2010 – analogous to 2007 (reported in parentheses) – the amount of ratings for structured securities backed by U.S. RMBS/HEL approximately accounted for 61.4% (60.1%) of the outstanding ratings and was thus leading, followed by U.S. CMBS ratings approximately accounting for 9.3% (9.8%) and by global CDO ratings approximately accounting for 13.4% (13.4%).
While the distribution of outstanding ratings was heavily skewed in the beginning of 2007 towards Investment Grade (IG) ratings, the respective dis-tribution for 2010 was not: with over 50% ‘Aaa’-rated tranches the IG ratings making up 91.8% of all asset-backed security ratings in 2007. In contrast, ap-proximately 55.3% of all structured ratings were below the IG rating in the beginning of 2010. The proportion of tranches in the ‘Aaa’ category experi-enced a decline of over 36%, while the amount of non-IG rated tranches was about 6.7 times higher than in 2007, despite the numerous impairments in the previous years.
Figure 2.6 shows the distribution of material impairments by original rating of structured securities in 2010.
Figure 2.6: Impairments of Asset-backed Securities by Original Rating (in %)
Aaa 56.3 Aa 16.6 A 10.1 Baa 7.4 Ba 5.3 B 4.2 Caa - C 0.1 2010
Notes: This figure shows the distribution of material impairments, defined as interest shortfalls or principal write-downs, by the original rating of Asset-backed Securities for the year 2010 in percent. Data Source: Moody’s (2011b).
As already indicated, in 2010 most tranche impairments occurred in rating category ‘Aaa’ which is expected to contain the most secure tranches in terms of default risk. Interestingly, tranches of category ‘Caa’ to ‘C’ exhibiting the lowest creditworthiness represent the smallest group of defaulted securities. Overall, 90.4% of impaired tranches were labeled with an IG rating, which underlines the shortcomings of current rating metrics.
dis-2.1. IMPAIRMENTS OF ASSET-BACKED SECURITIES AND OUTSTANDING RATINGS
tress on the global financial markets arrived with strongly increasing material impairments across all securitized asset classes. From an economic perspective a dramatic increase of physical defaults was observed across various financial instruments, e.g., bonds, loans, leases, structured products, even during the economic downturn, either caused by principal write-downs or continuing in-terest shortfalls. However, structured financial instruments seem to have been particularly affected by the financial turmoil, since its investors were faced with unexpected high default frequencies/rates, even though they invested in ‘Aaa’-rated securities.
Under the assumption that global economic movements are caused by unob-servable systematic risk which affects all economic sectors simultaneously, one may conclude that particularly structured finance instruments are exposed to systematic risk due to pooling and tranching (compare also Chapter 5). The impacts of systematic risk are especially observable in economic downturns since this economic distress becomes manifest in an increase of impairments (downside risk). On the other hand, the systematic upside risk is rather neg-ligible since default events are rarely triggered by economic upturns.
Eventually, these market developments indicate not only that structured finance products exhibit a higher sensitivity to systematic risk than other fi-nancial instruments such as classical bonds, but also that the systematic risk sensitivity is monotonically increasing with the tranche seniority.28
Despite the absence of an exact knowledge about the established rating methodologies, one may secondly conclude that ratings are not appropriately measuring default risk of structured securities at all. Rather, they seem to underestimate risk characteristics of structured financial products, especially in times of market crisis, as could be deduced by market participants from the recent GFC. Since particularly investors in structured products bore un-expected high default rates and also suffered from related severe losses due to the numerous tranche impairments, one may suspect that agency ratings do not reflect appropriately the risk characteristics of structured financial prod-ucts – neither in terms of default risk nor in terms of losses caused by such impairments.
In conclusion, it is suggested that current rating metrics do not account appropriately for systematic risks inherent in Asset-backed Securities since
28 Chapter 5 demonstrates that pooling and tranching in asset securitizations lead to
2.2. ISSUANCE OF ASSET-BACKED SECURITIES AND OUTSTANDING VOLUME
they obviously underestimate cyclical influences which affect impairments.
2.2
Issuance of Asset-backed Securities and
Out-standing Volume
One way to examine the economic relevance and popularity of asset securitiza-tions in global financial markets is to analyze recorded issuance activities and outstanding volumes of these securities.
Starting with a description of the developments on current structured fi-nance markets, Figure 2.7 compares the market issuance from 1996 to 2010 concerning asset- and mortgage-backed securities, which represent two major ABS classes (see Figure 2.2). The upper chart refers to ABS and compares the issuance volume related to the U.S. and Europe.29 In the lower chart,
the security issuance is analogously compared with respect to MBS. The is-suance volume is denoted in USD billions (bn) on the y-axes from 1996 to 2010 (x-axes).
Similarly to the developments of tranche impairments shown in Figure 2.3, the U.S. ABS issuance increased more than 19 years in row and reached its all-time high in 2006 with over 753 USD bn (upper chart).30 In the following years
it fell dramatically, reaching a low of 107 USD bn in 2010. From 2010 to 2011, the issuance increased about 16% to more than 124 USD bn. This was the first reported increase after four weak years. The increase in volume comes along with the decrease in new material impairments which was described earlier.
Even though first European securitizations were already recorded in 1987, the total market for ABS was comparably less developed in Europe until 1997. While the U.S. ABS issuance was at 202 USD bn, its European pendant solely denoted at 1.08 USD bn. However, from 1997 to 2011 the developments in terms of absolute growth were still dominated by the U.S. markets, but the relative growth rates indicate the increasing importance of the European
mar-29 According to the Securities Industry and Financial Markets Association “European
se-curities are defined as securitizations with collateral predominantly from the European continent, including Turkey, Kazakhstan, the Russian Federation, and Iceland." (SIFMA 2012a).
30 The collateral assets of U.S. ABS refer to auto loans and leases, credit card receivables,
equipment, home equity loans, manufactured housing, student loans and other asset cat-egories that do not fit any other catcat-egories. The European ABS refer to auto loans, consumer loans, credit card receivables, leases and others in the sense of above. For more details compare SIFMA (2012d,a).
2.2. ISSUANCE OF ASSET-BACKED SECURITIES AND OUTSTANDING VOLUME
Figure 2.7: Comparison of ABS and MBS Issuance
0 100 200 300 400 500 600 700 800 Iss u an ce (USD b n ) Year
U.S. ABS Issuance Europe ABS Issuance
0 500 1000 1500 2000 2500 3000 3500 Iss u an ce (U SD b n ) Year
U.S. MBS Issuance Europe MBS Issuance
Notes: This figure compares the ABS issuance (upper chart) and MBS issuance (lower chart) with respect to the U.S. and Europe from 1996 to 2011 in USD billions (bn). Data Source: SIFMA (2012a,d).
ket segment: despite a moderate break-down in 2007 due to the turmoil in global financial markets, the European security issuance increased to more than 98 USD bn, which is more than 90 times as high as the volume in 1997. Due to the increasing demand for European ABS structures both ABS mar-kets (U.S. and Europe) exhibit a comparable level in terms of issuance volume. This also underlines the emergence of Europe as one of the major markets for structured securities.
Similar developments may be observed with regard to MBS markets (lower chart). Until 2010 the U.S. MBS issuance was dominating the respective Eu-ropean one in absolute pattern. Interestingly, after the U.S. issuance peak in 2003 (over 3,179 USD bn) the volume declined to 1,924 USD bn in 2004, but varies around 2,000 USD bn with the exception of 2008. In 2008, the issuance fell to 1,403 USD bn, which was about 37% less volume than in the previous year. Thus, in contrast to the ABS markets one may conclude that the U.S. MBS markets experienced a relatively strong issuance of structured securities despite the turmoil on the global financial markets.
Similar to European ABS, European MBS have increased since 1987. From 1987 to 1996 the issuance increased moderately from 1.0 USD bn to about 9.76 USD bn. In the following years, the demand for European MBS has
2.3. GLOBAL CDO ISSUANCE AND OUTSTANDING VOLUME
also increased and the issuance denoted an all-time high in 2009 with over 1,961 USD bn, which is more than 200 times higher than the issuance in 1996. Nevertheless, the absolute volume was slightly lower than the respective one in U.S. markets. This has changed in the years 2009 to 2011: while the U.S. Market issuance has decreased about 18.7% the European issuance has declined only about 11.5%. Thus, in 2011, the absolute U.S. issuance volume was 1,660 USD bn while the European was 1,736 U.S. bn, which was historically the first time that the U.S. MBS issuance was below the European one.
2.3
Global CDO Issuance and Outstanding
Vol-ume
Since many practitioners and researchers widely view CDOs as one of the most important financial innovations of the past decade and identify CDOs as a major source for credit losses in the recent credit crisis (see, e.g., Longstaff 2010), the remainder of this chapter focuses on CDOs as heavily and most critical discussed ABS class. In order to underline their special role on global financial markets, both the global CDO issuance and CDO outstandings are addressed from several perspectives.
Initially, North America and Europe were the main markets for credit derivatives such as credit default swaps and CDOs as well. Recently trad-ing activities have begun in Asia, Japan and a number of emergtrad-ing markets (Rajan et al. 2007). Although, the list of participants has grown, banks are major market participants next to others such as hedge funds, monoline in-surers, reinin-surers, pensions funds, mutual funds and corporations. Nowadays, most market participants are buyers as well as sellers of default protection (Rajan et al. 2007).
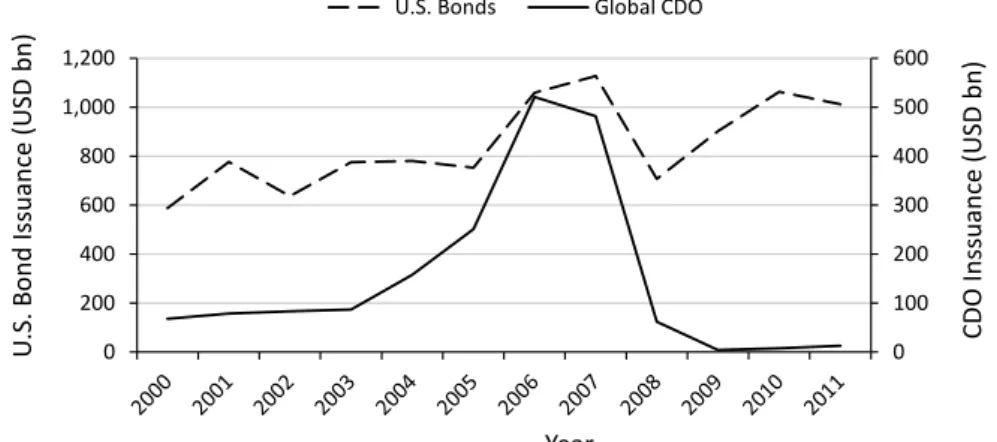
Figure 2.8 compares the global CDO issuance (black line) with the U.S. bond issuance (dashed line). The primary y-axis denotes the U.S. bond issuance and the secondary y-axis shows the global CDO issuance in USD billions (bn) from 2000 to 2011 (x-axis).
After four years of moderate CDO issuance growth from 67.99 USD bn in 2000 to 86.63 USD bn in 2003, the issuance growth rate was strongly increasing over the next three years. This led to a peak in 2006 that is marked by an issuance of more than 520 USD bn. During these three years, the market