IOP Conference Series: Earth and Environmental Science
PAPER • OPEN ACCESS
Research on Image Data Management System of Power Transmission
Project Based on Geographic Information
To cite this article: Yao Jin et al 2021 IOP Conf. Ser.: Earth Environ. Sci. 632 042038
View the article online for updates and enhancements.
2020 Asia Conference on Geological Research and Environmental Technology
IOP Conf. Series: Earth and Environmental Science632 (2021) 042038
IOP Publishing doi:10.1088/1755-1315/632/4/042038
Research on Image Data Management System of Power
Transmission Project Based on Geographic Information
Yao Jin1, 2, *, Jie Zhao1, 2, Wenxing Yu1, 2, Hongzhu Li4, Bo Liu3, Yongxin Sun1, 2,
Yaobin Zheng1, 2, Chunhui He1, 2, Shengchao Duan4
1Economic & Technology Research Institute of State Grid Shandong Electric Power
Company, Jinan Shandong 250021, China
2Shandong Zhiyuan Electric Power Design Consulting Co., Ltd, Jinan Shandong
250021, China
3Shandonng luneng software technology Co., Ltd, Jinan Shandong 250021, China, 4EarthView Image Inc, Beijing 100000, China
*Corresponding author email: yaojin@sgcc.com.cn
Abstract. Taking "Power Transmission Project Management Information System" as an example, this paper introduces the application of Web GIS in power transmission project. The system comprehensively utilizes basic space data and related design results to provide a visual space collaborative management platform for owners, construction, construction, supervision and other related units, and intuitively displays accurate and complete project space locations, project progress, and related real-time data. Construction provides advanced auxiliary technical support, and transfers complete electronic archives of spatial location information for production operations. The "Power Transmission and Transformation Project Management Information System" has achieved good results in the field management of power transmission and transformation projects.
Keywords: Power transmission and transformation engineering, geographic information system, project management, image data management.
1. Introduction
With the development of the urban power system in the direction of highly informatization and automation, the scale of the power grid is expanding day by day, and it is necessary to manage a huge amount of power equipment and facility data, user data, planning data, field data, historical accounts and information. To a certain extent, scientific decision-making depends on the amount and accuracy of the information that the decision-maker has. The transmission system is a complex system containing a large amount of information, and GIS can integrate relevant information to the greatest extent, so as to provide a diversified decision-making basis for power system decision-makers. The development of grid interconnection technology has led to the expansion of the power system. Many related factors are involved in the planning and site selection and economic operation, such as resources, population, economic development, social activities, etc., all of which are related to the geographic system [1]. Geographic information is used as electricity. The main line of system
2020 Asia Conference on Geological Research and Environmental Technology
IOP Conf. Series: Earth and Environmental Science632 (2021) 042038
IOP Publishing doi:10.1088/1755-1315/632/4/042038
2
management can describe the system vividly and effectively organize data information. The grid spatial information support system can establish a multi-platform, omni-directional, open grid operation management system supported by geospatial graphics to realize the integration of digital geographic information, grid structure information, power equipment graphics, ledger accounts, and equipment operation management. Its characteristic is to use GIS to describe the distribution and operating status of the power grid, build a "digital power grid", manage the power grid effectively and scientifically, and ensure the reliability of power supply.
2. The structure and function of the information management platform 2.1. Construction goals
Through the construction of the three-dimensional digitalization and integrated platform of Shandong 500kV power grid, the real restoration and panoramic reproduction of the provincial power grid operation situation, the integrated application of the multiple core business of the provincial power grid, the deep application of power grid planning and design based on 3D GIS, and the power grid based on 3D GIS Comprehensive and three-dimensional emergency management provides spatial information support for power grid management and decision support services for power grid planning, design, construction and operation.
2.2. Technical design plan
In response to the above application requirements, the "Power Transmission and Transformation Project Management Information System" has designed the following technical solutions to ensure the realization of application functions and the safety and performance of the system.
2.3. System architecture design
From an overall point of view, the "power transmission and transformation project management information system" adopts a three-tier architecture system, including: business application layer, application system platform layer and basic platform layer.
(1) The basic platform layer includes an attribute database for storing power transmission and transformation projects, a GIS database for storing Beijing layers and grid graphics information, and a digital model library for power transmission and transformation projects based on basic data [2].
(2) The application system platform layer contains application server software used to manage the data model and provide services for the business application layer, such as Arc SDE, Arc IMS, and Web erver.
(3) The business application layer contains various business function applications, specifically: spatial modeling, power transmission and transformation engineering design information management, advanced engineering construction applications, integrated WebGIS applications, and related data interfaces for digital handover. The "Transmission and Transformation Project Management Information System" adopts a centralized construction mode, that is: GIS server is deployed in the construction management company, and all units on site are connected to the central server via the Internet; the construction management company is the main management unit of the server and GIS system and is responsible for GIS system server maintenance and GIS system data management, post authority management, etc.; as the main data maintenance unit, each construction unit maintains the project data under its jurisdiction to meet business applications. System network integration structure is as shown in Figure 1.
2020 Asia Conference on Geological Research and Environmental Technology
IOP Conf. Series: Earth and Environmental Science632 (2021) 042038
IOP Publishing doi:10.1088/1755-1315/632/4/042038
Figure 1. System architecture of the three-dimensional digital geographic information management platform for power grids
2.4. Main functions
The information management platform functions cover the entire life cycle of the power grid, including auxiliary planning, auxiliary design, digital transfer of asset information, construction progress query display and auxiliary operation inspection management, dispatch data display, auxiliary emergency response and other functions [3]. Through the three-dimensional digital platform, the true and refined model of the transmission line (including lines, towers, insulators, etc.) and its location, topography, and crossing conditions (including rivers, roads, power lines, etc.) are displayed in a three-dimensional visualization form, supplemented by Line equipment attributes, environment and weather information. Through the three-dimensional digital platform, the substation and the equipment in the station are simulated in real life, and at the same time, the management of information such as the structure of the substation equipment and equipment attributes is realized. The main function diagram is shown in Figure 2 below.
2020 Asia Conference on Geological Research and Environmental Technology
IOP Conf. Series: Earth and Environmental Science632 (2021) 042038
IOP Publishing doi:10.1088/1755-1315/632/4/042038
4
Figure 2. System function diagram
2.4.1. Basic functions of the 3D digital platform. Using digital earth and refined 3D scenes as a
display method, 3D simulation of substations, transmission lines, etc., and display on high-resolution aerial images and digital elevation models, visually display the state of the power grid, and provide full-line 3D roaming and video recording, The basic information display and spatial analysis of power grid topics. It includes functions such as scene browsing, model display, scene positioning, information query, flight roaming and three-dimensional space analysis.
2.4.2. Digital transfer of asset information. For newly built substations and transmission lines,
through digital handover, compared with traditional drawings, reports and electronic files, the basic data, line corridors, equipment and facilities information, line towers and three-dimensional models of substations are handed over in a fully digital and three-dimensional visualization form. For the owner, the seamless transfer of design and management is realized [4].
2.4.3. Thematic information display. The information includes pollution area distribution information,
wind speed distribution information and ice area distribution information, main mining area distribution information, road pipe network distribution information, and seismic intensity zone distribution information.
2.4.4. Auxiliary planning. Integrate the national economy, energy resources, transportation, load level
and power operation conditions, realize the statistics, sorting and display of data information, achieve the three-dimensional visualization effect of the planning plan, and provide basic spatial information support for the planning work from a variety of perspectives Provide assistance for power planning in order to carry out work more accurately, efficiently and conveniently.
2.4.5. Auxiliary engineering design. Using high-definition images and digital ground models,
2020 Asia Conference on Geological Research and Environmental Technology
IOP Conf. Series: Earth and Environmental Science632 (2021) 042038
IOP Publishing doi:10.1088/1755-1315/632/4/042038
comprehensively display the various factors considered in the preliminary engineering design, and provide auxiliary site planning and selection and route routes Select functions to improve work efficiency.
2.4.6. Constructionprogress management. On-site construction progress is an important link related
to whether the construction can be carried out smoothly as planned. The system will provide statistical details for the progress of the foundation construction, tower construction, wire construction and completion acceptance, and provide decision-making for the owner’s overall management. Auxiliary. 3. Experiment and result analysis
According to the characteristics of geographic information data, see Table 1 to determine the principle of data integration of engineering geographic information system: (1) For important sections of transmission line paths, such as important crossings and congested sections of line corridors, strip aerial image data is used. (2) Use satellite imagery data for plain areas with little elevation changes. (3) For mountainous and hilly areas where ground attachments have not changed significantly over the years, satellite images and digital topographic maps are used to combine data.
Table 1. Data characteristics of multiple geographic information Image resolution Up to 0.5m 5cm no
Height accuracy 10-30m 20cm 5cm
Timeliness Up to half a yearreal timeFrom a few years to decades Acquisition cost low high low
This paper compares the efficiency of using the single-machine single-database architecture storage method and the Hadoop distributed storage architecture for different sizes of data to verify the storage efficiency of the proposed storage architecture. With the increase of the data block, the time required for the identification of the architecture in this paper is basically unchanged; while the time required by the traditional storage method increases linearly with the file size. This shows that the storage architecture in this paper is more suitable for storing massive power transmission and transformation engineering data [5]. In addition, the paper compares the power transmission and transformation data of different sizes to verify the time cost of its integrity, that is, the time cost of the detection algorithm when the system parses different types of data. Figure 3 shows the time and communication overhead required for data integrity detection when the data block size is set to 2, 4, 8, 16, 32, 64, and 128kbit. It can be seen from Figure 3 that when the integrity check of the data stored in this storage architecture is performed, the time required does not change with the size of the data block.
2020 Asia Conference on Geological Research and Environmental Technology
IOP Conf. Series: Earth and Environmental Science632 (2021) 042038
IOP Publishing doi:10.1088/1755-1315/632/4/042038
6
Multi-source geographic information data has the characteristics of diversified accuracy and resolution. It is a relatively efficient way to obtain geographic information data by selecting different data sources according to the needs of different line sections. In Figure 4, the oblique photographic data obtained by drone aerial photography can accurately restore the terrain information, houses, buildings and other features of the project site, and can perform accurate spatial measurement in the three-dimensional design platform. At the same time, it can also count the amount of forest felling and house demolition within the corridor of the route. For the key areas of the Trans-Gan River section, the accuracy of geographic information data directly affects whether the Trans-River Plan can be established [6].
Figure 4. Statistics across forest areas
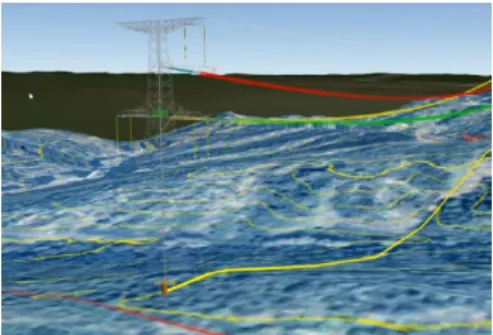
For the hilly areas of this project, the distribution of ground features such as houses and roads are sparse, and there are few crossings such as power lines and communication lines [7]. The use of high-precision satellite data after satellite and digital contour fitting can support the pole and tower ranking work, and the acquisition cost is lower than that of aerial photography data, and it is not limited by the width of the flight belt, and can better support the path Optimization work, see Figure 5.
Figure 5. Using high-precision satellite data to arrange towers 4. Conclusions
At present, the GIS-based "Transmission and Transformation Project Construction Management Information System" of the State Grid Corporation of China’s exchange construction branch has basically realized the basic functions of spatial information import, query and retrieval, and progress display. This technology can also be widely used in the future The spatial visualization of various information on the project site, route navigation, spatial thematic analysis and production, site construction layout, etc., in the future, combined with global positioning system (GPS), handheld computer (PDA) and other technologies can also achieve the site in place Assessment management, on-site quality inspection and evaluation, etc., will definitely give better play to the value of spatial
2020 Asia Conference on Geological Research and Environmental Technology
IOP Conf. Series: Earth and Environmental Science632 (2021) 042038
IOP Publishing doi:10.1088/1755-1315/632/4/042038
information, making geographic information technology an important technical support for construction management of engineering projects.
References
[1] Salwe, S. S., & Naik, K. K. Discrete image data transmission in heterogeneous wireless network using vertical handover mechanism. Iet Image Processing, 11(7) (2017) 550-558.
[2] Alaybeyoglu, A. Transmission of image data using fuzzy logic-based clustering infrastructure in mobile multimedia sensor networks. Journal of Intelligent and Fuzzy Systems, 28(3) (2015) 1235-1242.
[3] Yagi, Y., Riedlinger, G., Xu, X., Nakamura, A., Levy, B., & Iafrate, A. J., et al. Development of a database system and image viewer to assist in the correlation of histopathologic features and digital image analysis with clinical and molecular genetic information. Pathology International, 66(2) (2016) 63–74.
[4] Zhang, R., Wu, J., Wang, R., Yan, R., Zhu, Y., & He, X. A novel battery management system architecture based on an isolated power/data multiplexing transmission bus. IEEE Transactions on Industrial Electronics, 66(8) (2019) 5979-5991.
[5] Tan, J., Yang, L., Grimmond, C. S. B., Shi, J., Gu, W., & Chang, Y., et al. Urban integrated meteorological observations: practice and experience in shanghai, china. Bulletin of the American Meteorological Society, 96(1) (2015) 15-48.
[6] Wu, F., Zhu, X., Xiang, R., Xu, Q., & Liu, P. Cloud removal based on dual tree complex wavelet transformation and improved atmosphere transmission. Modern Physics Letters B, 32(12) (2018) 1840091.
[7] Ohbitsu, T. Information processing apparatus, information processing system, recording medium, and method for transmission and reception of moving image data. Plant Cell, 2574(12) (2017) 356-362.