Predictive Modeling in Practice: Improving the Participant
Identification Process for Care Management Programs
Using Condition-Specific Cut Points
Shannon M.E. Murphy, MA, Heather K. Castro, MS, and Martha Sylvia, PhD, MBA, RN
Abstract
The objective of this study was to optimize predictive modeling in the participant selection process for care management (CM) programs by determining the ideal cut point selection method. Comparisons included: (a) an evidence-based ‘‘optimal’’ cut point versus an ‘‘arbitrary’’ threshold, and (b) condition-specific cut points versus a uniform screening method. Participants comprised adult Medicaid health plan members enrolled during the entire study period ( January 2007–December 2008) who had at least 1 of the chronic conditions targeted by the CM programs (n¼6459). Adjusted Clinical Groups Predictive Modeling (ACG-PM) system risk scores in 2007 were used to predict those with the top 5% highest health care expenditures in 2008. Comparisons of model performance (ie,cstatistic, sensitivity, specificity, positive predictive value) and identified population size were used to assess differences among 3 cut point selection approaches: (a) single arbitrary cut point, (b) single optimal cut point, and (c) specific optimal cut points. The ‘‘optimal’’ cut points (ie, single and condition-specific) both outperformed the ‘‘arbitrary’’ selection process, yielding higher probabilities of correct prediction and sensitivities. The condition-specific optimal cut point approach also exhibited better performance than applying a single optimal cut point uniformly across the entire population regardless of condition (ie, a higherc statistic, specificity, and positive predictive value, although sensitivity was lower), while identifying a more manageable number of members for CM program outreach. CM programs can optimize targeting algorithms by utilizing evidence-based cut points that incorporate condition-specific variations in risk. By efficiently targeting and intervening with future high-cost members, health care costs can be reduced. (Population Health Management 2011;14:000–000)
H
ealth care expenditures in the United Stateshaveincreased dramatically and are the highest per capita in the world.1As few as 10% of the population is thought to be responsible for 70% of all health care costs2; the highest uti-lizers are often those with chronic illness.3Direct payers for health care services, mainly employers and health plans, are most affected by these rising costs of caring for the chronically ill and, as a response, have invested in population health strategies that address the needs of those who either have or are at risk for chronic illness. Population health strategies focus on: (a) identifying members of a population with spe-cific health condition(s) and the risk factors associated with the development of the conditions; (b) stratifying those iden-tified to the appropriate intervention according to severity of risk or health condition; and (c) measuring and evaluating quality and cost outcomes that result from these strategies. By identifying future high-cost members early and providing
them with the services they need to manage their conditions, population health initiatives aim to both improve member heath and contain (or reduce) future health care costs.
One of the key elements in the success of population health initiatives (eg, care management [CM] programs of-fering case and disease management services) is participant identification. Several methods are available to select mem-bers for CM programs. These include referrals from health care providers, member surveys, threshold-based models, and predictive modeling.4,5Surveys and referrals are effec-tive, but also costly and subjective.4 Threshold- or rules-based models, which select members who have met certain condition, utilization, or cost levels, do not always accurately predict who will be a high utilizer in the future.5Predictive models use mathematical formulas and statistical methods to analyze historical data and attempt to predict future out-comes.5 Predictive modeling is generally considered one of
Research and Development Unit, Johns Hopkins HealthCare LLC, Glen Burnie, Maryland. ªMary Ann Liebert, Inc.
DOI: 10.1089/pop.2010.0005
the most effective ways to accurately identify people with whom to intervene.3–6
A leading predictive modeling approach used to assess current and future health risk is the Johns Hopkins Adjusted Clinical Groups (ACG) Case-Mix System. The ACG system uses inpatient, outpatient, and pharmacy data to measure the morbidity burden of populations based on disease patterns, age, and sex (but not prior resource use). The ACG system is a person-focused method of categorizing patients’ con-stellation of illnesses into a single group, or ACG, providing a measure of morbidity burden.7 The Adjusted Clinical Groups Predictive Model (ACG-PM) produces a variety of morbidity-based predictive risk scores based on the same concepts, with the addition of specific clinical markers that are likely to result in future high costs.8One such ACG-PM measure evaluates risk in terms of predicted future health care costs. Specifically, it provides an estimate of total medi-cal and pharmacy costs in the following year expressed as a relative weight with a mean of 1.0, in comparison to the national baseline (ACG Data Source: PharMetrics, Inc., a Division of IMS International, Watertown, MA; national cross-section of managed care plans). Multiple studies have demonstrated the ACG-PM system’s accuracy at predicting health care utilization, cost, and clinical amenability.4,9–11 Additionally, researchers working with the State of Ver-mont’s Medicaid program recently compared 3 different commercially available predictive models and found the ACG-PM system to outperform the other models in terms of sensitivity, specificity, and positive predictive value (PPV) at the 90thpercentile cost threshold.6 Using the ACG-PM risk scores, potential future high-cost members can be targeted for population health interventions, such as CM programs, with the hope of improving their health and reducing future health care costs.
Although researchers tend to agree that predictive model-ing is a superior method of participant selection,4–6few have explicated how best to incorporate predictive modeling scores into the selection process.12In the managed care setting, in-dividuals are traditionally identified for CM if their risk score exceeds a predetermined cut point. This threshold is often based on program capacity where the cumulative distribution of risk scores is dichotomized at the high end of the scale to match the proportion of members who can be managed.13 However, this ‘‘arbitrary’’ method for selecting the cut point does not take into account the performance of the cut point at accurately predicting future high-cost members. Instead, this method focuses primarily on those with the highest risk, which often results in a low false positive rate but an exces-sively high false negative rate. Failure to identify individuals at moderate levels of risk may limit cost savings potential as evidenced by a pilot study indicating that CM programs may have a larger impact on cost savings when offered to adults with lower levels of risk.14While using the distribution of risk scores and program capacity to determine a cut point is not completely ‘‘arbitrary,’’ this basic approach may not achieve the appropriate balance of sensitivity and specificity in order to maximize program impact.
A more evidence-based approach is one that calculates the ‘‘optimal’’ cut point based on comparisons of model perfor-mance indicators including the resulting sensitivity (true positive rate) and specificity (true negative rate). One such evidence-based method for calculating an optimal cut point
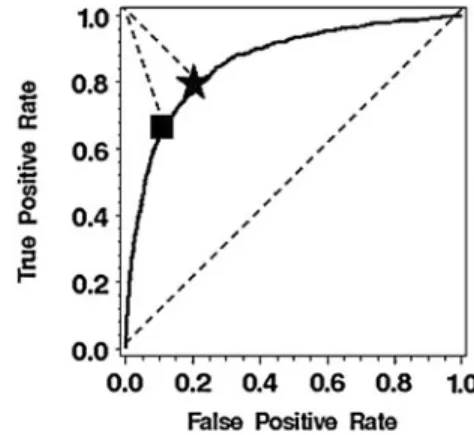
uses the Receiver Operating Characteristic (ROC) curve. The ROC curve plots the true positive rate (sensitivity) and the false positive rate (1specificity) achieved across the entire range of possible predictive modeling risk scores when using each risk score as the cut point. When sensitivity and spec-ificity are valued equally for member identification, the ‘‘optimal’’ cut point is the risk score that performs closest to ‘‘perfect,’’ represented by the (0,1) coordinate, with a sensi-tivity of 1.0 (or 100%) and a false positive rate of 0.15–17(See Fig. 1 for an illustration using 2 possible cut points.) To date, there has been little research comparing the performance of the ‘‘arbitrary’’ and ‘‘optimal’’ cut point approaches to predict future high-costs members.
Another important question related to the best clinical application of predictive modeling is whether a single cut point should be applied to an entire population or whether condition-specific variations in risk should be incorporated. Given that different conditions may have varying impacts on incurred costs, identification algorithms that calculate con-dition-specific cut points may increase model performance for determining the most appropriate members for popula-tion health initiatives.
In an effort to improve the accuracy of identification pro-cesses that utilize predictive modeling scores, the purpose of this study is to compare the performance achieved through various methods of cut point selection. We assessed: (a) whether the use of an evidence-based cut point outperforms a more arbitrarily-determined cut point in terms of predicting high future health care costs, and (b) if condition-specific cut points are more accurate at predicting high future costs than a uniform method of screening using a single cut point.
Methods
Participants
The study population included adult (18 years of age) members of a Maryland Medicaid health plan who were continuously enrolled during the entire 2-year study period ( January 2007–December 2008) and who had at least 1 of the following chronic conditions traditionally targeted by CM programs: asthma, diabetes, chronic obstructive pulmonary disease, congestive heart failure, hypertension, malignancies, arthritis, and depression (n¼6459 of 10,824 Medicaid
en-FIG. 1. Calculating the optimal cut point using the Receiver Operating Characteristic (ROC) curve.
rollees, or 60%). Table 1 provides a description of the de-mographic characteristics of the study population who had at least 1 chronic condition, as compared to the larger pop-ulation of continuously enrolled Medicaid members. Nearly two thirds of the study population was female, with a mean age of 44 years. The overall health risk of the study popu-lation was higher than the larger Medicaid popupopu-lation, as indicated by the ACG-PM scores. The majority of the study population had multiple chronic conditions; the most com-mon condition was hypertension.
Data
The analyses used administrative health plan data span-ning the period from January 2007 through December 2008 to determine chronic illness, compute ACG-PM risk scores, and calculate yearly costs incurred.International Classification of Diseases, Ninth Revision (ICD-9) codes, National Drug Codes (NDC), laboratory results, and clinician-entered di-agnoses on payment authorization forms were used to de-termine the presence of chronic illness. ICD-9 and NDC codes, age, and sex were input into the Johns Hopkins ACG Case-Mix System 8.0.1 to compute individual-level ACG-PM risk scores based on the previous 12 months of data.
The ACG-PM risk score from Year 1 ( January–December, 2007) was used to predict health care costs in the following year ( January–December, 2008). The outcome variable from Year 2 was a binary measure of total cost (ie, sum of paid medical and pharmacy claims incurred in 2008) that indi-cated whether a participant was ranked in the top 5% of highest cost members from the entire Medicaid population. The target for CM services was set at the top 5% based on the capacity of the program and the evidence suggesting that only a small percentage of the population is responsible for a large portion of health care costs,2although the analysis was replicated using the top 1% and top 10% as targets to ensure the generalizability of the results.
Analysis
The analyses assessed the performance of 3 cut point ap-proaches at identifying future high-cost members
a) Single Arbitrary Cut Pointused the cumulative distribu-tion of the ACG-PM risk score to determine the cut point that designated the members with the top 5% highest risk. b) Single Optimal Cut Pointused the ROC curve to calcu-late the ‘‘optimal’’ ACG-PM cut point, defined as the point closest to the (0,1) coordinate. A single cut point was calculated for the entire study population regard-less of condition.
c) Condition-Specific Cut Pointused the ROC curve to cal-culate separate ‘‘optimal’’ ACG-PM cut points for each condition. Members were identified if their ACG-PM score exceeded any of the applicable condition-specific cut points.
Model performance was characterized by calculating the sensitivity, specificity, and PPV achieved using each of the three cut point approaches. In addition, logistic regression was used to calculate thecstatistic that estimated the prob-ability of making a correct prediction using each approach. All of the analyses were conducted using SAS version 9.2 (SAS Institute Inc., Cary, NC).
In an ideal setting, the ‘‘best’’ approach would be one that maximizes all 4 performance measures (ie, sensitivity, speci-ficity, PPV,cstatistic). However, because of the inverse rela-tionship between sensitivity and specificity, efforts to increase one are usually achieved at the expensive of the other. Thus, choosing between multiple well-performing approaches is done by considering the trade-off between the ‘‘cost’’ of a false positive and a false negative.17–19 For instance, if program capacity is limited, specificity may outweigh sensitivity to ensure that resources are allocated to those most likely to benefit, although a larger number of future high-cost mem-bers may be missed. On the other hand, for conditions that typically require a high, and costly, level of care, sensitivity may be of higher value to ascertain that as many of these members are identified as possible, even if the consequence is a higher level of false positives (ie, a lower specificity). An-other important consideration when choosing between cut points is the number of people identified. Ideally this number should stay within a range that can be adequately managed by program resources.
Results
Cut point values
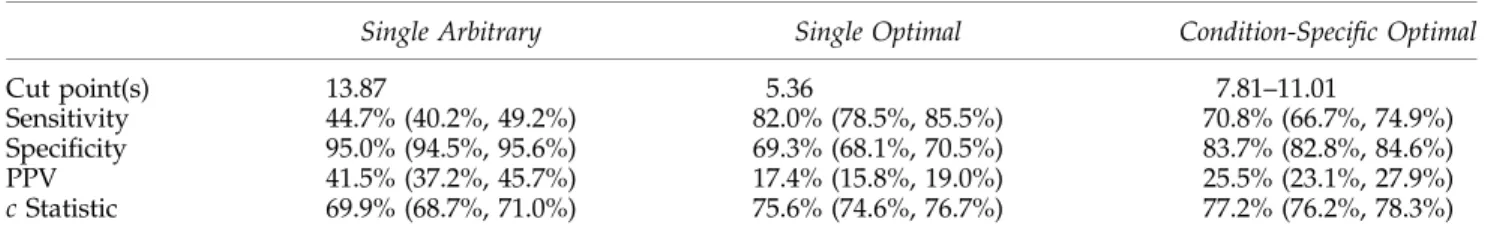
The 3 approaches all identified different ACG-PM risk scores as the cut point. The ‘‘arbitrary’’ threshold value of 13.87, based on a dichotomization of the ACG-PM score at the high end of the scale to match the proportion of members that could be managed, was much higher than the calculated ‘‘optimal’’ cut point (5.36, Table 2). The condition-specific optimal cut points fell between the values for the single cut points and ranged from 7.81 for asthma to 11.01 for con-gestive heart failure (Table 3).
Performance comparisons for each cut point approach
For an overall assessment of predictive accuracy, the c
statistic results indicate that the condition-specific optimal
Table1. Demographic Characteristics: Study Population vs. Entire Continuously
Enrolled Medicaid Population
Characteristic Study Population Medicaid Population N 6,459 10,827 Percent female 66.11% 61.77%
Mean age (range) 43.95 (18–64) 38.94 (18–64) Condition prevalence (%) Hypertension 53.23% 31.75% Depression 45.92% 27.39% Diabetes 37.28% 22.24% Asthma 24.82% 14.81% Arthritis 24.60% 14.68% COPD 14.99% 8.94% Malignancies 9.00% 5.37% CHF 7.66% 4.57% Any (1þ) conditions 100.00% 59.66% Multiple (2þ) conditions 60.33% 35.99% Mean ACG-PM (range) 5.56 (0–48.89) 4.01 (0–48.89)
ACG-PM, Adjusted Clinical Groups Predictive Model; CHF, congestive heart failure; COPD, chronic obstructive pulmonary disease.
cut point approach yielded the highest probability of a cor-rect prediction, followed closely by the single optimal cut point method. The single arbitrary cut point exhibited the lowest overall accuracy, as reported in Table 2.
In addition to the c statistic, model assessments can be conducted based on other performance indicators (ie, sensi-tivity, specificity, PPV). As indicated in Table 2, although the single arbitrary cut point had the highest specificity, it failed to detect over half of the future high cost members. When comparing the 2 evidence-based cut point approaches, the condition-specific optimal cut point approach resulted in a lower sensitivity than the single optimal cut point, but both the specificity and the PPV were higher.
Further comparisons can be made when considering the number of members identified for intervention by each cut point approach, as shown in Table 3. Because the single ar-bitrary cut point had the highest risk score value, and the lowest sensitivity, it identified the smallest number of mem-bers for program outreach. The single optimal cut point used the lowest risk score value and identified the largest number of members. The number of members identified by the con-dition-specific optimal cut point approach fell in between.
Discussion
This study is the first to examine how best to utilize pre-dictive modeling scores in a health care setting to improve the identification process for CM programs and other pop-ulation health initiatives. Our results suggest that an em-pirically-calculated predictive modeling cut point achieves better performance at identifying appropriate candidates than an arbitrary cut point. Not only was the overall
prob-ability of making a correct prediction higher using evidence-based cut points, but significant improvements in sensitivity were achieved while still maintaining relatively high speci-ficity rates.
This is also the first study to demonstrate the relative var-iation in optimal cut points among different chronic condi-tions. For the chronically-ill Medicaid study population, utilization of condition-specific optimal cut points identified a smaller (eg, more manageable) number of members than the single optimal cut point, while achieving similar, if not better, measures of model performance. Armed with the knowledge that there is value in differentiating among conditions when determining a cut point, CM programs can optimize targeting algorithms and overall strategies for population health management.
The biggest challenge for CM programs in adopting this methodology will be in handling the additional members identified for programs when applying an evidence-based cut point. This study showed that a condition-specific optimal cut point often has a lower threshold than an arbitrary cut point designed to target only the highest risk members. A likely consequence of lowering the cut point is the identification of more participants, as found here. One way that CM programs can handle this larger caseload is by adopting a population health strategy for varying levels of risk. For instance, a CM program could provide intensive nurse case management for those with the highest predictive modeling scores above the optimal cut point, while providing telemonitoring and condition-specific education for members with lower risk scores that are still above the optimal cut point. In this model, ongoing monitoring for changes in member risk, as evidenced by predictive modeling scores and/or symptoms witnessed
Table2. Performance Comparison for Each Cut Point Selection Approach
Single Arbitrary Single Optimal Condition-Specific Optimal
Cut point(s) 13.87 5.36 7.81–11.01
Sensitivity 44.7% (40.2%, 49.2%) 82.0% (78.5%, 85.5%) 70.8% (66.7%, 74.9%)
Specificity 95.0% (94.5%, 95.6%) 69.3% (68.1%, 70.5%) 83.7% (82.8%, 84.6%)
PPV 41.5% (37.2%, 45.7%) 17.4% (15.8%, 19.0%) 25.5% (23.1%, 27.9%)
cStatistic 69.9% (68.7%, 71.0%) 75.6% (74.6%, 76.7%) 77.2% (76.2%, 78.3%)
Note: Includes 95% confidence intervals in parentheses. PPV, positive predictive value.
Table3. Members Identified by Each Cut Point Selection Approach
Condition-Specific Optimal Cut Point # Members with Condition
# (%) of Members Identified by Each Cut Point Approach Condition Single Arbitrary Single Optimal Condition-Specific Optimal Hypertension 7.89 3824 375 (9.8%) 1575 (41.2%) 899 (23.5%) Depression 7.88 3250 317 (9.8%) 1216 (37.4%) 683 (21.0%) Diabetes 7.89 2543 246 (9.7%) 1059 (41.6%) 602 (23.7%) Asthma 7.81 1868 191 (10.2%) 770 (41.2%) 406 (21.7%) Arthritis 7.88 1851 172 (9.3%) 825 (44.6%) 402 (21.7%) COPD 8.63 1206 195 (16.2%) 662 (54.9%) 330 (27.4%) Malignancies 10.59 672 150 (22.3%) 428 (63.7%) 206 (30.7%) CHF 11.01 613 151 (24.6%) 440 (71.8%) 180 (29.4%)
Total (Any Condition) Multiple 6459 509 (7.9%) 2225 (34.4%) 1310 (20.3%)
by a nurse case manager (for program enrollees) is key to detect changes in individuals’ program intensity needs throughout their condition trajectory.
Another challenge to using this methodology is choosing a cut point for members with multiple chronic conditions (eg, 60% of the study population). A conservative approach would be to choose the lowest condition-specific cut point among all of the possible cut points for the constellation of conditions that the member may have, as done in this study. As the results suggest, better model performance can be achieved when targeting members who exceeded any of their applicable condition-specific cut points rather than applying a single optimal cut point uniformly across all chronically-ill members.
The current analysis aimed to predict the health plan members with the top 5% highest health care costs in Year 2. This percentage was determined based on the health plan’s CM program capacity and anticipated uptake. To ensure that the findings could be generalized to targeted populations of varying sizes, the analysis was replicated using targets of 1% and 10% and the same pattern of results emerged.
When reviewing these findings, it is important to keep in mind the limitations of our study design that may impact the generalizability of the results. For the analyses, our study population was limited to adult members enrolled in a Maryland Medicaid Managed Care health plan for approxi-mately 2 consecutive years and who were diagnosed with a chronic condition, as evidenced by multiple data sources (eg, medical and pharmacy claims, authorizations, encounters, and laboratory results). It is possible that a different conclu-sion could have been drawn for children or seniors, for members of a commercial or other non-Medicaid health plan population, or for another locality. The results may also differ by length of continuous enrollment. Another limitation is the reliance on claims and other health care service-related data for diagnosing conditions. It is possible that the prevalence of chronic illness in our population is underreported for those who have not sought treatment and thus do not have the diagnosis documented in medical records.
Another important consideration is recognizing that the goal of program identification in this study was to predict future high-cost members, where sensitivity and specificity were valued equally. Different conclusions could have been drawn if the success of program identification was measured by something other than cost containment, and if different values were placed on the cost of a false positive versus a false negative. When the latter is true, alternative methods are also available to calculate an optimal cut point.12,20 However, when sensitivity and specificity are given equal weight, the traditional formulas for calculating the optimal cut point tend to reach similar conclusions.15
It should also be noted that this study used the ACG-PM system to assess the risk of high future health care expen-ditures. There are multiple software products that produce a predictive modeling score for the same purpose using data inputs and methodologies that are different than the ACG Case-Mix System. The results of this study may differ when using a different predictive model.
Despite these limitations and the challenges associated with implementation of the recommended cut point meth-odology, this study shows that with greater customization of cut points to the condition(s) that a health plan member may
have, members can be optimally targeted for CM programs. This is beneficial for members in that they will have a greater opportunity to benefit from programs and services. Payers will also benefit from the increased efficiency in targeting and eventually enrolling the members with the greatest health care service needs, which should result in the im-provement and/or stabilization of chronic health conditions, thereby reducing future health care costs.
Author Disclosure Statement
Ms. Murphy, Ms. Castro, and Dr. Sylvia disclosed no conflicts of interest.
References
1. California HealthCare Foundation. Snapshot: Health Care Costs 101, 2008 Edition. Available at: http://www.chcf.org/ */media/Files/PDF/H/HealthCareCosts08.pdf. Accessed March 11, 2008.
2. Bodenheimer T, Fernandez A. High and rising health care costs. Part 4: Can costs be controlled while preserving quality? Ann Intern Med 2005;143:26–31.
3. Baan CA, Ruige JB, Stolk RP, et al. Performance of a pre-dictive model to identify undiagnosed diabetes in a health care setting. Diabetes Care 1999;22:213–219.
4. Sylvia ML, Shadmi E, Hsiao CJ, Boyd CM, Schuster AB, Boult C. Clinical features of high-risk older persons identi-fied by predictive modeling. Dis Manag 2006;9:56–62. 5. Cousins MS, Shickle LM, Bander JA. An introduction to
predictive modeling for disease management stratification. Dis Manag 2002;5:157–167.
6. Weir S, Aweh G, Clark RE. Case selection for a Medicaid chronic care management program. Health Care Financ Rev 2008;30:61–74.
7. Weiner J, Abrams C. ACG Software Documentation/Users Manual, Version 5.0. Baltimore, MD: Johns Hopkins Uni-versity Bloomberg School of Public Health, Health Services Research & Development Center; 2001.
8. The Johns Hopkins University ACG Case-Mix System. About ACGs. Available at: http://www.acg.jhsph.edu/ html/AboutACGs.htm. Accessed March 30, 2009.
9. Reid RJ, MacWilliam L, Verhulst L, Roos N, Atkinson M. Performance of the ACG case-mix system in two Canadian provinces. Med Care 2001;39:86–99.
10. Reid R, Roos N, MacWillliam L, Frohlich N, Black C. As-sessing population health care need using a claims-based ACG morbidity measure: A validation analysis in the province of Manitoba. Health Serv Res 2002;37:1345–1364. 11. Adams EK, Bronstein JM, Raskind–Hood C. Adjusted
clin-ical groups: Predictive accuracy for Medicaid enrollees in three states. Health Care Financ Rev 2002;24:43–61. 12. Perkins NJ, Schisterman EF. The inconsistency of "optimal"
cutpoints obtained using two criteria based on the re-ceiver operating characteristic curve. Am J Epidemiol 2006; 163:670–675.
13. Selby JV, Karter AJ, Ackerson LM, Ferrara A, Liu J. Devel-oping a prediction rule from automated clinical databases to identify high-risk patients in a large population with dia-betes. Diabetes Care 2001;24:1547–1555.
14. Sylvia ML, Griswold M, Dunbar L, Boyd CM, Park M, Boult C. Guided care: Cost and utilization outcomes in a pilot study. Dis Manag 2008;11:29–36.
15. Gonen M.Analyzing Receiver Operating Characteristic Curves with SAS. Cary, NC: SAS Institute Inc.; 2007.
16. Loesche WJ, Taylor G, Giordano J, et al. A logistic regression model for the decision to perform access surgery. J Clin Periodontol 1997;24:171–179.
17. Coffin M, Sukhatme S. Receiver operating characteristic studies and measurement errors. Biometrics 1997;53:823–837. 18. Rochester MA, Pashayan N, Matthews F, Doble A, McLoughlin J. Development and validation of risk score for predicting positive repeat prostate biopsy in patients with a previous negative biopsy in a UK population. BMC Urol 2009;9:7. 19. Klein S, Alexander DA, Hutchinson JD, Simpson JA,
Simp-son JM, Bell JS. The Aberdeen trauma screening index: An instrument to predict post-accident psychopathology. Psy-chol Med 2002;32:863–871.
20. Kristjansson B, Hill G, McDowell I, Lindsay J. Optimal cut-points when screening for more than one disease state: An example from the Canadian study of health and aging. J Clin Epidemiol 1996;49:1423–1428.
Address correspondence to:
Shannon Murphy Johns Hopkins HealthCare LLC 6704 Curtis Court Glen Burnie, MD 21060 E-mail:[email protected]