166
© Global Society of Scientific Research and Researchers
http://asrjetsjournal.org/
Developing Detection Technique of Arrhythmia using
Basic ECG Parameters
A.H.M Iftekharul Ferdous
a*,
Md. Ziaul Haque Bhuiyan
b, Ashfak Uddin
Ahmed
c, Arif Mohammad Faisal
daDept. of EEE, Pabna University of Science and Technology,Bangladesh b,c,dDept. of EEE, Islamic University of Technology,Bangladesh
aEmail: [email protected]
Abstract
Arrhythmia is simply known as the irregular or abnormal beating of heart. This paper presents a procedure to extract information from Electrocardiogram (ECG) data and determine types of Arrhythmias. The decisions were achieved by determining different intervals such as PR Interval, RR Interval, Heart Rate (HR) etc. and those intervals were compared with the ideal intervals. During the whole process ECG signals were taken from PhysioBank ATM and Savitzky–Golay filter was used to reduce the noise of the signal. Tachycardias, Bradycardia, Heart Block, Junctional Arrhythmia, Premature Articular Contraction were detected during this analysis and the results show simplified detection of arrhythmia.
Keywords: Electrocardiogram; Arrhythmia; PR Interval; RR Interval; Heart Rate.
1. Introduction
An arrhythmia is the abnormal rhythm of heart. It is also known as dysrhythmia. It causes the heart to pump less effectively. There are a lot of changes in the shape of the heart wave because of arrhythmia. ECG is a common term in the diagnosis of cardiac diseases. It provides information about the electrical activity of the heart. We can detect different kinds of heart diseases by analyzing the ECG signal. Higher efficiency in classifying ECG signal is very important nowadays. There are different sorts of arrhythmias. Different kinds of arrhythmias can be detected in different parts of the heart. Heart pumps blood in a regular way. But when it is affected by arrhythmia, it can’t pump blood normally.
--- * Corresponding author.
167
Right bundle branch block (RBBB), left bundle branch block (LBBB), premature ventricular contractions (PVC), ventricular fibrillation (VF) are some serious arrhythmias. However ECG being a non-stationary signal, the irregularities may not be periodic and may not show up all the time, but would manifest at certain irregular intervals during the day. So, continuous ECG monitoring permits observation of cardiac variations over an extended period of time, either at the bad side or when patients are ambulatory, providing more information to physician. The heart rate and the morphology reflect the cardiac health of human heart beat [1]. It is a noninvasive method which means this signal is measured on the surface of human body, which is used in identification of the heart diseases [2].
1.1 Electrocardiography
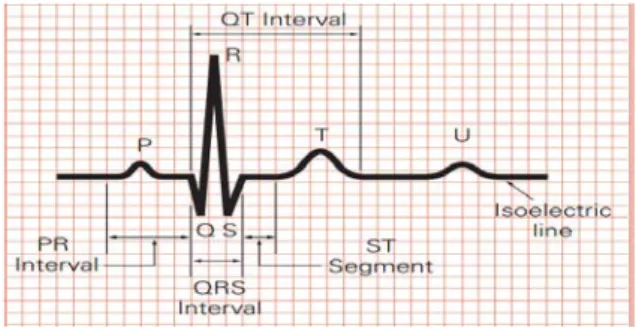
Electrocardiography is the recording of the electrical activity of the heart. A typical ECG tracing of the cardiac cycle (heartbeat) consists of a P wave, a QRS complex, a T wave, and a U wave.
Figure 1.1: Typical ECG Signal
For Arrhythmia detection we went through the Time Domain based technique. The technique is followed by ECG signal processing, determination of PR Interval, QRS Interval, QT Interval, ST segment, RR Interval (To determine Heart Rate) followed by Arrhythmia detection via decision making rules.
Table 1.1: Normal ECG Signal Characteristics
Component Characteristics
Heart Rate 60-100 BPM PR Interval 0.12-0.2 sec QRS Interval 0.06-0.10 sec
QT Interval Less than half of the R-R interval ST segment 0.08 sec
2. Proposed ECG based Arrhythmia detection:
168
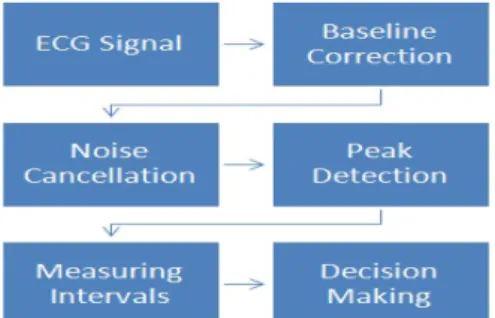
Figure 1, we can see a typical ECG signal showing P, Q, R, S, T & U points including PR Interval, QRS Interval, QT Interval, ST Segment, Isoelectric line. The ECG parameters shown in Table 1 are important in finding the arrhythmia. Our proposed method is described using the flow diagram shown in Figure 2.1.
Figure 2.1: Flow diagram for proposed method
Firstly, here is the ECG signal shown in Figure 2.2. This is a noisy signal with variable baseline. Also the peaks cannot be detected easily.
Figure 2.2: Actual ECG Signal
2.1Baseline Correction and Signal Smoothing
The original ECG Signal is fed through smoothing filters. At the output of the smoothing filter, baseline of the signals was corrected and is shown in Figure 2.3.
Figure 2.3: Baseline Corrected ECG Signal
0 200 400 600 800 1000 1200 1400 1600 1800 2000 -1 -0.5 0 0.5 1 1.5 2
Signal with a Trend
Samples V ol tage( m V )
Noisy ECG Signal
0 200 400 600 800 1000 1200 1400 1600 1800 2000 -1 -0.8 -0.6 -0.4 -0.2 0 0.2 0.4 0.6 0.8 1
Detrended ECG Signal
Samples V ol tage( m V )
169
2.2 Noise cancellation using Savitzky–Golay FilterSavitzkey-Golay filter is used to cancel the noise in the ECG signal. Savitzkey-Golay filter is widely known for its signal noise cancellation. The ECG signal after using Savitzkey-Golay filter is shown in Figure 2.4.
Figure 2.4: Noise cancellation using Savitzky–Golay Filter
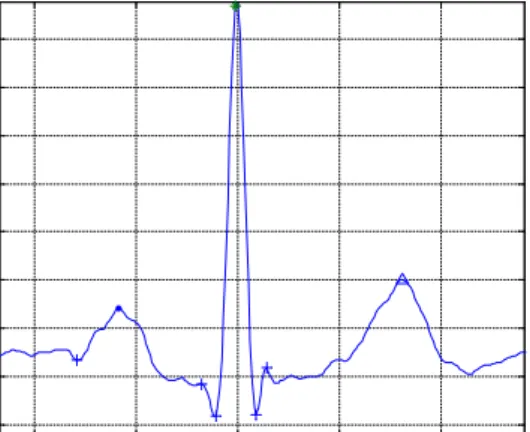
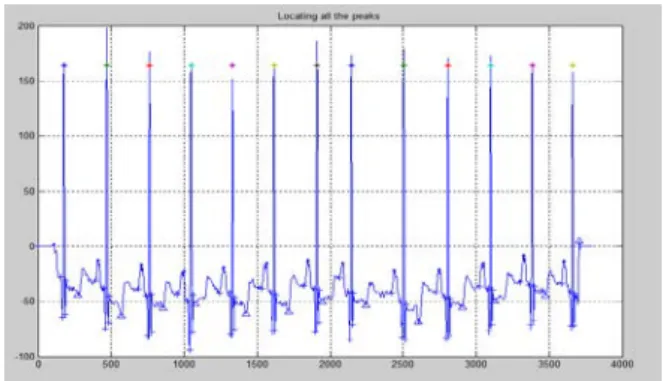
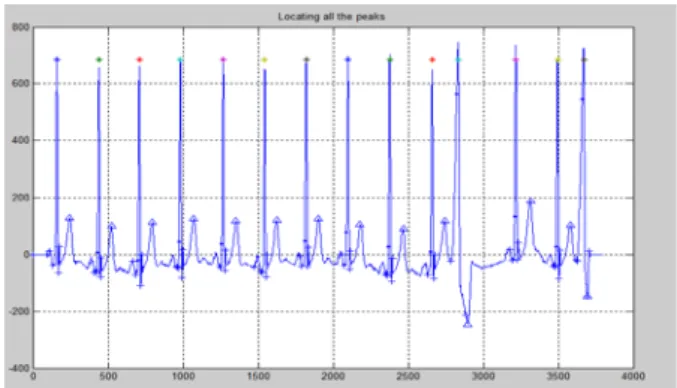
2.3 Locating Peaks
P, Q, R, S, T peak detection is a tough task. Especially, when the ECG signal is not normal, more than two peaks are found. We used a algorithm to eliminate the unnecessary peaks. After using the algorithm, the program was able find the peaks in all conditions. Figure 6 shows the detection of peaks.
Figure 2.5: Peak Detection
2.4 Measuring Intervals
After locating peak points, different intervals, such as: PR Interval, QRS Interval, QT Interval, ST segment, RR Interval were measured.Heart Rate (HR) can be measured.
2.5 Decision Making 550 600 650 700 750 800 850 0 100 200 300 400 500 600 700
Filtering Noisy ECG Signal
400 450 500 550 600 -150 -100 -50 0 50 100 150 200 250
170
We have consulted with different cardiologists for decision making process and finally came up with six decision making rules.
Sample MATLAB Code used in our program is given below:
if f1>0 && f2==0 && f3==0; disp ('Heart Rate Normal')
else if f2>0 && f3==0; disp ('Tachycardia')
else if f3>0 && f2==0; disp ('Bradycardia')
% else if f3>0 && f2>0; disp ('PACs detected')
else if f5>0; disp ('Heart Block Detected')
3. Simulation & Result
For this evaluation, confusion matrix criteria was taken into account. The popular MIT-BIH database is used for extracting ECG beats of different arrhythmia for simulation.
3.1 Simulation Database
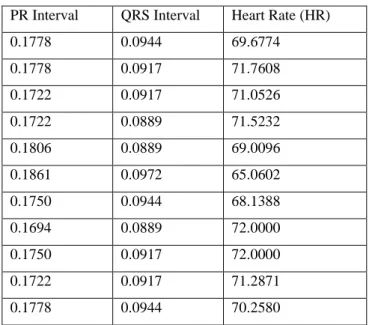
In our proposed method, we have used MIT-BIH arrhythmia database [17]. The ECG recordings are sampled at 360 samples per second per channel with eleven beat resolution over a 10 mV range. The signal 103 is used from MIT-BIH database [17] to calculate different intervals. Heart rate is also calculated from different sample of that signal. These intervals for 11 samples from 103 number dataset is shown in Table 3.1.
Table 3.1: Extracted data from ECG Signal
PR Interval QRS Interval Heart Rate (HR)
0.1778 0.0944 69.6774 0.1778 0.0917 71.7608 0.1722 0.0917 71.0526 0.1722 0.0889 71.5232 0.1806 0.0889 69.0096 0.1861 0.0972 65.0602 0.1750 0.0944 68.1388 0.1694 0.0889 72.0000 0.1750 0.0917 72.0000 0.1722 0.0917 71.2871 0.1778 0.0944 70.2580
171
Figure 3.1: Testing Signal #100(Normal signal)
Figure 3.2: Testing Signal #103(Normal signal)
Figure 3.3: Testing Signal #114-1(PVC)
172
Figure 3.5: Testing Signal #116(PVC)
Figure 3.6: Testing Signal #108(Heart Block)
Figure 3.7: Testing Signal #231-1(Heart Block)
173
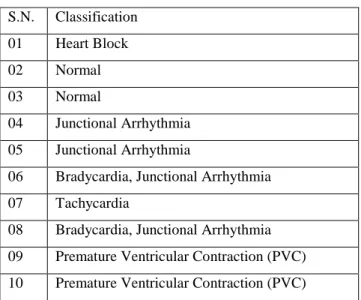
After using our program and simulation, the arrhythmias are detected and compared with the database results and are listed below at Table 3.2
Table 3.2: Arrhythmia Detection from different sample
S.N. Classification 01 Heart Block 02 Normal 03 Normal 04 Junctional Arrhythmia 05 Junctional Arrhythmia
06 Bradycardia, Junctional Arrhythmia 07 Tachycardia
08 Bradycardia, Junctional Arrhythmia 09 Premature Ventricular Contraction (PVC) 10 Premature Ventricular Contraction (PVC)
4. Calculated data & Comparison
Table 4.1: Confusion matrix table
Type Normal Heart Block PVC
Normal 627 7 10
Heart Block 3 319 0
PVC 4 18 237
Table 4.2: Sensitivity calculation
Type Sensitivity Overall sensitivity
Normal 97.36%
Heart Block 99.37% 96.08%
PVC 91.51%
Table 4.3: Specificity calculation
Type Specificity Overall Specificity
Normal 96.95%
95.66% Heart Block 97.36%
174
So, our overall efficiency is 89%Sensitivity is 96.08% and
Specificity is 95.66% .
5. Conclusion
In this paper, we’ve shown a program to identify features from an ECG signal and detect different sorts of Arrhythmia. To test our program we’ve used data files (in .mat format) taken from Physio Bank ATM of MIT-BIH database. At first the efficiency was quite low because we tested very few data from the database. After that, we increased the number of samples and data and have found more efficient result. Randomly we have selected ECG beats. Decision making rules were made taking help from several cardiologists. Five-step procedure was taken to find the arrhythmia. The results shown here gives an easy way to detect different arrhythmias. To improve the accuracy further, we had to increase the number of parameters in the decision making process. That helped us to improve the calculated sensitivity, specificity and accuracy which were good.
5. Future Work
There are a lot of other methods which can be combined with our proposed method. By this combination, we hope our result will be more efficient and also by using more data, the result will be more efficient We have classified only normal, Bradycardia, Tachycardia, heart block and PVC ECG signals. In future, we will try to classify other types of abnormal ECG signals. We have used MIT-BIH database [17]. We can use other databases in the future and we will try to create our own database.
References
[1]. Wen Wei and Jerry M. Mendel, “A Fuzzy Logic Method for Modulation Classification in Nonideal Environments”, IEEE Transactions on Fuzzy Systems, Vol. 7, No. 3, June 1999, pp. 333-344.
[2]. Tomoharu Nakashima, Gerald Schaefer, Yasuyuki Yokota, HisaoIshibuchi, “A weighted fuzzy classifier and its application to image processing tasks”, Fuzzy Sets and Systems 158, 2007, pp. 284 – 294.
[3]. Reza Boostani, MojtabaRismanchib, Abbas Khosravani, LidaRashidi, SamanehKouchaki, PayamPeymani, SeyedTaghiHeydari, B. Sabayan, K. B. Lankarani, “Presenting a hybrid method in order to predict the 2009 pandemic influenza A (H1N1)”, Advanced Computing: An International Journal ( ACIJ ), Vol.3, No.1, January 2012, pp. 31-43.
[4]. Ken Nozaki, HisaoIshibuchi and Hideo Tanaka, “Adaptive Fuzzy Rule-Based Classification Systems”, IEEE Transactions on Fuzzy Systems, Vol. 4, No. 3, 1996, pp. 238-250.
[5]. Jia Zeng and Zhi-Qiang Liu, “Type-2 Fuzzy Sets for Pattern Recognition: The State-of-the-Art”, Journal of Uncertain Systems, Vol.1, No.3, 2007, pp. 163-177.
[6]. F. Hoffmann, B. Baesens, J. Martens, F. Put and J. Vanthienen, "Comparing a genetic fuzzy and a Neuro-fuzzy classifier for credit scoring", presented at Int. J. Intell. Syst., 2002, pp. 1067-1083.
175
[7]. F.M. Schleif, T. Villmann, B. Hammer, “Prototype based Fuzzy Classification in Clinical Proteomics”, International Journal of Approximate Reasoning, 2008, 47(1), pp. 4-16.
[8]. Aaron K. Shackelfordand Curt H. Davis, “A Hierarchical Fuzzy Classification Approach for High-Resolution Multispectral Data Over Urban Areas”, IEEE Transactions on Geo-science And Remote Sensing, Vol. 41, No. 9, September 2003, pp. 1920-1932.
[9]. Benoit Mandelbrot, “How long is the coast of Britain?” Science, New Series, Vol. 156, No. 3775, May 5, 1967, pp. 636-638.
[10]. B. Mandelbrot, “The fractal geometry of nature”, Wh. Freeman, 1983.
[11]. S. Raghav and K. Misra, “Fractal Feature Based ECG Arrhythmia Classification”, IEEE, 2008, pp. 1-5. [12]. L. Y. Shyu, Y. H. Wu, and W. C. Hu, “Using wavelet transform and fuzzy neural network for VPC
detection from the holter ECG,” IEEETrans. Biomed. Eng., vol. 51, no. 7, pp. 1269–1273, Jul. 2004 [13]. Z. Benyd L. Czinege, Computer Analysis of Dynamic Systems with Application in Physiology, Proc
IS" Worldcongress of MACS on Scient$c Computation, Modelling and Applied Mathematics.Berlin, 1997. Vol. El. pp. 663-668.
[14]. V. Kecman, Learning and Soft Computing Support vector machines Neural Networks-Fuzzy Logic, MIT, 2001
[15]. HA Guvenir, B Acar, Feature Selection using a Genetic Algorithm forthe detection of abnormal ECG recordings, International Conference onMachineLearning,Florida, 2001.
[16]. ECG Notes Interpretation & Management Guide, Shirley A. Jones [17]. Online resource for physiologicalSignals. http://www.physionet.org