Human Protein Function Prediction:
application of machine learning for integration
of heterogeneous data sources
Anna Lobley
A dissertation submitted in partial fulfilment of the requirements for the degree of
Doctor of Philosophy of
University College London.
Department of Biochemistry University College London
I, Anna Lobley, confirm that the work presented in this thesis is my own. Where infor-mation has been derived from other sources, I confirm that this has been indicated in the thesis.
Abstract
Experimental characterisation of protein cellular function can be prohibitively expensive and take years to complete. To address this problem, this thesis focuses on the development of com-putational approaches to predict function from sequence. For sequences with well characterised close relatives, annotation is trivial, orphans or distant homologues present a greater challenge. The use of a feature based method employing ensemble support vector machines to predict indi-vidual Gene Ontology classes is investigated. It is found that different combinations of feature inputs are required to recognise different functions. Although the approach is applicable to any human protein sequence, it is restricted to broadly descriptive functions. The method is well suited to prioritisation of candidate functions for novel proteins rather than to make highly accu-rate class assignments.
Signatures of common function can be derived from different biological characteristics; inter-actions and binding events as well as expression behaviour. To investigate the hypothesis that common function can be derived from expression information, public domain human microar-ray datasets are assembled. The questions of how best to integrate these datasets and derive features that are useful in function prediction are addressed. Both co-expression and abundance information is represented between and within experiments and investigated for correlation with function. It is found that features derived from expression data serve as a weak but significant signal for recognising functions. This signal is stronger for biological processes than molecular function categories and independent of homology information.
The protein domain has historically been coined as a modular evolutionary unit of protein func-tion. The occurrence of domains that can be linked by ancestral fusion events serves as a signal for domain-domain interactions. To exploit this information for function prediction, novel do-main architecture and fused architecture scores are developed. Architecture scores rather than single domain scores correlate more strongly with function, and both architecture and fusion scores correlate more strongly with molecular functions than biological processes.
The final study details the development of a novel heterogeneous function prediction approach designed to target the annotation of both homologous and non-homologous proteins. Support vector regression is used to combine pair-wise sequence features with expression scores and domain architecture scores to rank protein pairs in terms of their functional similarities. The target of the regression models represents the continuum of protein function space empirically derived from the Gene Ontology molecular function and biological process graphs. The merit and performance of the approach is demonstrated using homologous and non-homologous test datasets and significantly improves upon classical nearest neighbour annotation transfer by se-quence methods. The final model represents a method that achieves a compromise between high specificity and sensitivity for all human proteins regardless of their homology status. It is expected that this strategy will allow for more comprehensive and accurate annotations of the human proteome.
Acknowledgements
First and foremost I would like to acknowledge my supervisors Prof. D T Jones and Prof. C A Orengo for their encouragement and excellent guidance throughout my project.
I would also like to thank members of the Jones and Orengo groups especially Drs S. Lise and O. Redfern for helpful discussions. I acknowledge both UCL and CS department computing services for allowing me to gobble many CPU hours, abuse high memory machines and regularly destroy their exquisite computing infrastructure in order to complete my work.
Lastly and most importantly, I acknowledge close friends, family (Dad especially for proof read-ing) and Dr. Richard Myers for his support and patience.
1 Introduction 16
1.1 The importance of protein function . . . 16
1.2 The need for automated methods . . . 17
1.3 Function annotation schemes . . . 18
1.3.1 Multifun, FunCat and KEGG hierarchical schemes . . . 19
1.3.2 The Gene Ontology . . . 19
1.3.3 Modelling function similarity. . . 27
1.4 Automated function prediction methods. . . 30
1.4.1 Homology based approaches . . . 31
1.4.2 Non-homology based approaches . . . 41
1.4.3 Integrated function prediction approaches . . . 55
1.5 Thesis aims . . . 61
2 Characterising the system: the Gene Ontology and Human proteome an-notations 63 2.1 Chapter aims . . . 63
2.2 Shape and structure of the Ontology Graphs . . . 64
2.3 Human proteome annotations . . . 65
2.4 Annotation specificity and completeness . . . 69
2.7 Chapter Summary . . . 75
3 Quantifying homology based annotation transfer 79 3.1 Chapter introduction and aims . . . 79
3.2 Conducting homology searches . . . 82
3.2.1 Datasets . . . 82
3.2.2 Scoring sequence similarity . . . 82
3.2.3 Scoring annotation transfers . . . 85
3.3 Global scoring for annotation transfer . . . 87
3.3.1 Comparing Molecular Function and Biological Process annotation transfer. . . 89
3.3.2 Performance of BLAST and PSI-BLAST algorithms . . . 92
3.3.3 Within and between species transfer . . . 93
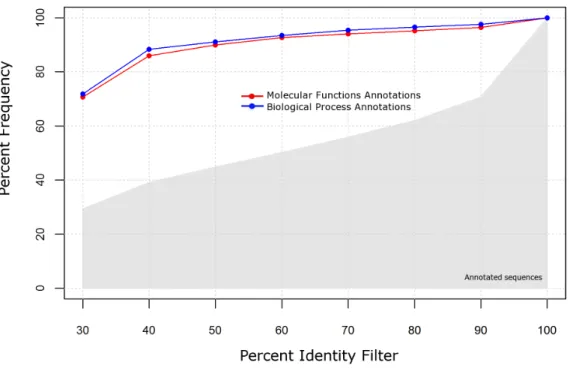
3.4 Annotation specificities . . . 93
3.5 Sources of errors . . . 96
3.6 Local scoring and functional heterogeneity . . . 101
3.7 Discussion . . . 106
4 Feature based function prediction 111 4.1 Chapter aims . . . 111
4.2 Designing features encoding disorder . . . 113
4.2.1 Functional analysis of disordered human sequences . . . 113
4.2.2 Encoding strategy for disorder features . . . 115
4.3.1 Training and testing datasets . . . 127
4.3.2 Kernel choice and parameter optimisation . . . 128
4.3.3 Function Category Classification Results . . . 129
4.3.4 Assessing the importance of different features in function prediction . . . 133
4.4 Benchmarking against ProtFun method . . . 137
4.4.1 FFPred Server . . . 140
4.5 Chapter Summary . . . 148
5 Designing pairwise features for function prediction 150 5.1 Introduction and aims. . . 150
5.2 Defining a Function Similarity Measure . . . 151
5.2.1 Selection of a semantic similarity measure . . . 152
5.2.2 Function similarity measures . . . 155
5.3 Feature design for heterogeneous data . . . 155
5.3.1 Sequence Similarity . . . 157
5.3.2 Protein-protein Interactions . . . 159
5.3.3 Topology . . . 160
5.3.4 Cellular Localisation . . . 165
5.3.5 Domain content and domain fusions . . . 167
5.3.6 Microarray expression information . . . 184
5.3.7 Characterising feature relationships . . . 200
benchmark 205
6.1 Introduction and aims. . . 205
6.2 Methods . . . 207
6.2.1 Vector space integration . . . 207
6.2.2 Data source integration method . . . 210
6.2.3 Support Vector Regression training . . . 213
6.2.4 Integrating complex features . . . 216
6.3 Results and model application . . . 222
6.3.1 Technical performance of the different model integration approaches . . . 223
6.3.2 Practical assessment of model quality in annotation transfer . . . 224
6.3.3 Establishing the value of different data sources . . . 227
6.3.4 Annotation of uncharacterised human sequences . . . 232
6.4 Chapter Discussion . . . 236 7 Discussion 240 Appendix I 248 Appendix II 263 Glossary 268 Bibliography 272
1.1 Example of Molecular Function graph taken from (Ashburner et al. 2000). . . 22
1.2 Example of Biological Process graph taken from (Ashburner et al. 2000) . . . 23
1.3 Example of Cellular Component graph taken from (Ashburner et al. 2000) . . . 24
1.4 Semantic similarity example . . . 28
1.5 Schematic of phylogenomics approach. . . 36
1.6 Phylogenetic profiling analysis. . . 38
1.7 Diagrammatic representation of domain fusion and fissions . . . 40
1.8 Domain content vector representation. . . 42
1.9 Schematic of the ProtFun method . . . 44
1.10 Unsupervised clustering for microarray data . . . 47
1.11 Similarity measures for co-expression . . . 48
1.12 Protein interaction neighbourhood . . . 54
1.13 Schematic of the MAGIC algorithm . . . 60
2.1 Shape of Molecular Function and Biological Process Ontologies . . . 66
2.2 Connectivity of annotation terms . . . 67
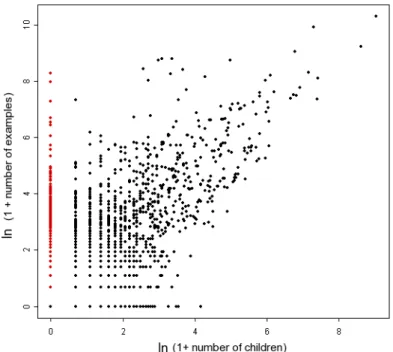
2.3 Annotation Specificity . . . 71
2.4 Annotation growth rates. . . 72
3.1 Sequence similarity measures . . . 84
3.2 Scoring annotation transfer . . . 86
3.3 Performance plots for annotation transfer . . . 90
3.4 Performance plots for annotation transfer using nr35 sequences . . . 91
3.5 Annotation error plots . . . 98
3.6 Annotation error plots . . . 99
3.7 Evidence for functional heterogeneity . . . 102
3.8 Venn diagrams summarising method performance . . . 104
4.1 Function categories enriched in disordered human sequences . . . 114
4.2 Heatmaps showing patterns of disorder region length . . . 116
4.3 Heatmaps showing patterns of disordered residue location. . . 119
4.4 Feature similarity . . . 126
4.5 Grid searches . . . 130
4.6 Feature importance estimates . . . 134
4.7 Server processing flow chart . . . 144
4.8 Example server output for IPI00745501 . . . 146
5.1 SimRel semantic similarity distribution . . . 154
5.2 Domain architectures for function prediction. . . 170
5.3 Template library generation . . . 172
5.6 Example1 functional linkage using domain fusion information. . . 183
5.7 Example2 functional linkage using domain fusion information. . . 185
5.8 Pre-processing flow chart . . . 188
5.9 Multi-dimension scaling plot showing variation between experimental studies . . . 191
5.10 The relationship between co-expression and function similarity . . . 193
5.11 Sample distribution for GSM showing 2 distinct modes of expression. . . 195
5.12 Lambda distribution model fits. . . 197
5.13 Co-expression profiles for sample bi-clusters . . . 199
5.14 Visualisation of feature relationships in 3 dimensions . . . 201
6.1 Integration strategies for function prediction . . . 208
6.2 Steps in vector and regression model integration . . . 209
6.3 Distribution of function similarity before and after sampling. . . 212
6.4 Relationships between observed and predicted MF similarity . . . 217
6.5 Relationships between observed and predicted BP similarity. . . 218
6.6 ROC curves reflecting integration performance using different features. . . 221
6.7 MF similarity model performance. . . 228
6.8 BP similarity model performance . . . 229
6.9 Contribution of data sources in function similarity estimation . . . 231
6.10 Score distributions for individual GO terms . . . 233
A-2 Schematic of SVM algorithm . . . 251
A-3 Separating hyperplane in transformed feature space. . . 252
A-4 Epsilon sensitive Support Vector Regression . . . 255
A-5 Epsilon sensitive SVR: introduction of slack variables . . . 257
1.1 MIPS FunCat annotation scheme. . . 20
1.2 GO evidence codes and their definitions . . . 26
1.3 Semantic Similarity Scoring methods . . . 29
1.4 Function prediction tools that rely on BLAST or PSI-BLAST algorithms . . . 33
1.5 Expression rule set generated from time series microarray data . . . 50
1.6 Kernel fusion for heterogeneous data sources . . . 57
2.1 IPI human sequences . . . 68
2.2 Dataset definitions . . . 76
3.1 Performance for annotation transfer using a global threshold . . . 88
3.2 Average specificity for annotation transfers . . . 95
3.3 Species comparison table for annotation specificity. . . 97
3.4 Annotation coverage . . . 107
4.1 Feature definitions . . . 120
4.2 Feature encoding scheme . . . 122
4.3 GO category performance . . . 131
4.4 Additional value of disorder features . . . 136
4.5 Classifier sensitivity obtained at different error rates . . . 138
4.7 Server performance on eukaryotic model organisms . . . 142
5.1 Comparison between semantic similarity measures . . . 153
5.2 Example function similarity calculation . . . 156
5.3 Sequence similarity features. . . 158
5.4 Protein interaction correlation of features with function similarity. . . 161
5.5 Topology feature listing . . . 164
5.6 Localisation features . . . 166
5.7 Features used in the mGenTHREADER and pDomTHREADER scores . . . 174
5.8 Example domain architecture score . . . 178
5.9 Putative functional linkages between PFAM and GO terms . . . 182
5.10 Microarray datasets that were combined and integrated for the analysis . . . 189
5.11 Overlap between feature pairs . . . 203
6.1 Training dataset sizes . . . 211
6.2 Training dataset sizes for data source models . . . 214
6.3 Training results . . . 215
6.4 Integrated model prediction performance . . . 220
6.5 Technical model quality assessment . . . 225
6.6 Example sequence annotations . . . 237
A-1 Types of machine learning algorithms . . . 248
A-2 Kernel functions . . . 254
Chapter 1
Introduction
1.1
The importance of protein function
Proteins play a central role in defining the behaviour within all biological systems. They are the fundamental work-horse components of living organisms. Ignoring fat, the average human being is composed of approximately 20% protein by dry weight. Proteins participate in almost all essential life processes; metabolism, growth and repair processes are all carried out by pro-teins. The disruption of normal protein functioning leads to a variety of disease states including Alzheimer’s, Parkinson’s, cancers and type II diabetes.
Proteins are synthesized in the Endoplasmic Reticulum of cells and are transported to different compartments, or tissues, to carry out their function. One of the largest classes of proteins are en-zymes responsible for the catalysis of over four thousand documented reactions (Bairoch 2000). Enzymes catalyse the chemical reactions that are responsible for metabolism, the generation of energy from food sources, DNA repair and DNA synthesis. They are frequently cytoplasmic proteins and specifically catalyse only one or two reactions each. Other cytoplasmic proteins transport materials or transmit signals through the interior of the cell to the nucleus.
Extracellular proteins (existing outside of the cell) include hormones, acting as chemical mes-sengers transmitting signals from the brain and other organs to destination cells and tissues. Hormones frequently act at receptors; proteins that reside in the cell membrane to carry out their functions. Signalling receptors transmit messages intracellularly by responding to chemical and biological stimulus (often ligand binding) at the cell surface. The messages are internalised, trig-gering secondary events that involve subsequent release or binding of another protein inside the cell. Other types of receptor (channels and pumps) transport ions into or out of the cell to main-tain a balanced chemical environment. Antibodies, the effectors of the immune system are either
extra-cellular proteins or can be tethered to the membranes of specialised blood cells. Here they mop up antigens (and foreign substances) targeting them for destruction. Another major class of proteins are structural proteins. The collagens and keratins that are found in skin, hair, teeth and bone. Many intracellular structures are composed of proteins, for example, ribosomes, the machinery responsible for protein synthesis are also composed of protein.
Each protein is a three-dimensional assembly of amino acids. Each amino acid is specified genetic material comprising triplet DNA codons. Interspersed regions of DNA that code for amino acids (exons) and are subsequently made into proteins comprise genes. Genes are first transcribed into an intermediate RNA molecule which is then synthesised into protein by the ribosome. The protein then adopts a stable three-dimensional structure and is transported to its site of action. It is both the quantity of protein in the cell dictated by the relative rates of transcription, translation and protein degradation at any one time, coupled with the subtle nature and diversity of interactions between proteins, DNA and small molecules that controls cellular behaviour and ultimately governs organism responses. Cataloguing the functions of proteins, the reactions they catalyse and the partners they interact with is therefore fundamental to furthering our understanding of physiological behaviour and offers valuable insights into the underlying mechanisms of disease.
1.2
The need for automated methods
The advent of high throughput DNA-sequencing technologies in the early 1980s enabled en-tire genome sequencing projects to be carried out rapidly and inexpensively. More recent third generation sequencing technologies are even higher throughput and less costly paving the way towards the 1,000 dollar human genome (Mardis 2006). Once raw sequence is obtained, au-tomated techniques are required to identify the entire set of genes present in the organism; its genome. Subsequently the encoded proteins can be deciphered giving rise to the amino acid sequences that comprise the proteome.
Whole genome scale sequencing projects ensure that biological sequence databases continue to grow exponentially (Marshall 1995). In contrast, the numbers of completely functionally char-acterised sequences rises linearly (Baumgartner Jr. et al. 2007, Singh 2003). Clear and unam-biguous functional characterisation of most sequences requires experimental validation. Crystal structure information can often provide clues to function by providing detailed 3 dimensional
information about the fold of a protein. Bottlenecks in the process arise from the difficulty in obtaining sufficient quantities of pure and stable protein to form crystals. Other proteins do not express well in vitroparticularly if they undergo post-translational modifications, or may exist in a disordered state requiring the presence of potentially unknown accessory proteins or ligands in order to fold or function. To observe the functions of these sequences, new experimental protocols must be developed, which can be labour intensive and prohibitively expensive.
The human genome sequence was completed in April 2003 some two years ahead of schedule (Pennisi 2003a). The number of genes present in the genome was estimated at around 30,000 although recent estimates are lower standing at around 25,000 (Pennisi 2003b). Ofran et al. (2005) estimated that of 2,000,000 known sequences, less than 25% were annotated to comple-tion. Currently, there are approximately 2000 human protein sequences for which very little is known. For proteins with well characterised close relatives, it is trivial to infer function. Or-phan proteins without discernible sequence relatives present a greater challenge. Here the task of experimental characterisation is blind and becomes unwieldy. It is highly unlikely that all known proteins will ever be completely experimentally characterised (Baumgartner Jr. et al. 2007). Thus there is a pressing need to develop fast and accurate computational approaches to fulfill this requirement.
1.3
Function annotation schemes
Fundamental to the task of annotation curation is a formalism of the concept of function. For a structural biologist it may constitute the fold of the protein, for a sequence analyst, its gene family and for a chemist the ligands or molecules that the protein can bind. Efforts to cata-logue the functional repertoire of proteins include controlled vocabularies; Swissprot keywords (Bairoch and Apweiler 1996), the Gene Ontology (Ashburner et al. 2000), Multifun (Serres and Riley 2000), FunCat Functional Categories (Ruepp et al. 2004), and more recently the KEGG Brite Functional hierarchy, (Kanehisa et al. 2008). These classification schemes populate sec-ondary biological knowledge-bases and permit high level analyses performed by grouping genes or proteins by functional class. The schemes emphasise different aspects of function, varying in specificity, coverage and simplicity of design. Each one attempts to provide a machine readable definition of function that can be exploited computationally in function prediction approaches.
keywords exist as free text labels assigned to one or more protein entities; ‘signal peptide’ or ‘kinase activity’ for example. The keyword system permits broad groupings of genes or pro-teins into biological pathways or by functional roles. Whilst offering flexibility, the relation-ships between keywords have not been defined. There is no means to interpret functional re-latedness between annotations. The MultiFun hierarchy, MIPS (Munich Information Center for Protein Sequences) Functional Catalogue (FunCat), KEGG (Kyoto Encyclopedia of Genes and Genomes) Orthology and Gene Ontology Consortium represent more sophisticated approaches incorporating dependencies between protein functions in a controlled, machine readable format.
1.3.1 Multifun, FunCat and KEGG hierarchical schemes
The Multifun annotation system was the first function category hierarchy building on earlier work of Monica Riley characterising the E.Coli K12 genome (Riley 1993, Serres and Riley 2000). Function categories comprised 10 broad classes with finer sub-categories describing cellular roles for 66% of E. Coli genes. The MIPS Functional Catalogue (FunCat) employed a similar, but more detailed scheme based on the cellular roles of yeast proteins (Joshi et al. 2004). The initial hierarchy has now been extended and covers annotations for plants, higher eukaryotes and prokaryotes (Ruepp et al. 2004). Originally 28 broad categories described aspects of cellular metabolism and protein activity regulation. In the hierarchy specific annotations occupy sub-categories from the main branches (Table 1.1). The KEGG Brite system adopts a similar hierarchical structure for a series of descriptive schemes representing different aspects of function. The current system includes separate hierarchies for biological systems, pathway modules, human diseases and drug interactions. The KEGG Orthology (KO) groups proteins by their evolutionary history and provides a common unit used to navigate between hierarchies.
1.3.2 The Gene Ontology
The Gene Ontology (GO) (Ashburner et al. 2000) has become the de-facto standard in protein function annotation. The scheme represents the most complex and flexible annotation systems for describing protein functions. The annotation terms are modelled as a Directed Acyclic Graph (DAG) and provide a sophisticated model of functional complexity. Three independent contexts describe gene products; Molecular Function (MF), Biological Processes (BP) and Cellular Com-ponents (CC). The DAG structure is similar to a hierarchy. More specific child annotation terms inherit general annotations from their parents. Additional flexibility is incorporated by
permit-Table 1.1: Example of MIPS FunCat annotation scheme.
MIPS FunCat Functional Catalogue Entries
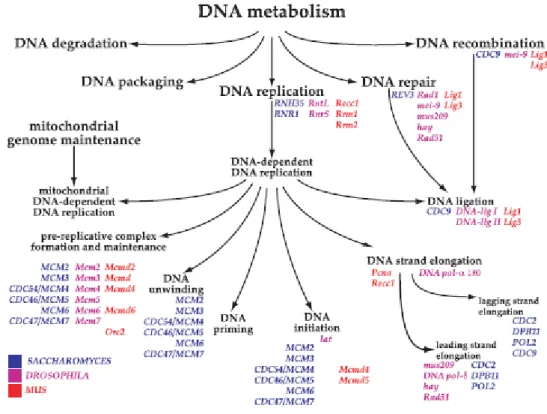
01 Metabolism
01.01 amino acid metabolism
01.02 nitrogen and sulphur metabolism 01.03 nucleotide metabolism
01.03.01 purine nucleotide metabolism 01.03.04 pyrimidine nucleotide metabolism 01.03.07 deoxyribonucleotide metabolism
01.03.10 metabolism of cyclic and unusual nucleotides 01.03.13 regulation of nucleotide metabolism
01.03.16 polynucleotide metabolism
01.03.16.01 RNA degradation 01.03.16.01 DNA degradation
MIPS FunCat scheme for Metabolism expanded for nucleotide and polynucleotide metabolism. Each level of the hierarchy is prescribed a two digit number and sub entry levels inherit the entry codes of their parents, separated by the dot notation
ting annotation terms to share multiple parent-child relationships.
The MF graph describes the activity of the protein whereas the BP graph describes the pathway or cellular process in which proteins perform their role(s). The CC terms predominantly detail the localisation aspects of protein (see Figures 1.1, 1.2 and 1.3 for examples).
Molecular Function
The MF ontology formally describes the biochemical activities of a gene product and includes highly specific descriptions such as binding to ligands or structures (Ashburner et al. 2000). The annotation terms can be applied to a gene or its products alone, or may describe function(s) as part of a protein complex. The flexible DAG structure incorporates multiple annotations of a single protein (MCM4 in Figure 1.1 ) to different regions of the graph, emphasising different aspects of the proteins activity. The functional categories are defined for all organisms although some terms are lineage specific.
Biological Process
The BP ontology describes the biological objective to which the gene product contributes (Ash-burner et al. 2000). Some of these terms correspond closely to MFs, or parts, or groups of MF categories. The protein MCM4 annotated with the activity of an ATP-dependent DNA helicase is further described as being involved in DNA dependent DNA replication, more specifically the DNA initiation, unwinding and pre-replicative parts of the process (Figure 1.2).
Cellular Components
CCs describe the part of a cell in which gene products perform their functional roles (Ashburner et al. 2000). Additionally, the component categories provide cellular protein complex informa-tion such as ‘interleukin-1 complex’ or ‘mRNA-editing complex’. Currently, some 679 terms describing complexes exist in the CC DAG. Proteins are dynamic cellular entities moving around within or between cells in order to function. The components graph captures this information appropriately for the MCM4 protein which forms part of the replication fork complex in the nucleoplasm and can also be found in the cytoplasm (Figure 1.3).
Gene Ontology Annotations
Genes and proteins are annotated with one or many GO terms by annotation consortia. Pieces of evidence from different sources are manually reviewed by the consortia before final annotation assignments are made. The annotation process is transparent; curators record evidence codes for each annotation (Table 1.2). Single annotations may be corroborated through multiple evidence sources, from a published journal article characterising the function of a gene product from an activity assay, or from high throughput microarray or yeast two hybrid experiments. The evidence codes are ranked by reliability (Table 1.2). Curator approved records from the literature with direct statements describing function(s) (TAS) and annotations from experimental assays (IDA) represent the most reliable sources. IEA and ND codes which have not been subject to human judgement are considered the least reliable pieces of evidence. Most of the current human annotations are sourced from the least reliable automated (IEA) codes. This is symptomatic of the manual efforts required to provide high quality function annotation.
GO term annotations can be considered at different levels of the DAG structure to perform meta-type analyses of biological data. Meta-analyses provide a higher level overview of the data by layering more generally descriptive information onto primary or raw data. Often this pro-vides a means to interpret experimental outcomes where raw data is noisy or cannot be directly compared. In these cases trends may be observed at the meta-information level that cannot be determined at the primary raw data level. For example, an experimenter might wish to interpret a list of genes (primary data) that change between two conditions by comparing their function annotations (meta information). Alternatively, an experimenter might restrict an analysis to a particular function category of interest. Of vital importance when using GO terms to perform these analyses is the quality and completeness of dataset annotations. In the absence of such annotations, the power to detect experimental trends cannot be realised.
A more sophisticated interpretation of annotation categories that exploits predefined relation-ships between function annotations is the semantic information content or semantic similarity between annotation terms. These measures quantify the specificity of the annotation term by considering its frequency of occurrence. Rare terms are assigned a high specificity whilst gen-eral terms are assigned a low specificity value. Semantic content measures are useful for the Gene Ontology since the majority of annotations for genes and proteins are partial (only one of many functions of the protein has been annotated) and general (the annotation category is close
Table 1.2: GO evidence codes and their definitions. GOA human column represents the frequency of the evidence code in the human annotation files
Code Definition GOA human Reliability
IC Inferred by curator 109
-IDA Inferred from direct assay 953 1 IEA Inferred from electronic annotation 27835 5 IEP Inferred from expression pattern 164 3 IGI Inferred from genetic interaction 14 1 IMP Inferred from mutant phenotype 181 2 IPI Inferred from physical interaction 1415 1 ISS Inferred from sequence or structural similarity 705 3 NAS Non-traceable author statement 3098 4 ND No biological data available 1385 5 RCA Inferred from reviewed computational annotation 0 -TAS Traceable author statement 6492 1
-to the -top of the hierarchy). Groupings of genes or proteins by annotation similarity provides a means to simultaneously evaluate functions of equivalent specificity as well as tolerating partial annotations.
1.3.3 Modelling function similarity
Protein similarity is well defined in terms of sequences using homology detection algorithms. Protein structural similarity is also well defined by comparing folds, architectures and or topolo-gies using the CATH (Orengo et al. 1997) and SCOP (Murzin et al. 1995) nomenclatures. The continuum of protein function similarity can be defined based on the semantic similarities mea-sured using one of the various annotation schemes. The benefits of defining functional similarity between proteins are manifold. If a protein has unknown function it is advantageous to be able to identify a functionally nearest neighbour. The relationships between sequence, structure and function can be more clearly defined and whole organisms can be viewed in terms of scale based networks representing protein function space.
Semantic similarity measures were first used in the WordNet project (Sigman and Cecchi 2002) to measure similarity between words existing as part of a network structure. Several semantic similarity measures (Table 1.3) have been formally applied to the Gene Ontology Graphs (Lord et al. 2003, Wang et al. 2007). The different methods share the common feature that they use linkages between terms to define a closest parent common ancestor term (pca) (Figure 1.4), which forms the basis of the similarity score. The functional similarity between proteins or genes has been evaluated using the different semantic similarity measures and compared with sequence similarity, microarray similarity and structural similarity (Lord et al. 2003, Pesquita et al. 2008, Wang et al. 2007, Zhang et al. 2006).
To calculate a functional similarity score between two genes or proteins, they are first considered in terms of their annotations. Each protein can be annotated by multiple terms from each of the different Gene Ontologies; Molecular Function, Biological Process, or Cellular Component. Thus, a matrix of semantic similarities can be generated between all annotation pairs from each pair of proteins:
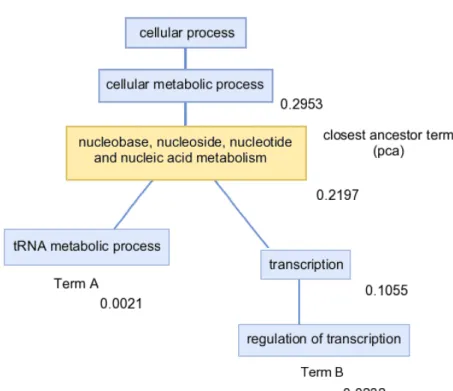
Figure 1.4: Example of semantic similarity measure between GO terms ‘regulation of transcription’ and ‘RNA metabolism’. The closest common ancestor term is ‘nucleobase, nucleoside, nucleotide and nucleic acid metabolism’. The semantic information content of each term using its annotation frequency is shown alongside each node calculated as the probability of observing each term in the set of annotated human sequences.
Table 1.3: Semantic Similarity Scoring methods
Method Description Equation Range
Resnik scores GO term similarity as pca, pca defined by term fre-quency of occurrence
−ln(pca) 0 - inf
Lin scores GO term similarity as normalised pca, pca defined by term frequency of occurrence
− ln(pca)
ln(A) +ln(B) 0 - 1
GFSST scores GO term similarity as pms, pms defined by frequency of child terms
−ln(pca) 0 - inf
SimRel hybrid of Resnik and Lin scores −ln(pca)× ln(pca)
ln(A) +ln(B) 0 - 1
Here pca represents the probability of the closest ancestor annotation in the GO term graph. In the Resnik, Lin and SimRel methods this probability is defined as the frequency of occurrence of the annotation in a population of sequences relative to the frequency of the root annotation; either Molecular Function or Biological Process. A and B refer to the probability of annotation A and B ocurring within the same sequence population .
=
GOB1 GOB2 . . . GOBn
GOA1 S(GOA1, GOB1), S(GOA1, GOB2) . . . S(GOA1, GOBn)
GOA2 S(GOA2, GOB1), S(GOA2, GOB2) . . . S(GOA2, GOBn)
GOA3 ... ... . .. ...
GOAn S(GOAn, GOB1), S(GOAn, GOB2) . . . S(GOAn, GOBn)
(1.1)
Functional similarities can be local (between the most similar annotation pairs), or global (be-tween all annotation pairs) and symmetric where the resulting scores are the same for forwards comparisons (protein A vs protein B) and reverse comparisons (protein B vs protein A), or asymmetric where the resulting scores exhibit directional bias. The first application of function annotation similarity methods derived semantic similarities using average of pairwise similarity scores between all pairs of GO terms within the same Ontology. Resnik, Lin and Jiang methods were compared with sequence similarity for protein pairs. Similarities derived using the Resnik method were most highly correlated with sequence similarity (Lord et al. 2003). Subsequent studies reported superior correlations for the Resnik semantic similarity method compared with gene expression similarity (Sevilla et al. 2005) and domain architecture similarity (Bjorklund et al. 2005). A recent benchmark comparison suggested the use of the asymmetric maximum similarity score over the average similarity score or maximium similarity score (Pesquita et al. 2008).
1.4
Automated function prediction methods
Controlled vocabularies to describe protein function such as the GO and MIPS initiatives provide a framework for the development of function prediction algorithms. The GO graph structures are more complex than the straightforward four digit tree structures of either FunCat or Enzyme, but represent a compromise between the subtlety of relationships that can be described, the require-ment for machine readability and standardised linguistics. The growth of automated function prediction servers and approaches has been considerable in recent years. In 2005 the first Auto-mated Function Prediction Special Interest Group (AFP-SIG) meeting discussed benchmarking and quality measures for these methods (http://biofunctionprediction.org/AFP/). The result was a critical assessment for function prediction servers for given protein sequence and structure
in-formation to return a GO function prediction. Difficulties in providing a comprehensive gold standard experimentally validated dataset for prediction purposes has hampered progress in this area, since true and false negative predictions cannot be easily distinguished.
Methods of function prediction predominantly comprise annotation transfer methods utilising guilt-by-association approaches. Other methods are model-based single or multi-class function predictors. Some methods concentrate on single aspects such as the protein’s sequence or struc-ture, or combine different biological attributes to predict function. Homology based methods target the accurate annotation of similar protein sequences. Relatively few methods target the annotation of distantly related proteins, or proteins with no discernible sequence relatives - one of the greatest challenges in the function prediction field.
1.4.1 Homology based approaches
The largest group of methods rely on detection of evolutionary homologues by sequence similar-ity search. Annotation is transferred from well annotated sequences to uncharacterised queries by establishing the closest relative or closest group of consistently annotated sequences. Homo-logue detection is usually carried out by Basic Local Alignment Search Tool (BLAST) (Altschul et al. 1990) or Position Specific Iterated BLAST PSI-BLAST (Altschul et al. 1997) algorithms. More precise orthologue detection is performed by aligning the unknown sequence with its clos-est homologues in a multiple sequence alignment and reconstructing a phylogenetic tree. An-notation is then transferred between orthologous sequences or clades. These approaches are referred to as phylogenomic approaches (Sjolander 2004).
BLAST or PSI-BLAST based approaches
BLAST is a heuristic sequence search algorithm used to identify similar sequences to a query of interest. The existence of a highly significant similarity score or multiple consistently anno-tated relatives is usually sufficient to transfer function annotation to the uncharacterised query sequence.
The premise of the method is that sequence relatives represent evolutionary homologues of the query sequence with common function. The greater the number of similar sequences returned with consistent annotation from the search, the greater confidence can be attributed to the
anno-tation. Sequence similarities of≥80% identity are universally considered high confidence rela-tionships for function assignment (Addou et al. 2009, Tian and Skolnick 2003). Many function prediction approaches have been developed that rely on BLAST or PSI-BLAST as the underly-ing method (Table 1.4).
The PSI-BLAST algorithm is an extended version of the BLAST algorithm designed to improve detection of distantly related sequences. The PSI-BLAST algorithm generates a position specific scoring matrix (PSSM) from the initial search results. The search is repeated using the PSSM model to query the same database. As more sequences are added to the profile, the iterations continue and power to detect remote relationships increases. The search terminates when no ad-ditional sequences are identified (convergence) or the number of iterations reaches a user defined threshold. The PSI-BLAST method is powerful where unambiguous sequence relationships can-not be detected by BLAST and the search capability must be extended.
The simplest methods Onto-BLAST (Zehetner 2003) and GOblet (Groth et al. 2004) search a database of well defined annotated proteins. The annotations of the matching sequences are collated and a statistical expectation value (E value) from the BLAST output used to score the occurrence of each GO annotation. The E value represents the number of times a match has occurred to a related sequence versus a match to a random sequence within a database of a certain size. The Onto-BLAST server summarises these annotations using the most significant similarity scores, the number of sequences carrying the annotation and number of species with an annotation from the matching sequences list. These servers do not attempt to indicate the correct annotation for an unannotated sequence but simply present the annotations returned via the similarity search ranked by score.
The GOFigure method (Khan et al. 2003) defines a minimum covering sub graph from the GO annotated sequence hits. Similarly, the GOtcha method (Martin et al. 2004) scores prospective GO terms in a sub-graph using the BLAST E value. The most probable sub-graphs are identified by the maximum score obtained by summing the E values from the leaves of the sub-graph to the root. The PFP server (Hawkins et al. 2006, 2009) additionally considers the most probable GO term annotations by including a probability term derived from a scoring matrix known as the FAM matrix. The FAM matrix represents conditional probabilities for co-occurrences of GO terms both within and between ontologies derived from the UniProt protein database. By considering these probabilities weak scores can be strengthened by the prediction of one or more
Table 1.4: Function prediction tools that rely on BLAST or PSI-BLAST algorithms
Method Authors URL
PFP Hawkins et al. (2006) http://dragon.bio.purdue.edu/pfp/pfp.html OntoBlast Zehetner (2003) http://functionalgenomics.de/ontogate/ GOFigure Khan et al. (2003) http://udgenome.ags.udel.edu/gofigure/
GOPET Vinayagam et al. (2006) http://genius.embnet.dkfz-heidelberg.de/menu/cgibin/ w2hopen/w2h.open/w2h.startthisSIMGO ¯w2h.welcome GOBLET Groth et al. (2004) http://goblet.molgen.mpg.de/
of the co-occurring GO terms. The PFP server produces the top 10 most likely annotations for a protein ranked by the final score. The improved performance reported for this method is most likely due to the inclusion of the FAM matrix and thus it represents the most sophisticated of the automated sequence similarity transfer methods.
Phylogenomics approaches
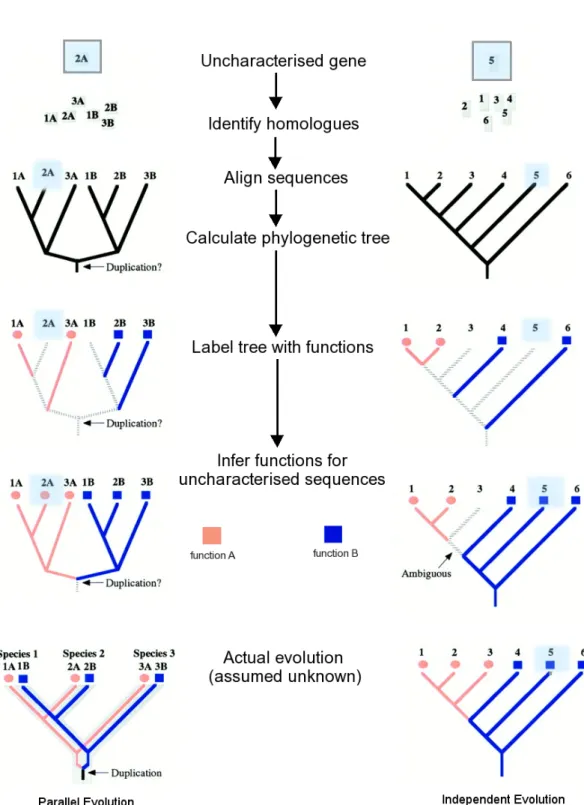
The term phylogenomics refers to the application of phylogenetic information to the study of genomic data (Eisen 1998). Rather than assigning nearest sequence neighbours by similarity searching methods, phylogenomics approaches determine true evolutionary homologues by phy-logenetic reconstruction (see Figure 1.5 for an example). The process involves identifying a set of homologous sequences, or family members, producing a sequence alignment between that can be used to construct a phylogenetic tree. Function labels are then overlaid onto the reconstructed tree of closely related sequence neighbours. Function can be inferred for an uncharacterised protein either by clade membership in the phylogenetic tree or by identification of the closest orthologous sequence in the tree.
In Figure 1.5 left hand side, sequences 2A and 2B represent cases where function has evolved in parallel. Unambiguous function assignments are determined by placement of the sequence alongside orthologues with common function. On the left hand side of Figure 1.5, the assign-ment of function is straightforward for uncharacterised sequences 2A and 2B as function has evolved in parallel and is preserved within clades following duplication. However, the case pre-sented on the right hand side is more difficult. Here function has diverged within a clade either before or after the branch point of sequence 3 giving rise to orthologous sequences that do not share function. In this case the reconstruction cannot be used to make an unambiguous function assignment. Sequence 5 can be assigned function since it lies between two sequences (6 and 4) with shared function. These sequences are evolutionarily closer and more distant respectively, to the common ancestor with shared function.
The value of phylogenomic approaches are recognised in situations where convergent evolution gives rise to small changes in sequence that alter functional specificity, or where straightforward sequence similarities fail to correctly distinguish orthologous relationships from homologous relationships (Sjolander 2004). Automated methods employing phylogenomics approaches in-clude SIFTER (Engelhardt et al. 2005), RIO (Zmasek and Eddy 2002) and ORTHOSTRAPPER
(Hollich et al. 2002, Storm and Sonnhammer 2002).
The SIFTER method uses a Bayesian phylogenomics approach to assign function to unanno-tated proteins (Engelhardt et al. 2005). It overcomes some of the time constraints involved in constructing accurate multiple sequence alignments by pre-computing family alignments to seed the searches. Uncharacterised sequences are added to the nearest family alignment and known functions overlaid onto the resulting phylogenetic tree. The conditional probability of unanno-tated protein having any of the functions is evaluated by considering the positions of the known functions in the tree. Additionally, reliability weights are applied to each annotation according to the annotation evidence codes. The authors demonstrated the applicability of their approach in deciphering annotations for the monophosphate/deaminase and lactate/malate dehydrogenase families quoting 96% accuracy, and considerably improved performances over the GOtcha and other sequence similarity based approaches. Both families present challenges in function pre-diction by representing multiple functions between closely related sequences. Hence these test datasets present cases where annotation transfer by sequence similarity methods are prone to errors.
RIO (Re-sampled Inference from Orthologues) (Zmasek and Eddy 2002) employs bootstrap and re-sampling procedures permuting sequence alignments and rebuilding the trees to estimate the reliability of function assignments. The ORTHOSTRAPPER method (Storm and Sonnhammer 2002) is very similar to the RIO method, however sequence similarity heuristic measures are used to construct a pairwise sequence distance matrix for tree building, as oppose to an evolutionary distance measure obtained from a phylogenetic tree.
All of the phylogenomic methods for inferring function rely upon close sequence family or do-main assignments made through initial homology searches. They target highly accurate function assignments through the determination of evolutionary speciation and duplication events. The trade off with these methods is that they are time consuming. Bootstrap tree values and confi-dence estimates come at considerable computational cost and there is an implicit requirement that the orthologues of an unknown sequence are completely and correctly functionally anno-tated (Eisen and Fraser 2003). High quality multiple sequence alignments can be difficult to obtain without the use of expert knowledge or manual curation (Sonnhammer et al. 1997) and the quality of tree building methods relies explicitly on the breadth of annotated species present. As such phylogenomics techniques are restricted in terms of applicability and coverage.
Figure 1.5: Schematic of phylogenomics based approaches. Sequences 2A and 1B can be unambiguously assigned function by clade membership, whilst sequences 5 and 3 on the right hand side represent less clear cut cases since orthologues have evolved independently within the different species.
Phylogenetic profiling
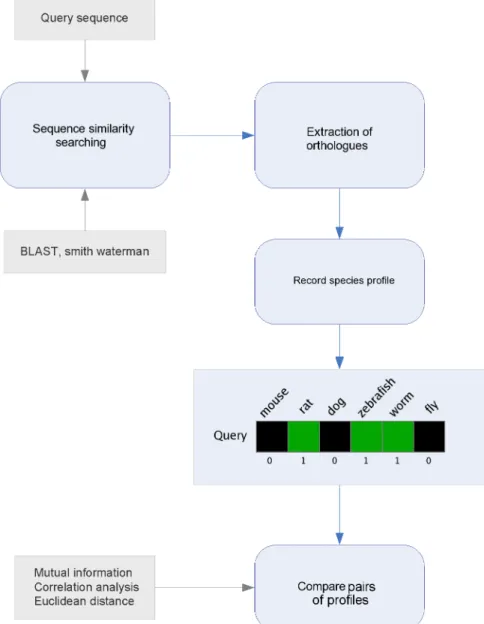
A related set of methods utilise phylogenetic profiles in order to transfer function annotations (Eisen and Wu 2002, Engelhardt et al. 2005, Ranea et al. 2007). Phylogenetic profiling tech-niques capture the evolutionary history of a gene or protein through the use of presence or ab-sence species profiles constructed using sequence or domain relatives in other organisms (see Figure 1.6 for an example) (Eisen and Fraser 2003). The premise of the method is that pairs of sequences with similar phylogenetic profiles share common evolutionary history and are more likely to be functionally related (Loganantharaj and Atwi 2007).
There are two important steps in phylogenetic profiling: the construction of high quality profiles and the method used to compare between them. A variety of distance and similarity measures have been applied to the profiles in order to detect co-evolution, including mutual information, given by M I(X :Y) =X Xp(x, y)log p(x, y) p1(x)p2(y) (1.2) , Pearson’s correlation emphasising similarity of shape between two series and given by
rX:Y = P xy−P xP y p nP x2−(P x)2p nP y2−(P y)2 (1.3)
and Euclidean distance measuring the magnitude of difference between vectors
dX:Y =
qX
(x−y)2 (1.4)
(Wu et al. 2006). Whilst these methods are relatively quick to compute, their power is dictated by species diversity in the profile. Consequently, they perform better when applied to prokaryote genomes for which there exists approximately six times the number of fully sequenced species representatives (Cokus et al. 2007, Kyrpides 1999, Loganantharaj and Atwi 2007).
Domain or family based approaches
Historically, the domain has been cited as the primary unit of functional inheritance (Ponting and Russell 2002). Domains exist in proteins as independently folding units presumably selected for functional reasons. This information is captured directly in annotation schemes such as Inter-Pro2GO, SCOP2GO and PFAM2GO where the explicit presence of an InterPro or PFAM domain
Figure 1.6: Workflow steps involved in phylogenetic profiling analysis. Sequence similarity searching is performed against a set of completely sequenced reference genomes to identify homologues or ortho-logues. Presence or absence of these relationships is then used to generate phylogenetic profiles. The profiles are then compared in order to identify cases of similar evolutionary history between sequences.
in a sequence is sufficient to indicate function. PFAM (Finn et al. 2003), SMART (Schultz et al. 1998), CDD (Marchler-Bauer et al. 2002) and PRODOM (Corpet et al. 1998) domains are repre-sented as homologous sequence models delineated by the parts of each sequence representing the domain. In the CATH and SCOP databases these domains are defined by 3D structure represen-tatives and classified into hierarchical schemes based on common topologies and architectures (Andreeva et al. 2008, Orengo et al. 1997). Function predictions can be carried out by screen-ing uncharacterised sequences against libraries of domains and exploitscreen-ing the different mappscreen-ing schemes to transfer function annotations. Single domain annotation methods yield precise and accurate functional annotations for a limited number of functions and domain folds or families; just over 46% of PFAM families are mapped in the current version of PFAM2GO covering 2042 (22 - 25%) of function annotation classes. Many domains, the TIM Barrels for example, are functionally promiscuous (Basu et al. 2008). In these cases phylogenomic profiles can result in an expansion of function class candidates rather than narrowing the selection or providing speci-ficity. Evolutionarily, domains evolve by fusion (joining of two domains) and fission (splitting of a single domain) events resulting in large numbers of combinatorially unique architectures from just a few individual domains (See Figure 1.7 for a schematic describing the process) (Snel et al. 2000, Vogel et al. 2004, Yanai et al. 2002). Multi-domain architectures are prevalent in eukaryotic proteomes constituting 65-80% of sequences (Bjorklund et al. 2005, Gerstein 1998). Sequences sharing common domain architectures therefore display more similar functionality. Pairs of architecturally distinct sequences can also be linked by the existence of a common an-cestral fusion protein that contains domains from both sequences. These relationships are rare, but can be used to infer interaction partners or indicate shared biological pathways (Enright et al. 1999, Marcotte et al. 1999).
The majority of automated methods exploiting domain information for function prediction em-ploy domain profiling techniques similar to the phylogenetic profiling techniques described in Section 1.4.3. The main difference is that sequence-based phylogenetic profiles are constructed from domain presence or absence rather than the presence or absence of sequence homologues (Marcotte et al. 1999, Ranea et al. 2007). The GO trees method (Hayete and Bienkowska 2005) models the entire functional domain content of proteins using PFAM domain definitions. Each sequence is represented as a profile containing a domain representation similar to the phylo-genetic profile (Figure 1.8). Domain occurrence between pairs was scored either as a binary vector or by an integer vector encoding the frequency of occurrence of each domain. A decision tree classifier was then used to model function assignments from the domain encoded profile
vectors. The approach improved sensitivity and specificity over and above that obtained using PFAM2GO mappings.
Forslund and Sonnhammer (2008) recently presented two approaches to infer function using domain architectures. The first method produced a strict mapping set between combinations of PFAM domains sufficient to infer function. The second Bayesian probabilistic approach evalu-ated the odds ratio for a function given a particular PFAM domain. The probability of annota-tion transfer given the full complement of domains in each sequence was then evaluated over all unique pairs of domains between two sequences. Performance assessment using Gene Ontology annotations showed that the probabilistic and direct mapping approaches were highly precise (
>90%). However, much lower coverage was attained than annotations transferred using best or top BLAST hits (Forslund and Sonnhammer 2008).
Methods to predict protein function using domain fusion information have also been imple-mented (Enright and Ouzounis 2001). Ancestral fusion proteins are identified as pairs of do-mains in multi-domain proteins that are found to occur separately in another species (see Figure 1.7 for a diagram). The underlying rationale for the method is that in 3 dimensions two domains within close proximity to one another share at least one interacting surface (Chia and Kolatkar 2004). It then follows that proteins containing each of the domains may interact. This hypothesis has been validated using both fusions at the gene and domain level to suggest candidate protein interactions between unrelated sequences. Again profiling techniques can be used to capture these events at the sequence level and have proved useful specifying a weak signal for functional similarity (Serres and Riley 2005).
1.4.2 Non-homology based approaches
For a proportion of sequences (estimated at 33% of all currently known sequences (Ofran et al. 2005)) there are no annotated relatives. In some cases, detectable relatives are so distant that function assignments made via homology inference provide very general, low confidence an-notations. A series of approaches to annotate these difficult cases utilise non-homology based features from sequence or structure. Other approaches incorporate information from experimen-tal sources, expression data, or protein interaction data for example. One of richest sources of functional information that remains to be fully exploited lies in the scientific literature database MEDLINE accessible via the PubMed electronic gateway (Stewart et al. 2002). Automated
ex-Figure 1.8: Domain representations for CTFG and XP 14318 sequences adapted from (Hayete and Bi-enkowska 2005). Domain abbreviations VWC and VWD represent Von Willebrand factor domains C and D respectively, IGFBP is the Insulin growth factor binding domain and CTK is a C terminal cysteine knot domain. TSP1 is the thrombospondin type I domain. The binary model represents domain presence and absence whereas the integer model records the frequency of each domain.
traction and language modelling of the relevant abstracts and articles from these vast resources constitutes one of the major challenges of the post-genomic era, text-mining.
Feature based methods
Feature based methods describe secondary characteristics of proteins predominantly obtained from sequence or structure. The sequence features do not directly exploit homology relationships by the use of sequence alignment methods, or attempt to define a neighbourhood of similar sequences. This makes these methods applicable to all proteins of known sequence regardless of their homology status.
The ProtFun method (Jensen et al. 2003) was one of the first methods specifically designed to target the annotation of orphan proteins. The approach employed neural network (NN) ensem-bles trained to recognise patterns of amino acid, localisation and secondary structure features to predict GO classes (see Figure 1.9 for a schematic of the process). 14 biological attributes were predicted from the amino acid sequence and encoded in feature vectors. Performance ac-curacies of > 50% coverage at error rates of less than 10% were obtained for 14 broad GO functional categories and 12 FunCat categories. Similar methods have been applied to enzyme function prediction using structural information (Dobson and Doig 2005). Here features such as surface accessibility, secondary structure and amino acid information were derived from crystal structure information and fed into Support Vector Machines (SVM’s) to discriminate between different enzyme classes.
Whilst these approaches are applicable to all sequences or structures, limited information can be incorporated into the different features. Without alignments to identify conserved parts be-tween sequences or structures, the features tend to comprise general characteristics describing the whole sequence or structure. This restricts the power of the method to provide discriminate functions between closely related sequences. Rather than relying on these methods to make ac-curate function assignments, they tend to be reserved for function candidate prioritisation for orphan sequences and sequences that cannot be aligned to well characterised proteins.
Figure 1.9: Schematic of the ProtFun method
Function prediction from expression information
The advent of DNA microarray technology has meant that thousands of genes can be simulta-neously profiled for expression in a quantitative manner. Expression signatures in tissues and cell lines or responses to stimulus can be surveyed across whole genomes. Genes with similar expression profiles, tend to code for interacting proteins - a source of useful information regard-ing protein function (Ge et al. 2001, Jansen et al. 2002). Genes that react similarly to external events, ligand binding or stress conditions for example, tend to participate in similar pathways (Stuart et al. 2003).
Data stores have been set up to capture the results of expression experiments (Array Express (Parkinson et al. 2007), Gene Expression Omnibus (Barrett and Edgar 2006), RNA Abundance Database (Manduchi et al. 2004) and the Stanford Genome Database (Ball et al. 2005)) for view-ing, querying and downloading these publicly available data. Single or multiple experiments can be re-analysed to gain insights into the behaviour of genes under different conditions and extract knowledge about their functions. Methods of annotating function from microarray data fall into two classes, unsupervised clustering approaches and supervised knowledge based approaches.
Unsupervised approaches
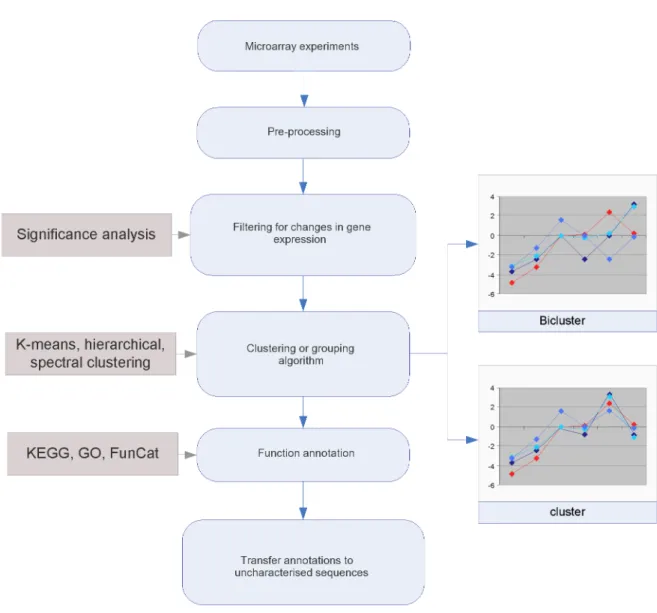
The most widely used methods for function classification from microarray data involve selecting groups of clustered, co-regulated or co-responsive genes from an experiment and examining their function annotations. Where an unannotated gene product is a member of a group with consis-tent or conserved annotations, its function can be inferred. Eisen et al. (1998) was one of the first to establish robust clustering methods for microarray data and publish analyses of co-regulated genes that were unrelated at the sequence level yet shared common functions. Subsequently, more sophisticated techniques have been applied to group genes with common expression be-haviour such as eigen gene analysis, independent component analysis (Frigyesi et al. 2006, Lee and Batzoglou 2003, Liebermeister 2002) and bi-clustering algorithms. Unlike more traditional clustering approaches that identify similar expressions across all sets of tissues or samples in an experiment, bi-clustering techniques seek expression patterns that are conserved over subsets of conditions from a given experiment (Madeira and Oliveira 2004, Prelic et al. 2006). Once ro-bust groupings of genes or transcripts are obtained from the data, their functional heterogeneity can be measured and broad level functions inferred using a guilt-by-association approach where
deemed appropriate (see Figure 1.10 for a process overview).
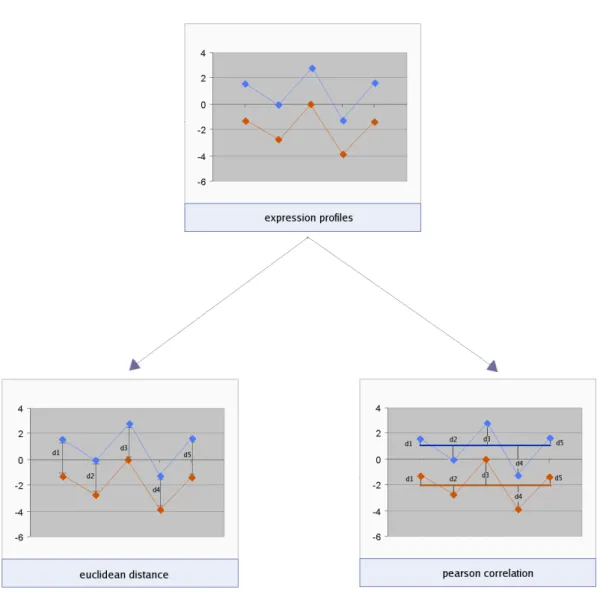
One of the first steps in clustering transcript expressions is to establish a comparative mea-sure between profiles. Two commonly used meamea-sures are Euclidean distance (Equation 1.4) which evaluates the magnitude of differences between expression intensities over each experi-mental condition, and Pearson’s correlation (Equation 1.3) which measures the similarity of the shape of two expression profiles by considering the direction of the vectors between conditions (see Figure 1.11). Zhou et al. (2005) applied second order correlation coefficients to measure common behaviour between different experiments performed in yeast. These higher level cor-relations were determined from first order corcor-relations measured within different experiments for pairs of transcripts. Applying thresholds to the first and second order correlations resulted in quadruplet groups of transcripts that were more likely to share common function than pairs of first order correlations. Using the resulting clusters, the authors were able to make function assignments to more than 60 uncharacterised genes. Several of these predictions could be sup-ported by literature evidence. The method represents a straightforward way to integrate data from different experiments and microarray platforms together to increase the predictive power of the approach.
Supervised approaches
Supervised approaches involve building models of expression profiles or identifying gene sig-natures for particular functions. Uncharacterised transcript profiles can then be tested against the models to infer function with an associated confidence measure. Support vector machines (SVMs - see Appendix part I) have been used to classify function for unannotated yeast orfs (open reading frames) (Brown et al. 2000), and rule based approaches have been used to extract signature templates from time series microarray data for human GO term prediction (Lagreid et al. 2003). These approaches generated accurate function assignments for subsets of broad annotation classes determined by the type of experiments performed on the data.
For the yeast genome, 80 different hybridisation experiments at different time points from bud-ding yeast were used. These included Diauxic shift, mitotic cell cycle division and sporulation experiments performed on custom built spotted arrays. The arrays were dual channel hybridis-ations performed using a fixed reference RNA sample for normalisation purposes. Expression measures were represented as log ratios calibrated using the corresponding reference RNA
chan-Figure 1.10: Workflow diagram of unsupervised methods for annotating functions from microarray data. Traditional clustering algorithms tend to group genes with common expression behaviour over all con-ditions whilst bi-clustering approaches group genes with common expression behaviour in just a few samples.
Figure 1.11: Different measures of similarity for expression behaviour across experimental samples. The Euclidean measure accounts for differences in magnitude between expression profiles (d1,d2,d3,d4 and d5) whilst Pearsons correlation coefficient looks for conserved shape by comparing the variation (d1,d2,d3 and d4) from the mean expression (dark blue and orange thick horizontal lines) measured within each expression series.
nel. A global normalisation Ni = ln(Ei/Ri) pP ln2(E i/Ri) (1.5) was then performed across all arrays and the resulting 80 dimensional vector of expression mea-sures used as feature inputs to classifiers to recognise patterns of expression that were indicative of each functional class. Six function classes were predicted with high accuracy and low false positive rates. The best performances were observed for ‘ribosomal’ and ‘histone’ functions.
Another approach used a human fibroblast serum response time series dataset (Iyer et al. 1999) to predict GO terms (Lagreid et al. 2003). Initially, a set of functionally informative gene ex-pressions were defined by considering the variance in exex-pressions over different numbers of time intervals (minimum of 2 time points). Rules were generated from the function class templates and decision-based reasoning applied to predict class membership for test datasets. The rules were pruned using rough set theory to establish the minimum set required to classify each anno-tation category (Table 1.5). This method resulted in models for 16 BP categories from GO. The highest accuracies were reported for “chemotaxis”, “blood coagulation”, “cell embryogenesis” and “morphogenesis” categories.
The results from both these approaches suggest that gene function information can be reliably inferred from microarray data, given an appropriate model. In contrast, several studies suggest that co-expression signals determined by correlation analyses from microarray data serve only as a weak signal for function given that expression behaviour represents a cellular snapshot taken at the transcriptional level (van Noort et al. 2003, Yeung et al. 2004). Some transcripts may be rapidly degraded or be regulated by other cellular mechanisms such that they never reach their required destination to perform their functions. In this case transcriptional profiles do not provide an appropriate representation of the behaviour of the protein in the cell that can be used to make functional inferences. Other problems in interpreting expression patterns result from the technology itself. For example, some genes are expressed in very low copy numbers below the detection limits of the microarray whilst other genes can exhibit ‘hyper variable’ or erratic expression behaviour when characterised by microarray (Dozmorov et al. 2004).
The function categories that could be predicted from microarray data in the supervised ap-proaches were restricted to broad categories with many representatives. In part this could be due to insufficient examples for robust model building, however unsupervised methods are not limited by annotation category size and have proved useful in predicting general functions such
Table 1.5: Expression rule set generated from time series microarray data
Biological Process: transport
1 2Hr - 4Hr (Decreasing) AND 12Hr - 20Hr (Increasing) 2 2Hr - 6Hr (Decreasing)
3 12Hr - 20Hr (Increasing)
as ‘transcription factor’. Key considerations when dealing with microarray experimental data are the selection of experiments and types of expression profiles to be included. In the case of the yeast SVM study, these were selected by ‘experts’ (Brown et al. 2000).
Function prediction from protein-protein interactions
Protein-protein interaction data can be generated using experimental techniques such as high throughput yeast two hybrid (Y2H) screens, protein arrays, NMR, X-ray crystallography, pull down assays bothin vivoandin vitro, co-immuno precipitation experiments and western blots. Most of these data are stored as binary relationships between two proteins and large data storage and access facilities have been set up for curation and deposition of these data. The INTACT (Hermjakob et al. 2004) database contains 66499 individual interactions and complexes from a variety of sources and organisms from 3464 distinct experiments. Other similar repositories include DIP (Xenarios et al. 2000) with 55000 interactions, BIND (Bader et al. 2003) with over 67000 imported interactions from high and low throughput experiments. The different types of interaction experiments result in varying data qualities. Some interaction experiments provide quantitative binding affinity data whilst others report qualitative relationships.
A variety of promising function prediction methods from protein-protein interaction data have been reported. The methods rely on exploiting binary relationship data from the repositories and constructing networks describing whole organism protein interactions. It has been observed that 70-80% of proteins share at least one function with their interacting partners (Titz et al. 2004). Additionally, proteins of a particular function are likely to interact with proteins of a restricted functional repertoire (Kelly and Stumpf 2008). These two concepts form the basis of protein function prediction from interpretation of protein interaction maps and networks. The simplest methods use a majority rule approach applied to the local interaction neighbourhood of an unannotated protein (Hishigaki et al. 2001) (local neighbourhood frequency approaches). More sophisticated probabilistic approaches have been developed in order to predict protein function by considering entire network architectures (Deng et al. 2002, Letovsky and Kasif 2003, Vazquez et al. 2003) (probabilistic whole network approaches).
Local neighbourhood frequency approaches
interaction map or network. Usually the local neighbourhood comprises only the immediate in-teracting proteins. A protein with unknown function can be annotated by its membership of a neighbourhood of common functions. The known and annotated protein functions in the neigh-bourhood are treated as the set of potential functions of the unknown protein. In the majority rule approach the function most commonly observed with the local neighbourhood is assigned to the unannotated protein. Other approaches have used over-representation statistics such aschi2
Si(J) =
(ni(j)−ei(j))2
ei(j)
(1.6)
to score prospective functions using the frequency of proteins assigned the function in the im-mediate interacting network compared with the frequency of occurrence of the function in the rest of the network (Hishigaki et al. 2001). Here, ni(j)is the number of interaction parters of
proteinP ihaving functionj. ei(j)is the expected number of partners having function j equal
toni(j)xpiwherepiis the fraction of all proteins annotated with functionj.
Local methods rely on the unannotated proteins residing in a part of the network that is heavily populated by well annotated proteins. Often this is not the case and when unannotated proteins do interact with proteins of known function, they are more likely to be part of the 20 - 30% of proteins that do not share common function with their neighbours (Titz et al. 2004). Additionally the statistical power of local analyses is reduced when the neighbourhood sizes are small.
Probabilistic whole network approaches
Whole network approaches consider the structure of the entire network to make function pre-dictions. Typically the candidates are selected from the function annotations of immediate or local interaction partners but scored using a likelihood or probability measure considering the dispersion of annotation labels over the entire network.
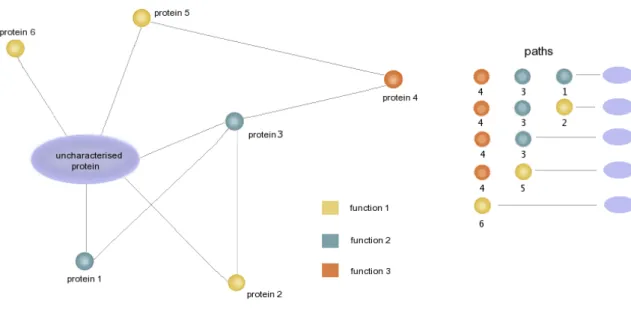
Kirac et al. (2006) considered the local neighbourhood as all proteins sharing interaction paths leading to the uncharacterised protein of interest (see Figure 1.12). The likelihood of each annotation given each path is modelled using background frequencies of observing the path conditioned on a particular annotation category over samples of local neighbourhoods from the network. The final annotation score for an uncharacterised protein is then averaged over all local
paths. Given the example in Figure 1.12, a simple majority rule or neighbourhood count would predict the yellow function as the most likely, however the green function or even orange func-tions might represent the more probable solution, should the paths be more frequently associated with these functions.
Other whole neighbourhood approaches (Deng et al. 2002, Letovsky and Kasif 2003) have used Markov random field theory to assign a probability to a protein having a particular function. Markov random field theory specifies mathematical function