Insurance Coverage, Medical Care Use,
and Short-term Health Changes
Following an Unintentional Injury
or the Onset of a Chronic Condition
Jack Hadley, PhDA
LTHOUGH PRIOR RESEARCH HAS found that uninsured indi-viduals with chronic condi-tions receive less care than in-sured individuals,1,2these studies have neither focused on those who experi-ence the onset of a chronic condition nor analyzed the effect of not having in-surance on health. Other studies have analyzed the effects of insurance sta-tus on individuals who experienced an injury but typically only in a single set-ting or for a narrowly defined type of injury.3-5A substantial literature suggests that not having insurance has adverse ef-fects on medical care use and health.6,7 However, much of this research is sub-ject to methodological limitations be-cause individuals were not randomly as-signed to not having insurance. Analyses of observational data may be biased if unobserved differences be-tween uninsured and insured individu-als, rather than the difference in insur-ance coverage, explain both insurinsur-ance status and the differences in medical care use and health outcomes.8
The RAND Health Insurance Experi-ment,9conducted more than 30 years ago, randomly assigned individuals to different health insurance plans. How-ever, its highest cost-sharing plan was essentially a catastrophic coverage plan and cannot be used to make infer-ences about those without insurance coverage.
Other studies have found that ob-taining Medicare coverage at age 65 years closed the gap in medical care use
Author Affiliation:The Urban Institute, Washington, DC. Corresponding Author:Jack Hadley, PhD, The Ur-ban Institute, 2100 M St NW, Washington, DC 20037 ([email protected]).
Context Given the large and increasing number of uninsured US individuals, identi-fying the health consequences of being uninsured has assumed increased importance. Objective To compare medical care use and short-term health changes among US uninsured individuals and insured nonelderly individuals following a health shock caused by either an unintentional injury or the onset of a chronic condition.
Design, Setting, and Participants Multivariate logistic regression analysis of lon-gitudinal data from Medical Expenditure Panel Surveys (1997-2004) limited to non-elderly individuals whose insurance status was established for 2 months prior to 1 or more unintentional injuries (20 783 cases among 15 866 individuals) and onset of 1 or more chronic conditions (10 485 cases among 7954 individuals).
Main Outcome Measures Self-reported medical care use and change in short-term general health status following the health shock.
Results After experiencing a health shock, uninsured individuals were less likely to ob-tain any medical care (unintentional injury [UI] group: 78.8% uninsured vs 88.7% in-sured [adjusted odds ratio {AOR}, 0.47; 95% confidence interval {CI}, 0.43-0.51]; new chronic condition [NCC] group: 81.7% uninsured vs 91.5% insured [AOR, 0.45; 95% CI, 0.40-0.50]) and more likely not to have received any recommended follow-up care (UI group: 19.3% uninsured vs 9.2% insured [AOR, 2.59; 95% CI, 2.15-3.11]; NCC group: 9.4% uninsured vs 4.4% insured [AOR, 1.65; 95% CI, 1.32-2.06]). Based on the AORs, uninsured individuals with UIs had fewer outpatient visits (6.1% uninsured vs 9.0% in-sured; AOR, 0.71 [95% CI, 0.63-0.80]), office-based visits (41.8% uninsured vs 57.3% insured; AOR, 0.59 [95% CI, 0.56-0.62]), and prescription medicines (35.5% uninsured vs 35.6% insured; AOR, 0.71 [95% CI, 0.67-0.75]). Uninsured individuals with an NCC had fewer office-based visits (58.9% uninsured vs 68.3% insured; AOR, 0.77 [95% CI, 0.72-0.82]) and prescription medicines (52.7% uninsured vs 61.7% insured; AOR, 0.66 [95% CI, 0.57-0.76]). Higher proportions of uninsured individuals reported a decrease in health status (classified as much worse) approximately 3.5 months after the health shock (UI group: 9.8% uninsured vs 6.7% insured; AOR, 0.86 [95% CI, 0.75-0.98]; NCC group: 12.3% uninsured vs 10.1% insured; AOR, 0.74 [95% CI, 0.68-0.80]). Uninsured indi-viduals with UIs were more likely to report not being fully recovered and no longer re-ceiving treatment. At approximately 7 months after the health shock, uninsured indi-viduals with NCCs still reported worse health status.
Conclusions Among individuals who experienced a health shock caused by an un-intentional injury or a new chronic condition, uninsured individuals reported receiving less medical care and poorer short-term changes in health than those with insurance.
JAMA. 2007;297:1073-1084 www.jama.com
between previously uninsured and in-sured individuals,10and that elderly in-dividuals’ mortality rates declined faster than expected following the enact-ment of Medicare in 1965.11Several studies used longitudinal data to com-pare populations grouped by their base-line insurance status and also con-cluded that not having insurance adversely affects health.12-17However, these studies may still be subject to ob-servational data bias because prior health may have affected both the gen-eral measures of the subsequent health change and the baseline health insur-ance status.
This study investigates whether un-insured individuals who experienced a health shock caused by either an un-intentional injury or the onset of a chronic condition received the same amount of medical care and had simi-lar short-term health outcomes as in-sured individuals.
METHODS
The data are from the household com-ponent of the Medical Expenditure Panel Surveys conducted between 1997 and 2004.18The Medical Expen-diture Panel Survey is a continuous, nationally representative, in-person survey of the civilian, noninstitution-alized population. It uses a rotating panel design that replenishes half of the total sample each year and collects information during 5 interview rounds spaced 4 to 5 months apart over 2 years. Individuals’ data can be linked across rounds to build a longi-tudinal round-by-round data file spanning the 2 years of survey partici-pation. The combined response rates for the 1997-2004 Medical Expendi-ture Panel Survey range from 64.5% to 67.4% for the full-year files.19 The Urban Institute’s institutional review board process determined that further review was not required because all of the data are publicly available and do not include any personal identifying information.
The survey collects data on individu-als’ sociodemographic characteristics, monthly insurance coverage, general
health status, and medical care use. A sample of medical care providers iden-tified by respondents are contacted to verify use and obtain additional infor-mation about diagnosis, charges, pay-ments, and specific services provided. Insurance coverage is verified by check-ing insurance cards.20
The initial interview inventories each person’s current health conditions. Sub-sequent interviews ask whether the per-son experienced any new health con-ditions since the previous interview. For each new condition identified, inter-viewers ascertain whether the condi-tion is included on the Department of Health and Human Services’ list of “pri-ority” conditions,21 and whether the condition was due to an injury. Chronic conditions were identified by apply-ing the classification algorithm devel-oped by the Agency for Healthcare Re-search and Quality22to the survey’s International Classification of Diseases, Ninth Revision,condition codes.23
New chronic conditions identified by this process may be either reoccur-rences of a prior chronic condition, such as back pain or depression, that had been resolved before the baseline interview and was not included in the person’s initial condition inventory, or first occurrences of a condition the per-son had never experienced before. Both types of situations are referred to as new chronic conditions even though some of the cases may be reoccurrences of previously resolved conditions.
Priority-list conditions and uninten-tional injuries trigger the addiuninten-tional questions of (1) when the uninten-tional injury occurred and its type and location; (2) when the new condition was first noticed or diagnosed; (3) whether the person sought medical care; (4) the types and amounts of care received; and (5) whether the person is still receiving care at the time of the interview.
Analysis Samples
The research design assumes that prior insurance status in the 2 months be-fore the unintentional injury or new chronic condition can be treated as
ex-ogenous (ie, predetermined and not caused by subsequent medical care use or changes in health associated with the injury or chronic condition). There-fore, the analysis samples are limited to individuals with uniform insurance cov-erage (uninsured or insured) for the 2 months before, the month of, and the month after the health shock. Those with multiple unintentional injuries or new chronic conditions are included as separate observations for each occur-rence. (An additional analysis limit-ing the sample to 1 occurrence per per-son also was conducted.) Individuals aged 65 years or older are excluded be-cause Medicare coverage is virtually universal.
Outcome Measures
There are 8 measures of medical care use: 2 dichotomous indicators of whether the person received any medi-cal care; if he/she did receive care, whether any further care was mended; if further care was recom-mended, a multichotomous indicator of whether the person is still receiving treatment, or received all, some, or none of the recommended follow-up care; and 5 measures of the quantities of care received for inpatient hospital stays, outpatient visits, office-based visits, emergency department visits, and num-ber of prescription medications.
The distributions of the quantity vari-ables are skewed and clustered at a lim-ited number of discrete values, espe-cially 0, 1, and 2. To accommodate this type of distribution in the statistical analysis, these measures were coded as ordered categorical variables. Inpa-tient hospital stays has 4 categories for 0, 1, 2, or 3 or more stays. The other use variables have 6 categories repre-senting 0, 1, 2, 3 to 5, 6 to 10, or 11 or more visits (or prescriptions).
Self-reported general health status has been shown to be a good predictor of both medical care use and mortality both over time and across different populations.24,25Diehr et al26 found that large short-term declines in older adults’ self-reported health measured at 6-month intervals were good
dictors of mortality and other major adverse health events. In this study, the short-term change in health was constructed from individuals’ self-reported general health status, defined by a Likert scale with 5 categories (ex-cellent, very good, good, fair, and poor health), in the interview round before the health shock, and the first and sec-ond (if available) interview rounds after the health shock. The change in health was measured as the arithmetic difference between the preevent (un-intentional injury or new chronic con-dition) and postevent scales. The mea-sure has 9 possible categories (values) ranging from plus 4 (from poor to excellent [the largest possible health improvement]) to negative 4 (from excellent to poor [the largest possible health decline]). A value of 0 repre-sents no change in health.
Among individuals in the uninten-tional injury sample, 26 died and 7 were institutionalized (ie, were resident in a hospital or nursing home forⱖ30 days at the time of the interview). Among those in the new chronic condition sample, 87 died and 3 were institution-alized subsequent to the first follow-up interview. These individuals were as-signed to the category for the maxi-mum decrease in health. Higher propor-tions of the deceased or institutionalized cases did not have insurance in the un-intentional injury group (21.1% vs 16.2%) and in the new chronic condi-tion group (25% vs 13%). The largest dif-ference between the deceased or insti-tutionalized cases and other cases was in their baseline health status. Among de-ceased or institutionalized cases, 25.2% in the unintentional injury group and 21.5% in the new chronic condition group reported poor baseline health com-pared with 2.0% and 4.9% of other cases. (Excluding these cases did not change any of the substantive results reported below.)
An additional health outcome for the unintentional injury sample was con-structed from questions asking whether the person had fully recovered and if not fully recovered whether they were still being treated. The resulting
vari-able was a trichotomous indicator of whether the person was fully recov-ered, still receiving treatment, or not re-covered and not receiving care.
Control Variables
To reduce potential confounding, the statistical models control for the spe-cific health condition that led to inclu-sion in the sample; the type and loca-tion of the unintenloca-tional injury; baseline health and sociodemographic charac-teristics (from the interview before the health shock); the person’s census re-gion and metropolitan residence sta-tus; and a set of survey indicators for the month and year of the event, the survey round of the follow-up inter-view, the time interval between the event and the follow-up interview, and whether the follow-up information is self-reported or obtained from a proxy.
Statistical Analysis
The null hypotheses of no differences between uninsured and insured indi-viduals were tested by estimating mul-tivariate logistic regression models: bi-nomial models for the dichotomous measures; multinomial models for the categorical measures of the amount of follow-up care received and injury out-come; and ordered for the measures of medical care use and change in health status. All cases were weighted using the MEPS person-weights and all mod-els were estimated using the survey lo-gistic regression programs27by Stata-Corp (College Station, Tex). All models include the control variables summa-rized in the previous section.
Although insurance status was ob-served 2 months before the health shock, it is possible that persistent unob-served differences between insured and uninsured individuals may influence both the likelihood of an unintentional injury and the distribution and sever-ity of new health conditions. For ex-ample, insured and uninsured individu-als may differ in terms of risky behaviors (ie, individuals without insurance may be more likely to drive without a seat belt or overuse alcohol whereas individuals with insurance may be more likely to ski
or develop tennis elbow). Prior insur-ance status also can affect the likeli-hood of reporting a condition that typi-cally requires a medical test to be detected, such as hypertension or early stage cancer. It also is possible that an uninsured person who experiences dis-ease symptoms will conceal this infor-mation to obtain insurance coverage be-fore seeking medical care.
While there is no formal statistical test of the assumption that an indepen-dent variable (insurance status) is ex-ogenous,28sensitivity tests can indi-cate whether the estimated effects of insurance are robust with respect to ternative variable specifications and al-ternative sample specifications that may reflect possible unobserved associa-tions between insurance status and the distributions and the severity of the un-intentional injuries and reported chronic conditions.
Therefore, the following sensitivity analyses also were conducted: (1) esti-mating the models without the control variables for the specific health condi-tion to test whether they are correlated with insurance coverage and their omis-sion results in altered estimates; (2) add-ing a self-reported measure of the con-dition’s severity (perceived influence on health); (3) excluding cases if the per-son reported that the health shock had no effect on their health; (4) eliminat-ing cases with specific conditions that appear to be associated with insurance status, based on supplementary regres-sion models of the relationship be-tween insurance status and the indica-tor variables for specific conditions; (5) limiting the sample to individuals with family incomes that are less than 400% of the federal poverty level because fam-ily income is strongly associated with in-surance status and also may reflect un-observed personal differences between insured and uninsured individuals; (6) estimating models limited to 1 occur-rence per person to test for possible bias arising from multiple observations of some individuals; and (7) extending the look-back period for determining insur-ance status to 12 months before the health shock.
In additional analysis designed to estimate the magnitude of the associa-tion with insurance represented by the odds ratios in the primary analyses, the logistic regression models also were used to predict the distributions of the dependent variables first using the actual values of the insurance sta-tus variable and then changing the value for the uninsured from 1 to 0 so that it simulates having insurance. The differences between the predicted
dis-tributions in these hypothetical mod-els illustrate the magnitudes of the associations with not having insurance after controlling for differences in health conditions and other character-istics.
RESULTS
Sample Characteristics
The new chronic condition sample in-cludes 10 485 cases (7954 individu-als) and the unintentional injury sample
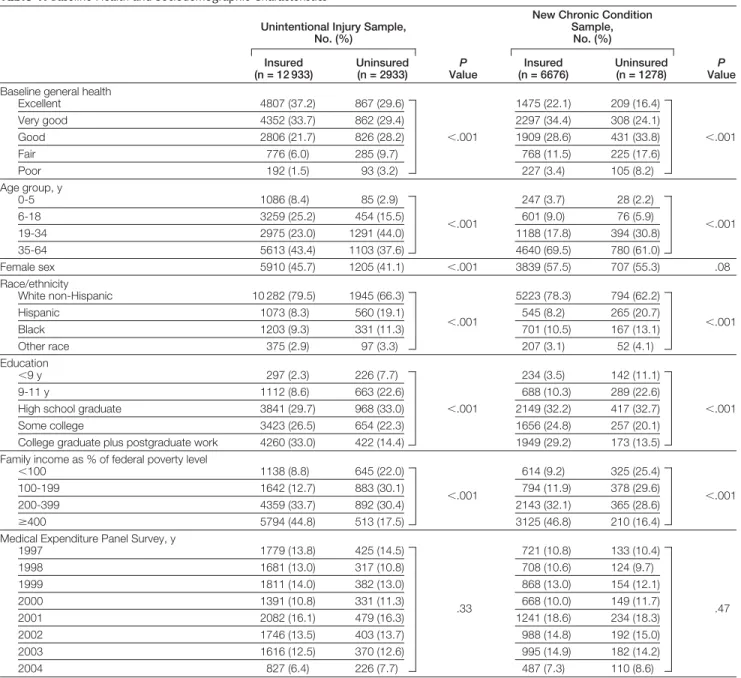
includes 20 783 cases (15 866 individu-als). The baseline health and sociode-mographic characteristics (control vari-ables) by insurance status for each sample are shown inTABLE1.
Uninsured individuals make up 18.5% of the unintentional injury sample and 16.1% of the chronic con-dition sample. More uninsured indi-viduals reported being in fair or poor health at baseline and had family in-comes below 100% of the federal
Table 1.Baseline Health and Sociodemographic Characteristics*
Unintentional Injury Sample, No. (%)
P
Value
New Chronic Condition Sample, No. (%) P Value Insured (n = 12 933) Uninsured (n = 2933) Insured (n = 6676) Uninsured (n = 1278)
Baseline general health
Excellent 4807 (37.2) 867 (29.6) 1475 (22.1) 209 (16.4) Very good 4352 (33.7) 862 (29.4) 2297 (34.4) 308 (24.1) Good 2806 (21.7) 826 (28.2) ⬍.001 1909 (28.6) 431 (33.8) ⬍.001 Fair 776 (6.0) 285 (9.7) 768 (11.5) 225 (17.6) Poor 192 (1.5) 93 (3.2) 227 (3.4) 105 (8.2) Age group, y 0-5 1086 (8.4) 85 (2.9) 247 (3.7) 28 (2.2) 6-18 3259 (25.2) 454 (15.5) ⬍.001 601 (9.0) 76 (5.9) ⬍.001 19-34 2975 (23.0) 1291 (44.0) 1188 (17.8) 394 (30.8) 35-64 5613 (43.4) 1103 (37.6) 4640 (69.5) 780 (61.0) Female sex 5910 (45.7) 1205 (41.1) ⬍.001 3839 (57.5) 707 (55.3) .08 Race/ethnicity White non-Hispanic 10 282 (79.5) 1945 (66.3) 5223 (78.3) 794 (62.2) Hispanic 1073 (8.3) 560 (19.1) 545 (8.2) 265 (20.7) Black 1203 (9.3) 331 (11.3) ⬍.001 701 (10.5) 167 (13.1) ⬍.001 Other race 375 (2.9) 97 (3.3) 207 (3.1) 52 (4.1) Education ⬍9 y 297 (2.3) 226 (7.7) 234 (3.5) 142 (11.1) 9-11 y 1112 (8.6) 663 (22.6) 688 (10.3) 289 (22.6)
High school graduate 3841 (29.7) 968 (33.0) ⬍.001 2149 (32.2) 417 (32.7) ⬍.001 Some college 3423 (26.5) 654 (22.3) 1656 (24.8) 257 (20.1)
College graduate plus postgraduate work 4260 (33.0) 422 (14.4) 1949 (29.2) 173 (13.5) Family income as % of federal poverty level
⬍100 1138 (8.8) 645 (22.0) 614 (9.2) 325 (25.4)
100-199 1642 (12.7) 883 (30.1)
⬍.001 794 (11.9) 378 (29.6) ⬍.001 200-399 4359 (33.7) 892 (30.4) 2143 (32.1) 365 (28.6)
ⱖ400 5794 (44.8) 513 (17.5) 3125 (46.8) 210 (16.4) Medical Expenditure Panel Survey, y
1997 1779 (13.8) 425 (14.5) 721 (10.8) 133 (10.4) 1998 1681 (13.0) 317 (10.8) 708 (10.6) 124 (9.7) 1999 1811 (14.0) 382 (13.0) 868 (13.0) 154 (12.1) 2000 1391 (10.8) 331 (11.3) .33 668 (10.0) 149 (11.7) .47 2001 2082 (16.1) 479 (16.3) 1241 (18.6) 234 (18.3) 2002 1746 (13.5) 403 (13.7) 988 (14.8) 192 (15.0) 2003 1616 (12.5) 370 (12.6) 995 (14.9) 182 (14.2) 2004 827 (6.4) 226 (7.7) 487 (7.3) 110 (8.6)
*Pooled data are from the 1997-2004 Medical Expenditure Panel Surveys. Percentages may not equal 100% due to rounding.
poverty level. Uninsured individuals also were more likely to be racial and ethnic minorities and to have less education.
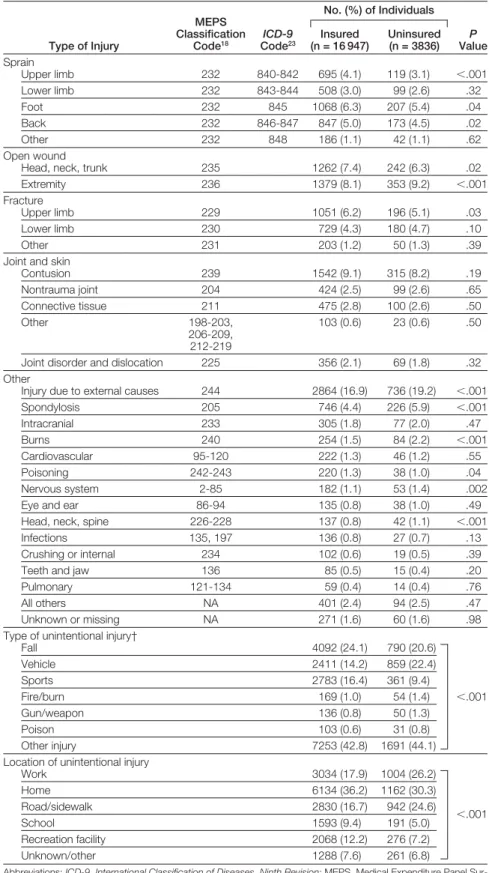
The comparisons of the distribu-tions of the control variables represent-ing the types and locations of the in-juries in the unintentional injury sample are shown inTABLE2 and the vari-ables representing the health condi-tions in the new chronic condition sample are shown inTABLE3.
Association of Insurance Status and Health Outcomes
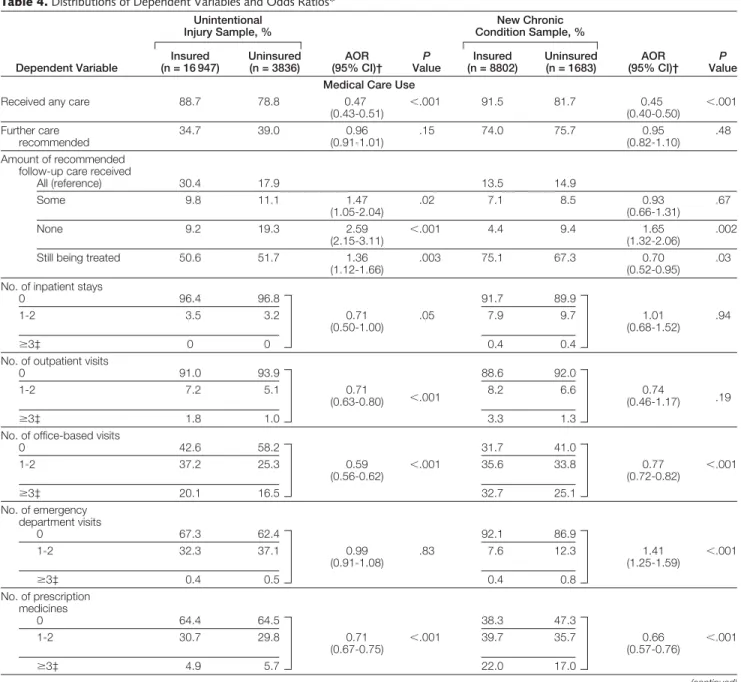
The distributions of the dependent vari-ables and the adjusted odds ratios from the logistic regression models for the insurance status variable in each sample are shown inTABLE4. Uninsured in-dividuals were significantly less likely to see a clinician following an uninten-tional injury or a new chronic condi-tion. However, if an individual did see a clinician, he/she was equally likely to have further care recommended regard-less of insurance status. Despite the equal recommendations for further care, uninsured individuals in the un-intentional injury sample were signifi-cantly more likely to have received none of the recommended follow-up care and significantly less likely to have re-ceived all of the recommended fol-low-up care. In the new chronic con-dition sample, uninsured individuals also were significantly more likely to have received none of the recom-mended follow-up care and were significantly less likely to still be re-ceiving treatment for their chronic condition.
The models for the quantities of medical care indicate that uninsured individuals had significantly fewer office-based visits and prescription medicines in both samples. (The rela-tive odds represent the proportional odds ratio of being in the next higher quantity category.) In the new chronic condition sample, uninsured individu-als had significantly more emergency department visits and similar num-bers of inpatient hospital stays as those with insurance. The number of
emer-Table 2.Types and Locations of Injuries in the Unintentional Injury Sample*
Type of Injury MEPS Classification Code18 ICD-9 Code23 No. (%) of Individuals P Value Insured (n = 16 947) Uninsured (n = 3836) Sprain Upper limb 232 840-842 695 (4.1) 119 (3.1) ⬍.001 Lower limb 232 843-844 508 (3.0) 99 (2.6) .32 Foot 232 845 1068 (6.3) 207 (5.4) .04 Back 232 846-847 847 (5.0) 173 (4.5) .02 Other 232 848 186 (1.1) 42 (1.1) .62 Open wound
Head, neck, trunk 235 1262 (7.4) 242 (6.3) .02 Extremity 236 1379 (8.1) 353 (9.2) ⬍.001 Fracture
Upper limb 229 1051 (6.2) 196 (5.1) .03 Lower limb 230 729 (4.3) 180 (4.7) .10
Other 231 203 (1.2) 50 (1.3) .39
Joint and skin
Contusion 239 1542 (9.1) 315 (8.2) .19 Nontrauma joint 204 424 (2.5) 99 (2.6) .65 Connective tissue 211 475 (2.8) 100 (2.6) .50 Other 198-203, 206-209, 212-219 103 (0.6) 23 (0.6) .50
Joint disorder and dislocation 225 356 (2.1) 69 (1.8) .32 Other
Injury due to external causes 244 2864 (16.9) 736 (19.2) ⬍.001 Spondylosis 205 746 (4.4) 226 (5.9) ⬍.001 Intracranial 233 305 (1.8) 77 (2.0) .47 Burns 240 254 (1.5) 84 (2.2) ⬍.001 Cardiovascular 95-120 222 (1.3) 46 (1.2) .55 Poisoning 242-243 220 (1.3) 38 (1.0) .04 Nervous system 2-85 182 (1.1) 53 (1.4) .002 Eye and ear 86-94 135 (0.8) 38 (1.0) .49 Head, neck, spine 226-228 137 (0.8) 42 (1.1) ⬍.001 Infections 135, 197 136 (0.8) 27 (0.7) .13 Crushing or internal 234 102 (0.6) 19 (0.5) .39 Teeth and jaw 136 85 (0.5) 15 (0.4) .20 Pulmonary 121-134 59 (0.4) 14 (0.4) .76 All others NA 401 (2.4) 94 (2.5) .47 Unknown or missing NA 271 (1.6) 60 (1.6) .98 Type of unintentional injury†
Fall 4092 (24.1) 790 (20.6) Vehicle 2411 (14.2) 859 (22.4) Sports 2783 (16.4) 361 (9.4) Fire/burn 169 (1.0) 54 (1.4) ⬍.001 Gun/weapon 136 (0.8) 50 (1.3) Poison 103 (0.6) 31 (0.8) Other injury 7253 (42.8) 1691 (44.1) Location of unintentional injury
Work 3034 (17.9) 1004 (26.2) Home 6134 (36.2) 1162 (30.3) Road/sidewalk 2830 (16.7) 942 (24.6) ⬍.001 School 1593 (9.4) 191 (5.0) Recreation facility 2068 (12.2) 276 (7.2) Unknown/other 1288 (7.6) 261 (6.8)
Abbreviations:ICD-9,International Classification of Diseases, Ninth Revision; MEPS, Medical Expenditure Panel Sur-veys; NA, not applicable.
*Pooled data from the 1997-2004 MEPS.
†Type of injury sums to greater than 100% because some observations report an injury as being of more than 1 type.
gency department visits did not vary sig-nificantly by insurance status in the unintentional injury sample.
Table 4 also shows that uninsured in-dividuals in the chronic condition sample reported significantly worse short-term health changes at the first follow-up interview (approximately 3.5 months after the health shock), and that uninsured individuals in the uninten-tional injury sample were signifi-cantly more likely to report that they were not fully recovered and were no longer being treated. The difference in
health change was not statistically sig-nificant between insured and unsured persons in the unintentional in-jury sample at the second follow-up interview (approximately 7 months af-ter the health shock). In contrast, the difference in health change persisted and remained statistically significant for those in the new chronic condition sample.
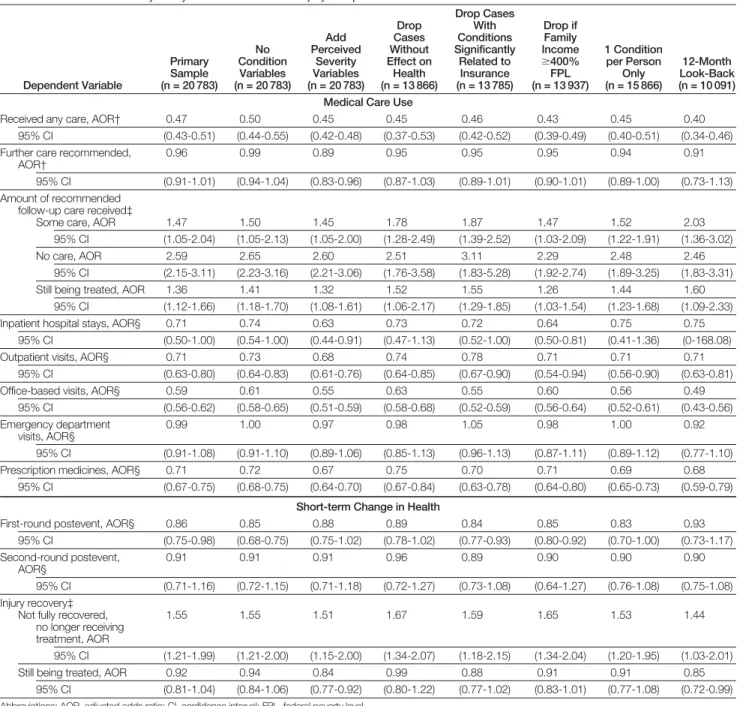
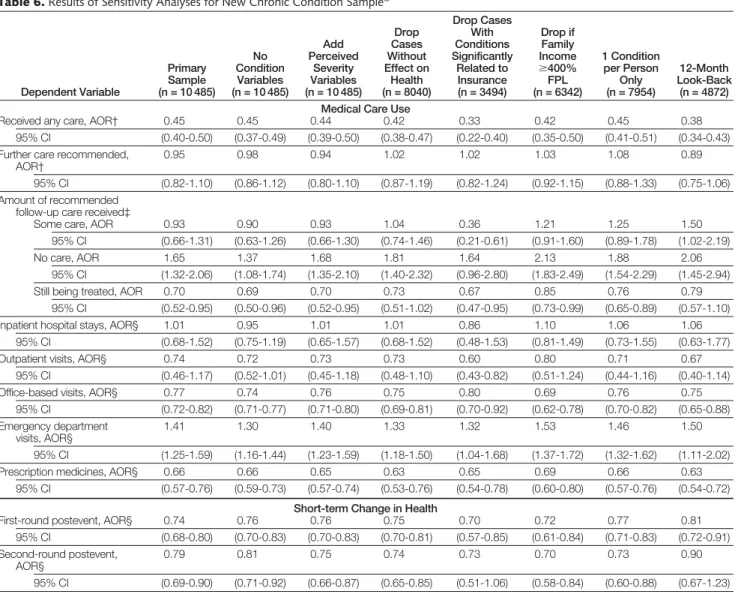
The results of the sensitivity analy-ses are reported inTABLE5andTABLE6. The range of estimates from these al-ternative analyses cluster in a narrow
range around those reported in Table 4, and the results generally remain statis-tically significant when the variation re-duces the sample size.
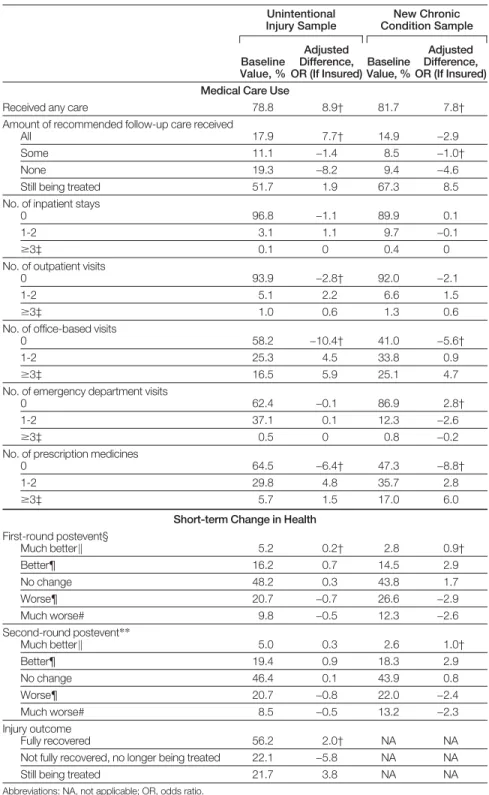
Using the models to estimate the hy-pothetical change in outcomes that may occur if those who did not have insur-ance acquired insurinsur-ance (TABLE7),
hav-ing insurance would be associated with an increase in the proportions seeing a clinician by 8.9% in the uninten-tional injury sample and by 7.8% in the new chronic condition sample. If in-sured, the proportion who received
Table 3.Health Conditions in the New Chronic Condition Sample*
Health Condition ICD-9 Code23 No. (%) of Individuals P Value Insured (n = 8802) Uninsured (n = 1683) Mental health Neurotic disorder 300 616 (7.0) 107 (6.4) .05
Acute reaction to stress 308 238 (2.7) 69 (4.1) ⬍.001
Depressive disorder 311 982 (11.2) 237 (14.1) .01
Other mental disorder 290-319, V40 255 (2.9) 62 (3.7) .05 Musculoskeletal system
and connective tissue
Arthropathy/arthritis 716 414 (4.7) 66 (3.9) .20
Intervertebral disc disorder 722 255 (2.9) 27 (1.6) ⬍.001
Back disorder 724 903 (10.3) 203 (12.1) .08 Other 710, 714, 715, 717, 720-723, 725-730, 732 255 (2.9) 62 (3.7) .05 Cardiovascular Essential hypertension 401 1135 (12.9) 225 (13.4) .58
Acute myocardial infarction 410-412 141 (1.6) 34 (2.0) .12 Other heart and circulatory 402-459 502 (5.7) 104 (6.2) .58 Respiratory tract
Asthma 493 519 (5.9) 57 (3.4) ⬍.001
Other 460-519 236 (2.7) 42 (2.5) .59
Cancer (malignant neoplasms)
Digestive and respiratory 141-164 70 (0.8) 15 (0.9) .72
Bone and skin 107-172,
174-176 88 (1.0) 8 (0.5) .18 Skin 173 176 (2.0) 15 (0.9) ⬍.001 Genitourinary organ 179-189 88 (1.0) 12 (0.7) .02 Other neoplasms 191-239 167 (1.9) 24 (1.4) .09 Blood disorder Diabetes mellitus 250, V56 378 (4.3) 111 (6.6) ⬍.001
Other endocrine, blood, or liver disorder
42, 135, 240-289, 555,
573, V08
106 (1.2) 25 (1.5) .54
Nervous system condition 320-389 255 (2.9) 40 (2.4) .27
Other
Lipid metabolism disorder 272 898 (10.2) 109 (6.5) ⬍.001 Genitourinary system disorder 580-629 63 (0.7) 12 (0.7) .78
Skin disorder or ulcer 696-707 62 (0.7) 17 (1.0) .35
Abbreviation:ICD-9,International Classification of Diseases, Ninth Revision.
*Pooled data from the 1997-2004 Medical Expenditure Panel Surveys.
none of the recommended follow-up care would decrease by more than 40% in both samples. In the unintentional injury sample, most of the decrease would be offset by an increase in the proportion receiving all of the recom-mended care. In the new chronic con-dition sample, the proportions receiv-ing some or all of the recommended care also would decline, with the per-centage still receiving treatment ab-sorbing the decreases in the other categories.
In these hypothetical models, the per-centages of uninsured individuals re-ceiving care would increase for outpa-tient visits, office-based visits, and number of prescription medications, whereas uninsured individuals would have fewer emergency department vis-its in the chronic condition sample, im-plying that the locus of care may shift from emergency departments to other ambulatory care settings.
In these hypothetical analyses, smaller proportions of uninsured individuals
would experience substantial short-term health deteriorations (a change of 2 or more health states: from excellent health to good, fair, or poor; from very good health to fair or poor; or from good health to poor health) and correspond-ingly larger proportions would experi-ence improved health. In the uninten-tional injury sample, the proportion of uninsured individuals who stop receiv-ing treatment before they were fully re-covered would decrease by 5.8% from the baseline value of 22.1%.
Table 4.Distributions of Dependent Variables and Odds Ratios*
Dependent Variable Unintentional Injury Sample, % AOR (95% CI)† P Value New Chronic Condition Sample, % AOR (95% CI)† P Value Insured (n = 16 947) Uninsured (n = 3836) Insured (n = 8802) Uninsured (n = 1683) Medical Care Use
Received any care 88.7 78.8 0.47
(0.43-0.51) ⬍ .001 91.5 81.7 0.45 (0.40-0.50) ⬍ .001 Further care recommended 34.7 39.0 0.96 (0.91-1.01) .15 74.0 75.7 0.95 (0.82-1.10) .48 Amount of recommended follow-up care received
All (reference) 30.4 17.9 13.5 14.9 Some 9.8 11.1 1.47 (1.05-2.04) .02 7.1 8.5 0.93 (0.66-1.31) .67 None 9.2 19.3 2.59 (2.15-3.11) ⬍ .001 4.4 9.4 1.65 (1.32-2.06) .002
Still being treated 50.6 51.7 1.36 (1.12-1.66)
.003 75.1 67.3 0.70 (0.52-0.95)
.03
No. of inpatient stays
0 96.4 96.8 91.7 89.9 1-2 3.5 3.2 0.71 (0.50-1.00) .05 7.9 9.7 1.01 (0.68-1.52) .94 ⱖ3‡ 0 0 0.4 0.4
No. of outpatient visits
0 91.0 93.9 88.6 92.0 1-2 7.2 5.1 0.71 (0.63-0.80) ⬍.001 8.2 6.6 0.74 (0.46-1.17) .19 ⱖ3‡ 1.8 1.0 3.3 1.3
No. of office-based visits
0 42.6 58.2 31.7 41.0 1-2 37.2 25.3 0.59 (0.56-0.62) ⬍ .001 35.6 33.8 0.77 (0.72-0.82) ⬍ .001 ⱖ3‡ 20.1 16.5 32.7 25.1 No. of emergency department visits 0 67.3 62.4 92.1 86.9 1-2 32.3 37.1 0.99 (0.91-1.08) .83 7.6 12.3 1.41 (1.25-1.59) ⬍ .001 ⱖ3‡ 0.4 0.5 0.4 0.8 No. of prescription medicines 0 64.4 64.5 38.3 47.3 1-2 30.7 29.8 0.71 (0.67-0.75) ⬍ .001 39.7 35.7 0.66 (0.57-0.76) ⬍ .001 ⱖ3‡ 4.9 5.7 22.0 17.0 (continued)
COMMENT
The results of these analyses suggest that an uninsured person who experi-ences an unintentional injury or a new chronic condition has greater diffi-culty obtaining recommended medi-cal care and takes longer to return to full health, if at all. These findings are consistent with and reinforce earlier re-search showing that uninsured indi-viduals receive significantly less care than those with insurance and have poorer health outcomes.6,7
The finding that there were no dif-ferences in the likelihood of having fur-ther care recommended if a clinician was seen suggests that either there were no differences in severity or, more
prob-ably, that the severity threshold for rec-ommending care is higher for an un-insured person than a person with insurance. If the latter, the major and significant differences in receiving fol-low-up care reinforce the inference that differences in the amounts of care re-ceived are at least partially related to poorer health outcomes in uninsured individuals.
If health remains compromised, it could make it more difficult for an un-insured person to obtain health insur-ance in the future, and could also con-t r i b u con-t e con-t o r e d u c e d l a b o r f o r c e participation, lower productivity, and lower future income. Although the change in health is measured over only
a relatively short period, other re-search suggests that the progression from good to poor health resulting from lack of health insurance is cumulative and gradually leads to higher mortal-ity rates for uninsured individuals over time.13
The findings for uninsured individu-als with a new chronic condition are of particular concern. Because chronic conditions generally require care over an extended period, the finding that the uninsured are more likely to report no longer being treated at the first fol-low-up interview suggests that their care may have been inadequate. More-over, their greater dependence on emer-gency departments for care probably in-Table 4.Distributions of Dependent Variables and Odds Ratios*(cont)
Dependent Variable Unintentional Injury Sample, % AOR (95% CI)† P Value New Chronic Condition Sample, % AOR (95% CI)† P Value Insured (n = 16 947) Uninsured (n = 3836) Insured (n = 8802) Uninsured (n = 1683) Short-term Change in Health
First-round postevent§ Much better㛳 3.3 5.2 3.0 2.8 Better¶ 15.6 16.2 13.9 14.5 No change 53.5 48.2 0.86 (0.75-0.98) .03 47.5 43.8 0.74 (0.68-0.80) ⬍.001 Worse¶ 21.0 20.7 25.5 26.6 Much worse# 6.7 9.8 10.1 12.3 Second-round postevent** Much better㛳 3.7 5.0 4.2 2.6 Better¶ 17.3 19.4 16.2 18.3 No change 51.2 46.4 0.91 (0.71-1.16) .42 47.4 43.9 0.79 (0.69-0.90) .001 Worse¶ 21.3 20.7 22.5 22.0 Much worse# 6.4 8.5 9.7 13.2
Unintentional injury outcome
Fully recovered (reference) 63.4 56.2 NA NA Not fully recovered,
no longer being treated
14.6 22.1 1.55 (1.21-1.99)
.001 NA NA NA NA
Still being treated 22.0 21.7 0.92 (0.81-1.04)
.19 NA NA
Abbreviations: AOR, adjusted odds ratio; CI, confidence interval; NA, not applicable.
*Pooled data from the 1997-2004 Medical Expenditure Panel Surveys. All models include dichotomous control variables for theInternational Classification of Diseases, Ninth Re-vision,233-digit condition category, metropolitan area residence, census region, the interview round before the unintentional injury or new chronic condition, month of the
unin-tentional injury or new chronic condition, year of the uninunin-tentional injury or new chronic condition, months between the date of the uninunin-tentional injury or new chronic condition and the follow-up interview, whether information was provided by a proxy and the following baseline characteristics: marital status (for adults), 1 or no parents in household (for children), age category, female sex, race/ethnicity, education level (adults), family income relative to the federal poverty level, self-reported general health status, and self-reported mental health status. Models estimated for the unintentional injury sample also include dichotomous control variables for the type and location of the unintentional injury and an interaction variable representing unintentional injuries that occurred at work for uninsured individuals.
†Binomial logistic for received any care and further care recommended; multinomial logistic for amount of recommended care received and unintentional injury outcome; ordered logistic for quantities of medical care and change in health status.
‡Larger values are collapsed for presentation.
§Unintentional injury sample: average of 3.4 months between event and first follow-up interview; new chronic condition sample: average of 3.6 months between event and first follow-up interview.
㛳Shift of 2 or more health states: poor to very good, good, or excellent; fair to very good or excellent; good to excellent. ¶Shift (increase or decrease) to adjoining health states.
#Shift of 2 or more health states: excellent to good, fair, or poor; very good to fair or poor; or good to poor.
**Unintentional injury sample: average of 6.9 months between event and second follow-up interview; new chronic condition sample: average of 7.3 months between event and second follow-up interview.
creases the likelihood that their care will be episodic and lack continuity. For in-dividuals who require treatment for chronic conditions, a continuing rela-tionship with a clinician and appropri-ate medication use may be especially important for improving or maintain-ing health status.
Although the differences between the proportions of uninsured and insured individuals who experienced much poorer health were not large in absolute terms, these patients often require costly care and are at increased risk for death and disability. Thus, it is possible that savings in future medical
costs may be larger than implied by the small absolute percentage changes between insured and uninsured indi-viduals.
The problem of an increasing pro-portion of individuals without health insurance is likely to worsen if health insurance premium growth continues
Table 5.Results of Sensitivity Analyses for Unintentional Injury Sample*
Dependent Variable Primary Sample (n = 20 783) No Condition Variables (n = 20 783) Add Perceived Severity Variables (n = 20 783) Drop Cases Without Effect on Health (n = 13 866) Drop Cases With Conditions Significantly Related to Insurance (n = 13 785) Drop if Family Income ⱖ400% FPL (n = 13 937) 1 Condition per Person Only (n = 15 866) 12-Month Look-Back (n = 10 091) Medical Care Use
Received any care, AOR† 0.47 0.50 0.45 0.45 0.46 0.43 0.45 0.40 95% CI (0.43-0.51) (0.44-0.55) (0.42-0.48) (0.37-0.53) (0.42-0.52) (0.39-0.49) (0.40-0.51) (0.34-0.46) Further care recommended,
AOR†
0.96 0.99 0.89 0.95 0.95 0.95 0.94 0.91
95% CI (0.91-1.01) (0.94-1.04) (0.83-0.96) (0.87-1.03) (0.89-1.01) (0.90-1.01) (0.89-1.00) (0.73-1.13) Amount of recommended
follow-up care received‡
Some care, AOR 1.47 1.50 1.45 1.78 1.87 1.47 1.52 2.03 95% CI (1.05-2.04) (1.05-2.13) (1.05-2.00) (1.28-2.49) (1.39-2.52) (1.03-2.09) (1.22-1.91) (1.36-3.02) No care, AOR 2.59 2.65 2.60 2.51 3.11 2.29 2.48 2.46
95% CI (2.15-3.11) (2.23-3.16) (2.21-3.06) (1.76-3.58) (1.83-5.28) (1.92-2.74) (1.89-3.25) (1.83-3.31) Still being treated, AOR 1.36 1.41 1.32 1.52 1.55 1.26 1.44 1.60
95% CI (1.12-1.66) (1.18-1.70) (1.08-1.61) (1.06-2.17) (1.29-1.85) (1.03-1.54) (1.23-1.68) (1.09-2.33) Inpatient hospital stays, AOR§ 0.71 0.74 0.63 0.73 0.72 0.64 0.75 0.75
95% CI (0.50-1.00) (0.54-1.00) (0.44-0.91) (0.47-1.13) (0.52-1.00) (0.50-0.81) (0.41-1.36) (0-168.08) Outpatient visits, AOR§ 0.71 0.73 0.68 0.74 0.78 0.71 0.71 0.71
95% CI (0.63-0.80) (0.64-0.83) (0.61-0.76) (0.64-0.85) (0.67-0.90) (0.54-0.94) (0.56-0.90) (0.63-0.81) Office-based visits, AOR§ 0.59 0.61 0.55 0.63 0.55 0.60 0.56 0.49
95% CI (0.56-0.62) (0.58-0.65) (0.51-0.59) (0.58-0.68) (0.52-0.59) (0.56-0.64) (0.52-0.61) (0.43-0.56) Emergency department
visits, AOR§
0.99 1.00 0.97 0.98 1.05 0.98 1.00 0.92
95% CI (0.91-1.08) (0.91-1.10) (0.89-1.06) (0.85-1.13) (0.96-1.13) (0.87-1.11) (0.89-1.12) (0.77-1.10) Prescription medicines, AOR§ 0.71 0.72 0.67 0.75 0.70 0.71 0.69 0.68
95% CI (0.67-0.75) (0.68-0.75) (0.64-0.70) (0.67-0.84) (0.63-0.78) (0.64-0.80) (0.65-0.73) (0.59-0.79)
Short-term Change in Health
First-round postevent, AOR§ 0.86 0.85 0.88 0.89 0.84 0.85 0.83 0.93 95% CI (0.75-0.98) (0.68-0.75) (0.75-1.02) (0.78-1.02) (0.77-0.93) (0.80-0.92) (0.70-1.00) (0.73-1.17) Second-round postevent, AOR§ 0.91 0.91 0.91 0.96 0.89 0.90 0.90 0.90 95% CI (0.71-1.16) (0.72-1.15) (0.71-1.18) (0.72-1.27) (0.73-1.08) (0.64-1.27) (0.76-1.08) (0.75-1.08) Injury recovery‡
Not fully recovered, no longer receiving treatment, AOR
1.55 1.55 1.51 1.67 1.59 1.65 1.53 1.44
95% CI (1.21-1.99) (1.21-2.00) (1.15-2.00) (1.34-2.07) (1.18-2.15) (1.34-2.04) (1.20-1.95) (1.03-2.01) Still being treated, AOR 0.92 0.94 0.84 0.99 0.88 0.91 0.91 0.85
95% CI (0.81-1.04) (0.84-1.06) (0.77-0.92) (0.80-1.22) (0.77-1.02) (0.83-1.01) (0.77-1.08) (0.72-0.99) Abbreviations: AOR, adjusted odds ratio; CI, confidence interval; FPL, federal poverty level.
*Pooled data from the 1997-2004 Medical Expenditure Panel Surveys. †Binomial logistic model.
‡Multinomial logistic model. §Ordered logistic model.
to outpace income and wage growth, especially for those with lower incomes.29,30The results of this analy-sis imply that the failure to address the problem of no insurance for US individuals will have adverse health consequences. Moreover, the fact that these consequences apply to unin-sured individuals who experienced unintentional injuries or new chronic conditions runs counter to the per-ception that the uninsured receive care, either through the safety net or their own resources, when they really need it (eg, when they experience a
health shock from an unintentional injury or develop a new chronic con-dition).
This study has several important limitations. Despite the robustness of the results in the sensitivity analyses, bias due to unobserved differences be-tween uninsured and insured individu-als is still possible. Two recent studies of insurance and health status used sta-tistical methods to adjust for possible confounding from unobserved factors in longitudinal samples and found that the adverse effects of not having insur-ance on health status were
under-stated.31,32Thus, even if the results of the sensitivity analyses also are bi-ased, other research suggests that the bias is conservative and the qualita-tive conclusion that uninsured indi-viduals have adverse outcomes in medi-cal care use and health status would still be true.
Second, the health change measure is constructed from subjective self-reported assessments of general health status. A more detailed and more objective health measure, such as the Short Form 3633or the Health and Limitations Index34would
pro-Table 6.Results of Sensitivity Analyses for New Chronic Condition Sample*
Dependent Variable Primary Sample (n = 10 485) No Condition Variables (n = 10 485) Add Perceived Severity Variables (n = 10 485) Drop Cases Without Effect on Health (n = 8040) Drop Cases With Conditions Significantly Related to Insurance (n = 3494) Drop if Family Income ⱖ400% FPL (n = 6342) 1 Condition per Person Only (n = 7954) 12-Month Look-Back (n = 4872) Medical Care Use
Received any care, AOR† 0.45 0.45 0.44 0.42 0.33 0.42 0.45 0.38 95% CI (0.40-0.50) (0.37-0.49) (0.39-0.50) (0.38-0.47) (0.22-0.40) (0.35-0.50) (0.41-0.51) (0.34-0.43) Further care recommended,
AOR†
0.95 0.98 0.94 1.02 1.02 1.03 1.08 0.89
95% CI (0.82-1.10) (0.86-1.12) (0.80-1.10) (0.87-1.19) (0.82-1.24) (0.92-1.15) (0.88-1.33) (0.75-1.06) Amount of recommended
follow-up care received‡
Some care, AOR 0.93 0.90 0.93 1.04 0.36 1.21 1.25 1.50 95% CI (0.66-1.31) (0.63-1.26) (0.66-1.30) (0.74-1.46) (0.21-0.61) (0.91-1.60) (0.89-1.78) (1.02-2.19) No care, AOR 1.65 1.37 1.68 1.81 1.64 2.13 1.88 2.06
95% CI (1.32-2.06) (1.08-1.74) (1.35-2.10) (1.40-2.32) (0.96-2.80) (1.83-2.49) (1.54-2.29) (1.45-2.94) Still being treated, AOR 0.70 0.69 0.70 0.73 0.67 0.85 0.76 0.79
95% CI (0.52-0.95) (0.50-0.96) (0.52-0.95) (0.51-1.02) (0.47-0.95) (0.73-0.99) (0.65-0.89) (0.57-1.10) Inpatient hospital stays, AOR§ 1.01 0.95 1.01 1.01 0.86 1.10 1.06 1.06
95% CI (0.68-1.52) (0.75-1.19) (0.65-1.57) (0.68-1.52) (0.48-1.53) (0.81-1.49) (0.73-1.55) (0.63-1.77) Outpatient visits, AOR§ 0.74 0.72 0.73 0.73 0.60 0.80 0.71 0.67
95% CI (0.46-1.17) (0.52-1.01) (0.45-1.18) (0.48-1.10) (0.43-0.82) (0.51-1.24) (0.44-1.16) (0.40-1.14) Office-based visits, AOR§ 0.77 0.74 0.76 0.75 0.80 0.69 0.76 0.75
95% CI (0.72-0.82) (0.71-0.77) (0.71-0.80) (0.69-0.81) (0.70-0.92) (0.62-0.78) (0.70-0.82) (0.65-0.88) Emergency department
visits, AOR§
1.41 1.30 1.40 1.33 1.32 1.53 1.46 1.50
95% CI (1.25-1.59) (1.16-1.44) (1.23-1.59) (1.18-1.50) (1.04-1.68) (1.37-1.72) (1.32-1.62) (1.11-2.02) Prescription medicines, AOR§ 0.66 0.66 0.65 0.63 0.65 0.69 0.66 0.63
95% CI (0.57-0.76) (0.59-0.73) (0.57-0.74) (0.53-0.76) (0.54-0.78) (0.60-0.80) (0.57-0.76) (0.54-0.72)
Short-term Change in Health
First-round postevent, AOR§ 0.74 0.76 0.76 0.75 0.70 0.72 0.77 0.81 95% CI (0.68-0.80) (0.70-0.83) (0.70-0.83) (0.70-0.81) (0.57-0.85) (0.61-0.84) (0.71-0.83) (0.72-0.91) Second-round postevent,
AOR§
0.79 0.81 0.75 0.74 0.73 0.70 0.73 0.90
95% CI (0.69-0.90) (0.71-0.92) (0.66-0.87) (0.65-0.85) (0.51-1.06) (0.58-0.84) (0.60-0.88) (0.67-1.23) Abbreviations: AOR, adjusted odds ratio; CI, confidence interval; FPL, federal poverty level.
*Pooled data from the 1997-2004 Medical Expenditure Panel Surveys. †Binomial logistic model.
‡Multinomial logistic model. §Ordered logistic model.
vide a more accurate measure of the overall change in health as well as changes in particular dimensions of health status.
Third, the conditions in the new chronic condition sample are neither representative of all chronic condi-tions nor were they consistently coded from medical records. However, the broad similarity of the results across the 2 samples, which had varying mixes of underlying conditions, suggests that the results are not specific to the particu-lar conditions represented in the samples.
Fourth, measures of the quantities of medical care received may not capture variations in either the content or qual-ity of care. Other research documents that uninsured individuals receive lower quality care,35,36which implies that the differences in quantities found in this analysis may understate the difference in the quality-adjusted amounts of care received.
And fifth, the follow-up observa-tion period is too short to determine whether the differences in health out-comes are permanent or transitory, es-pecially in the unintentional injury sample. Longer observation periods are necessary to investigate this issue but data with the requisite information on insurance status and medical care use do not currently exist.
CONCLUSIONS
Among individuals who experienced a health shock caused by an uninten-tional injury or a new chronic condi-tion, uninsured individuals reported re-ceiving less medical care and poorer short-term changes in health than in-dividuals with insurance. If the pro-portion of individuals without insur-ance continues to increase, more and more persons may experience prevent-able deteriorations in their health. Author Contributions:Dr Hadley had full access to all of the data in the study and takes responsibility for the integrity of the data and the accuracy of the data analysis. Dr Hadley was responsible for the concep-tion and design; data acquisiconcep-tion; analysis and inter-pretation of the data; drafting and revising of the manuscript; statistical analysis; obtaining funding; and administrative management.
Fianancial Disclosures:None reported.
Table 7.Adjusted Differences Associated With Uninsured Individuals Hypothetically Having Insurance* Unintentional Injury Sample New Chronic Condition Sample Baseline Value, % Adjusted Difference, OR (If Insured) Baseline Value, % Adjusted Difference, OR (If Insured) Medical Care Use
Received any care 78.8 8.9† 81.7 7.8† Amount of recommended follow-up care received
All 17.9 7.7† 14.9 −2.9
Some 11.1 −1.4 8.5 −1.0†
None 19.3 −8.2 9.4 −4.6
Still being treated 51.7 1.9 67.3 8.5 No. of inpatient stays
0 96.8 −1.1 89.9 0.1
1-2 3.1 1.1 9.7 −0.1
ⱖ3‡ 0.1 0 0.4 0
No. of outpatient visits
0 93.9 −2.8† 92.0 −2.1
1-2 5.1 2.2 6.6 1.5
ⱖ3‡ 1.0 0.6 1.3 0.6
No. of office-based visits
0 58.2 −10.4† 41.0 −5.6†
1-2 25.3 4.5 33.8 0.9
ⱖ3‡ 16.5 5.9 25.1 4.7
No. of emergency department visits
0 62.4 −0.1 86.9 2.8†
1-2 37.1 0.1 12.3 −2.6
ⱖ3‡ 0.5 0 0.8 −0.2
No. of prescription medicines
0 64.5 −6.4† 47.3 −8.8†
1-2 29.8 4.8 35.7 2.8
ⱖ3‡ 5.7 1.5 17.0 6.0
Short-term Change in Health
First-round postevent§ Much better㛳 5.2 0.2† 2.8 0.9† Better¶ 16.2 0.7 14.5 2.9 No change 48.2 0.3 43.8 1.7 Worse¶ 20.7 −0.7 26.6 −2.9 Much worse# 9.8 −0.5 12.3 −2.6 Second-round postevent** Much better㛳 5.0 0.3 2.6 1.0† Better¶ 19.4 0.9 18.3 2.9 No change 46.4 0.1 43.9 0.8 Worse¶ 20.7 −0.8 22.0 −2.4 Much worse# 8.5 −0.5 13.2 −2.3 Injury outcome Fully recovered 56.2 2.0† NA NA
Not fully recovered, no longer being treated 22.1 −5.8 NA NA Still being treated 21.7 3.8 NA NA Abbreviations: NA, not applicable; OR, odds ratio.
*Pooled data from the 1997-2004 Medical Expenditure Panel Surveys.
†Odds ratio for medical care use/health outcome category significantly different from insured,P⬍.05. ‡Larger values are collapsed for presentation.
§Unintentional injury sample: average of 3.4 months between event and first follow-up interview; new chronic conditions: average of 3.6 months between event and first follow-up interview.
㛳Shift of 2 or more health states: poor to very good, good, or excellent; fair to very good or excellent; good to excellent. ¶Shift (increase or decrease) to adjoining health states.
#Shift of 2 or more health states: excellent to good, fair, or poor; very good to fair or poor; or good to poor.
**Unintentional injury sample: average of 6.9 months between event and second follow-up interview; new chronic condi-tions: average of 7.3 months between event and second follow-up interview.
Funding/Support:The research for this article was sup-ported by contracts 04-1102-700 and 01-1282-800 from the Kaiser Family Foundation, Washington, DC. Role of the Sponsor:The sponsor had no role in the design and conduct of the study; or the collection, man-agement, analysis, and interpretation of the data. The sponsor’s staff commented on a preliminary draft of the manuscript but had no role in the preparation, fi-nal review, or approval of the article.
Acknowledgment:Joel Ruhter and Matthew Cra-vens provided computer programming and research assistance at The Urban Institute and were compen-sated as part of their salaries.
REFERENCES
1.Families USA.Getting Less Care: The Uninsured With Chronic Health Conditions.Washington, DC: Families USA; 2001.
2.Stagnitti M. Medical care and treatment for chronic conditions, 2000. http://www.meps.ahrq.gov /mepsweb/data_files/publications/st5/stat05.pdf. Ac-cessed February 19, 2007.
3.Doyle J. Health insurance, treatments and out-comes: using auto accidents as health shocks.Rev Econ Stat. 2005;87:256-270.
4.Haas JS, Goldman L. Acutely injured patients with trauma in Massachusetts: differences in care and mor-tality, by insurance status.Am J Public Health. 1994; 84:1605-1608.
5.Tilford JM, Simpson PM, Yeh TS, et al. Variation in therapy and outcome for pediatric head trauma patients.Crit Care Med. 2001;29:1056-1061. 6.Hadley J. Sicker and poorer: the consequences of being uninsured.Med Care Res Rev. 2003;60(2 suppl) :3S-75S.
7.Institute of Medicine.Care Without Coverage. Washington, DC: National Academy Press; 2002. 8.Levy H, Meltzer D. What do we really know about whether health insurance affects health? In: McLaughlin C, ed.Health Policy and the Uninsured. Washington, DC: Urban Institute Press; 2005. 9.Newhouse J; Insurance Experiment Group.Free for All?LessonsFromtheRANDHealthInsuranceExperiment. Cambridge, Mass: Harvard University Press; 1993. 10.McWilliams JM, Zaslavsky AM, Meara E,
Aya-nian JZ. Impact of Medicare coverage on basic clini-cal services for previously uninsured adults.JAMA. 2003;290:757-764.
11.Lichtenberg F. The effects of Medicare on health care utilization and outcomes. In: Garber A, ed. Fron-tiers in Health Policy Research.Vol 5. Cambridge, Mass: MIT Press; 2002.
12.McWilliams JM, Zaslavsy A, Meara E, Ayanian J. Health insurance coverage and mortality among the near-elderly.Health Aff (Millwood). 2004;23:223-233.
13.Baker DW, Sudano JJ, Durazo-Arvizu R, et al. Health insurance coverage and the risk of decline in overall health and death among the near elderly, 1992-2002.Med Care. 2006;44:277-282. 14.Baker DW, Sudano JJ, Albert JM, et al. Loss of health insurance and the risk for a decline in self-reported health and physical functioning.Med Care. 2002;40:1126-1131.
15.Baker DW, Sudano JJ, Albert JM, et al. Lack of health insurance and decline in overall health in late middle age.N Engl J Med. 2001;345:1106-1112. 16.Sorlie PD, Johnson NJ, Backlund E, Bradham D. Mortality in the uninsured compared with that in per-sons with public and private health insurance.Arch Intern Med. 1994;154:2409-2416.
17.Franks P, Clancy C, Gold M. Health insurance and mortality: evidence from a national cohort.JAMA. 1993;270:737-741.
18. Agency for Healthcare Research and Quality. De-tailed information about the Medical Expenditure Panel Survey. http://www.meps.ahrq.gov/. Accessed Sep-tember 27, 2006.
19.Agency for Healthcare Research and Quality. MEPS-HC response rates by panel. http://www.meps .ahrq.gov/mepsweb/survey_comp/hc_response_rate .jsp. Accessed February 19, 2007.
20.Kreider B, Hill S. What do we know about the effect of insurance when insurance status is sometimes misreported? Paper presented at: Informing Policy on Health Care Costs and Insurance Coverage Confer-ence; May 3, 2006; Washington, DC.
21.Agency for Healthcare Research and Quality. Medical Expenditure Panel Survey HC-078: medical conditions, Appendix 4. http://www.meps.ahrq.gov /mepsweb/data_stats/download_data/pdfs/h78 /h78doc.shtml. Accessed February 19, 2007.
22.Hwang W, Weller W, Ireys H, Anderson G. Out-of-pocket medical spending for care of chronic conditions.Health Aff (Millwood). 2001;20:267-278.
23.World Health Organization.International Clas-sification of Diseases, Ninth Revision (ICD-9).Geneva, Switzerland: World Health Organization; 1977. 24.DeSalvo K, Fan V, McDonell M, Fihn S. Predict-ing mortality and healthcare utilization with a sPredict-ingle question.Health Serv Res. 2005;40:1235-1246. 25.Idler EL, Benyamini Y. Self-rated health and mor-tality: a review of twenty-seven community studies. J Health Soc Behav. 1997;38:21-37.
26.Diehr P, Williamson J, Patrick D, et al. Patterns of self-rated health in older adults before and after sen-tinel health events.J Am Geriatr Soc. 2001;49:36-44. 27.StataCorp. Binary, count, and limited dependent variables. http://www.stata.com/capabilities/binary .html. Accessed September 26, 2006.
28. Engle R, Hendry D, Richard J. Exogeneity. Econometrica. 1983;51:277-304.
29.Gabel J, Claxton G, Gill I, et al. Health benefits in 2005: premium increases slow down, coverage con-tinues to erode.Health Aff (Millwood). 2005;24:1273-1280.
30. Hadley J. The effects of recent employment changes and premium increases on adults’ insurance coverage.Med Care Res Rev. 2006;63:447-476. 31. Hadley J, Waidmann T. Health insurance and health at age 65: implications for Medicare spending on new beneficiaries.Health Serv Res. 2006;41:429-451.
32.Dor A, Sudano J, Baker D. The effects of private insurance on the health of older, working age adults: evidence from the health and retirement study.Health Serv Res. 2006;41(3 part I):759-787.
33. Short Form 36 Web site. http://www.sf-36 .org/. Accessed September 26, 2006.
34.Ericson P, Wilson R, Shannon I. Years of healthy life. In:Statistical Notes No. 7.Hyattsville, Md: Na-tional Center for Health Statistics; 1995.
35.Schoen C, DesRoches C. Uninsured and Unsta-bly Insured: the Importance of Continuous Insurance Coverage.Health Serv Res. 2000;35:187-206. 36.Schoen C, Puleo E. Low–income working fami-lies at risk: uninsured and underserved.J Urban Health. 1998;75:30-49.
Administrative, technical, or material support: Kortebein, Ferrando, Lombeida, Evans. Supervision:Ferrando, Wolfe, Evans.
Financial Disclosures:None reported.
Funding/Support:The work for this research letter was funded by grant PO1AG023591 from the National Institute on Aging (Evans). The studies were conducted in the Gen-eral Clinical Research Center at the University of Arkansas for Medical Sciences and the University of Texas Medical Branch at Galveston, and funded by grant MO1 RR14288 (University of Arkansa Medical Sciences), and MO1 RR 00073 (University of Texas Medical Branch) from the National Center for Research Resources. Role of the Sponsor:These organizations had no role in the design and conduct of the study; collection, management, analysis, and interpretation of the data; and preparation, review, or approval of the manuscript.
Acknowledgment:We thank Douglas Paddon-Jones, PhD, Ola Ronsen, MD, PhD, and T. Brock Symons, PhD, of the University of Texas Medical Branch, Galveston, for their significant contributions toward the completion of this study, including data collection andanalysis,aswellasreviewofthemanuscript.Theseindividualsreceivedcompensation. 1.Paddon-Jones D, Sheffield-Moore M, Urban RJ, et al. Essential amino acid and carbohydrate supplementation ameliorates muscle protein loss in humans during 28 days bedrest.J Clin Endocrinol Metab. 2004;89:4351-4358.
2.Ferrando AA, Tipton KD, Bamman MM, Wolfe RR. Resistance exercise maintains skeletal muscle protein synthesis during bed rest.J Appl Physiol. 1997;82:807-810. 3.Sullivan DH, Sun S, Walls RC. Protein-energy undernutrition among elderly hos-pitalized patients: a prospective study.JAMA. 1999;281:2013-2019.
4.Hoenig HM, Rubinstein LZ. Hospital-associated deconditioning and dysfunction. J Am Geriatr Soc. 1991;39:220-222.
CORRECTIONS
Incorrect Wording:In the Medical News & Perspectives story entitled “Trials Probe New Agents for Kidney Cancer” published in the July 12, 2006, issue ofJAMA (2006;296:155-157), sunitinib was misidentified as a second-line treatment for
advanced renal cell carcinoma. On page 155, column 2, the first full sentence should be “The results led to sunitinib’s approval by the US Food and Drug Administra-tion in January for advanced renal cell carcinoma.”
Mislabeled Column Headings in Table 7:In the Original Contribution entitled “Insurance Coverage, Medical Care Use, and Short-term Health Changes Follow-ing an Unintentional Injury or the Onset of a Chronic Condition” published in the March 14, 2007, issue ofJAMA(2007;297:1073-1084), in Table 7, the column headings for columns 3 and 5 should be “Adjusted Difference, % (if Insured).” The dagger footnote should be “Underlying odds ratios (Table 4) for medical care use/health outcome category significantly different from insured,P⬍.05.” Incorrect References Cited:In the Original Contribution entitled “Trends in Emer-gency Medicaid Expenditures for Recent and Undocumented Immigrants” pub-lished in the March 14, 2007, issue ofJAMA(2007;297:1085-1092), 3 sentences cited incorrect references. On page 1090, within the Comment section, the sec-ond full sentence “In California, for example, a study in 2000 concluded that elimi-nation of public funding for the prenatal care of undocumented immigrants would prove far more costly to taxpayers by substantially increasing low-birth weight, prematurity, and postnatal costs.33” should cite reference 32. The third sentence “Only 8 states have taken advantage of a 2002 “unborn child” option under the State Children’s Health Insurance Program, which applies federal matching dol-lars to prenatal care coverage for undocumented women, while 5 additional states provide state funding for prenatal care regardless of immigration status.7,30” should cite reference 44 instead of 30. The fifth sentence “Immigrants, and particularly Hispanic immigrants, account for a disproportionate number of workplace inju-ries and fatalities in the United States.35” should cite “US Department of Labor. Occupational Safety and Health Administration’s efforts to protect immigrant work-ers, statement of John L. Henshaw, Assistant Secretary of Labor for Occupational Safety and Health before the Subcommittee on Employment, Safety and Training Committee on Health, Education, Labor and Pensions, United States Senate, Feb-ruary 27, 2002. http://www.osha.gov/pls/oshaweb/owadisp.show_document ?p_table=TESTIMONIES&p_id=286. Accessed November 2, 2006,” which is not listed among the article’s references.