Does School
Choice Work?
Effects on Student
Integration and
Achievement
••
• Julian R. Betts Lorien A. Rice Andrew C. Zau Y. Emily Tang Cory R. Koedel
Public
Policy
Institute
of
California
Does School
Choice Work?
Effects on Student
Integration and
Achievement
• • • Julian R. Betts Lorien A. Rice Andrew C. Zau Y. Emily Tang Cory R. Koedel 2006Library of Congress Cataloging-in-Publication Data
Does school choice work? : effects on student integration and achievement / Julian R. Betts ... [et al.].
p. cm.
ISBN-13: 978-1-58213-114-6 ISBN-10: 1-58213-114-7
1. School choice—California—San Diego. 2. Public schools—California—San Diego. 3. School integration—California—San Diego. 4. Academic achievement— California—San Diego. I. Betts, Julian R.
LB1027.9.D63 2006
379.1'110973—dc22
2006023825
Research publications reflect the views of the authors and do not necessarily reflect the views of the staff, officers, or Board of Directors of the Public Policy Institute of California.
Copyright © 2006 by Public Policy Institute of California All rights reserved
San Francisco, CA
Short sections of text, not to exceed three paragraphs, may be quoted without written permission provided that full attribution is given to the source and the above copyright notice is included.
PPIC does not take or support positions on any ballot measure or on any local, state, or federal legislation, nor does it endorse, support, or oppose any political parties or candidates for public office.
Foreword
To even the most informed parents, tracking the evolution of school reform can be a daunting task. There is plenty of public information on the poor test performance of many of our nation’s children. There is much less systematic information on what is being done about it and which programs have the greatest chance of success. Reform programs are numerous, ranging from test-based accountability to putting mayors in charge of school systems. Some examine how schools are organized and focus on best practices, tracking, class size, and “whole-school” reform. Others stress the importance of teaching and learning through improved math instruction, English-language learning, and the design of professional development. Families with children in our public schools might well experience one or more of these and other reform efforts and reasonably ask: “Are any of these programs making a difference?”
More assessments of school reform are under way today than perhaps ever before in the history of American education. And most of these assessments are trying to answer that very question. This PPIC report, Does School Choice Work? Effects on Student Integration and Achievement, answers that question for a category of school reform programs known as school choice. School choice allows the parent and student to select a school other than the one in their immediate neighborhood. It is argued that choice gives students in below-average schools a chance to attend better schools, thus improving their
achievement. A second argument is that once students begin to “vote with their feet,” school principals will want to compete for the best students and therefore have incentives to provide the best possible education to the student “consumer.”
In the early 2000s in the San Diego Unified School District, 28 percent of students chose alternative schools. Because of an extensive database compiled by SDUSD in cooperation with PPIC, the authors were in a unique position to find out who chose to attend an alternative school
and whether that choice made any difference in academic achievement. The findings are striking. Black students were twice as likely as others to apply for an alternative school under one of four programs. And test scores were not the primary factor in influencing the decision to try an alternative school. Overall, the choice programs in San Diego are increasing the integration of whites and nonwhites, and decreasing very mildly the integration of students with low and high test scores.
The second major conclusion is that on the whole there was no systemic improvement or deterioration in test scores from participating in a choice program. There were some exceptions to this, but it is clear that school choice did not improve student performance in quite the way its proponents had hoped. Nevertheless, the authors conclude that high academic achievement may not be the sole criterion for the “good” school parents want their children to attend. Physical safety and generally higher socioeconomic settings might have also played a part in the decision—or else parents may have simply overestimated the benefits of a new school on their child’s academic achievements.
These findings from SDUSD are important for other districts in California and for the nation as a whole. First, the data are collected in a way that makes them some of the best for analyzing the tough question: “Did it make a difference?” Second, the federal No Child Left Behind law requires that students at schools judged to be failing be provided district-funded busing to another school. At a minimum, the results from San Diego raise doubts about the ability of choice programs alone to increase the achievement of participants. They also suggest that parents and students may be expecting more from an improved public education system than higher test scores. Whatever the implications for No Child Left Behind and for other pressures to move toward choice, there is now a solid set of findings on one of the most dramatic school choice experiences in the United States, and the watchword should be: “Proceed with caution.”
David W. Lyon President and CEO
Summary
School choice refers to the various ways parents can choose a school for their children. Throughout U.S. history, parents have been able to choose among schools indirectly by choosing where to live. But today, many other avenues are also available. For instance, many districts offer open-enrollment programs, busing and magnet school programs, charter schools, and, in a few cases, vouchers that allow some families to send their children to private schools.
Throughout its long and varied history, school choice has been a controversial topic in American politics. Proponents argue that more affluent families have long enjoyed school choice, through both private schools and the ability to move to better schools by buying a house in the school’s attendance area. Wider school choice merely opens up some of these same opportunities to less affluent families, proponents contend. In addition, they say, school choice can better serve the disparate needs of heterogeneous students than can the stereotypical “one-size-fits-all” school administered by district officials. Finally, proponents argue that greater competition among public—and perhaps private—schools for students will boost the quality of education through competitive pressures.
Opponents of school choice enumerate several problems. An expanded system of choice could leave some students behind, possibly in failing schools. Choice, they argue, by allowing students to leave their local schools at will, could result in the resegregation of the nation’s schools along lines of race, ethnicity, and socioeconomic status.
Although the term “choice” can also encompass voucher programs, which provide public subsidies for students to attend private schools, and which have been implemented in several cities nationwide, such
programs are limited in scope. Rather, various forms of public school choice, such as traditional busing, magnet schools, open-enrollment programs, and, more recently, charter schools, provide the main form of
school choice in America today and are likely to do so for some time to come. They are also the four options offered at the San Diego Unified School District (SDUSD), and so voucher programs are not a part of this study.
Focus of This Report
We focus on three related but broader issues of school choice: • How students make decisions about whether to leave their local
school.
• How school choice programs affect the level of integration among students, not just along lines of race and ethnicity but also along lines of academic achievement, language, and socioeconomic status.
• The effects on reading and math achievement for students who choose to leave their local schools.
Our findings on these issues should be of interest to audiences well beyond San Diego. In California as a whole, state mandates have led to a proliferation of charter schools and open-enrollment programs in other districts, and these are found in many other states across the county.
In addition, the mandates of federal No Child Left Behind (NCLB) legislation give every local, state, and federal education policymaker and administrator an urgent new reason to pay attention to the effect of school choice on achievement and integration. The federal rules require that schools that do not meet NCLB criteria offer busing to their
students to allow them to transfer to better performing schools. And, for schools that fail to improve, another NCLB option is to close and reopen as a charter school.
School Choice in San Diego
SDUSD is the second-largest district in California and the eighth-largest district nationwide. Its students are quite diverse in terms of race, ethnicity, and socioeconomic status. For instance, no race or ethnicity comes close to being a majority of the student population (Hispanics form the largest group at roughly one-third of the student population in a typical year).
The district has implemented four main types of public school choice:
• The Voluntary Ethnic Enrollment Program (VEEP) is a voluntary busing program that has roots in a 1970s court order to desegregate the district, and it survives to this day.
• The district’s magnet program also originates from court orders to desegregate schools. It gives students across the district a chance to attend a magnet school that has a specific academic focus or program, such as bilingual programs and performing arts.
• The Choice program is a state-mandated open-enrollment program (referred to in this report as “open-enrollment,” “Choice,” or sometimes both). Unlike VEEP and magnet programs, the Choice program does not provide busing to students.
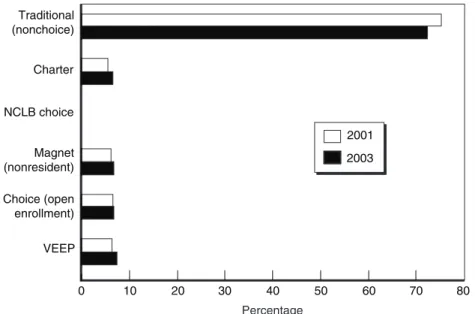
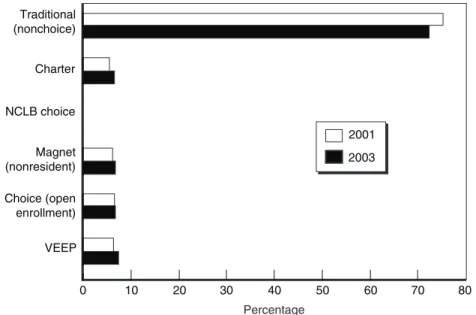
• Finally, SDUSD hosts a growing number of charter schools. These schools are open to all students and are allowed to operate in a relatively autonomous way from the district administration. Overall, SDUSD has a rather high percentage of students in choice programs. In 2003–2004, 28 percent of its students were attending nonlocal schools through the VEEP, magnet, or open-enrollment Choice programs or, alternatively, were enrolled in charter schools. Figure S.1 compares the share of district students in local schools and in each of these four choice programs in the 2001–2002 and 2003–2004 school years.1
The district conducts random drawings for admission to the VEEP, magnet, and the open-enrollment Choice programs; the lottery method allows us to compare outcomes for those randomly chosen to enroll and those not chosen. This provides us with an unusually clean way to evaluate the effect of winning one of these lotteries.
_____________
1The figure also shows another category, which is busing provided under the
requirements of the federal No Child Left Behind law to students at schools that fail to make adequate yearly progress in achievement over two consecutive years. As shown in the figure, virtually no students enrolled in this option during the period we study and so we do not focus on this type of choice.
Percentage 0 10 20 30 40 50 60 70 80 VEEP Choice (open enrollment) Magnet (nonresident) NCLB choice Charter Traditional (nonchoice) 2003 2001
Figure S.1—Proportion of SDUSD Enrollment in Regular Schools and in Various School Choice Programs, 2001–2002 and
2003–2004 School Years
Similarly, charter schools are required by law to conduct lotteries in cases where demand exceeds the supply of slots. However, these lotteries are conducted not centrally but on a school-specific basis. Therefore, we assess the effect of charter schools by comparing the achievement growth of students during years they attend charters to their growth during years when they attend noncharter public schools. Both approaches improve considerably on early research methods that typically compared students in choice programs to students who remained at their local
schools—either those at the “sending” schools or those who were already enrolled at the schools that received students through the busing
program. Such a method creates a classic case of comparing apples to oranges—that is, the “apples”—students who choose to be bused—could differ in important but unobservable ways from the “oranges,” the students in the comparison group, which could consist of those students who stay behind or new classmates at the receiving schools.
Who Exercises Choice in San Diego and Why
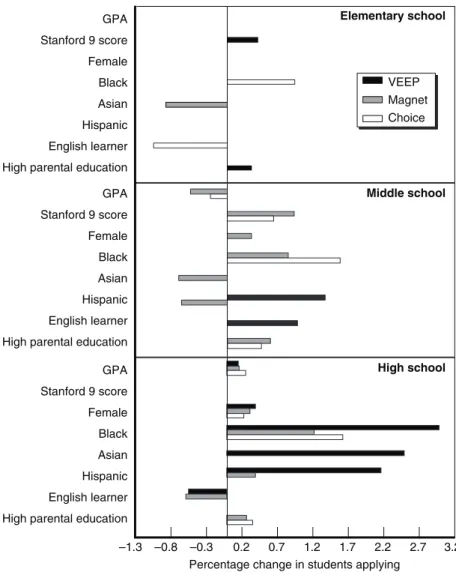
Our first research goal is to understand what causes an individual student to exercise choice by applying to leave his or her current school. Chapter 2 focuses on which students apply to the alternative programs that SDUSD offers and what they seem to be looking for in a new school. This task was made easier by the availability of centralized data on all applications in the centrally administered VEEP, magnet, and open-enrollment Choice programs in San Diego.Our results provide some support for the argument that choice programs are skimming off high-ability students, but the evidence is fairly weak. In many instances, students with high test scores and high levels of parental education are found to be no more likely than their peers to apply to school choice programs. Patterns related to students’ grade point averages are decidedly mixed. For all three of these variables—test scores, GPA, and parental education levels—even when the results are positive and statistically significant, the magnitude of the effects is relatively small.
One of the strongest results of our applicant analysis is that nonwhite students are generally more likely to participate than whites. Blacks in particular show strong propensities for applying to school choice programs and at the high school level, all nonwhite groups show a stronger probability than whites of applying. For example, the overall application rate to VEEP for our high school sample is 3.4 percent but in our models, after controlling for all other observable characteristics, we find that blacks have a probability of applying that is 3 percentage points higher than that for whites. These numbers suggest that black students are almost twice as likely as white students to apply to VEEP.
In the lower grades, however, the results on student race are somewhat weaker for Hispanics, and Asians show modest negative differences from whites. The good news for those concerned about the effect of choice on integration is that overall, nonwhite students clearly stand to gain from any benefits that school choice programs may provide.
Despite these indicators, one group that seems to be frequently left out is English learners (ELs), defined by the state as students who speak a
language other than English at home and who are not fluent in English. However, the magnitude of the results is relatively modest, and at the middle school level, English learners are actually more likely to apply for one of the programs—VEEP—than non-EL students.
Using Choice to Improve the Academic Environment
Some proponents of school choice have argued that choice programs will increase academic achievement districtwide by increasing
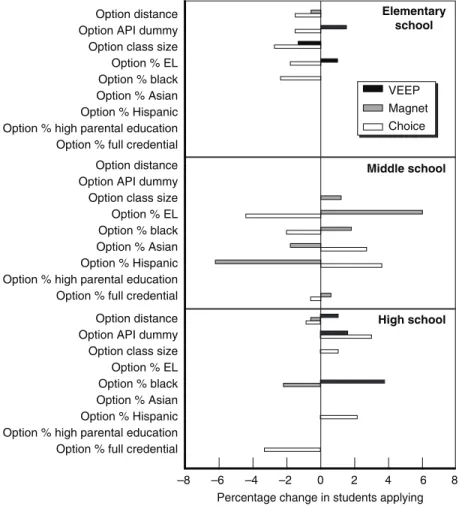
competition among schools. We cannot address this question directly with data from just one district. However, such competition is likely to arise if students are actually choosing schools based on academic criteria. Our findings suggest that academic factors, such as class sizes, test scores, student demographics, and teacher credentials, at the local school and at option schools, only moderately influence students’ decisions to apply. The strongest evidence that students consider academic criteria when applying to alternative programs is that high school students are less likely to apply to any of the school choice programs if their local school has higher test scores.
There is some evidence that the distance between the student’s neighborhood and a given option school has a deterrent effect on the probability of applying. In addition, that effect is found to be greatest for the one program that does not provide busing, the open-enrollment Choice program. However, these patterns are seen only at the
elementary and high school levels.
Effect of Choice on Integration
In Chapter 3 we examine the effects of the three choice programs on integration in SDUSD. We go considerably beyond the traditional question of racial integration to examine also the integration of students by test scores, parental education levels, and language status.
We find that overall, choice programs integrate the district in terms of race/ethnicity and parental education but segregate the district in terms of test scores and EL versus non-EL students.
Student application behavior paints the clearest picture of the demand for school choice in SDUSD. We find that students who apply to choice programs appear to use these programs to improve the
socioeconomic status of their peer group—changing that peer group by changing schools. In racial/ethnic terms, this means that applicants use choice programs to attend schools that are “more white.” Of course, we cannot say that families are specifically concerned about race, given that race and ethnicity are correlated with many different characteristics in complex ways. Applicants also use these programs to attend schools that have a higher proportion of above-median test-score performers, more students who have highly educated parents, and fewer students who are English learners. Again, all of these variables are correlated, so care must be taken not to infer, for instance, that students and their families care specifically about the share of English learners in a school’s student body.
Across all of the choice programs and all grade spans in SDUSD, the demand for choice exceeds the supply. Because the number of
applications greatly exceeds the number of slots available, the actual number of school transfers, and the amount of integration that occurs, is far less than implied by the number of applications alone.
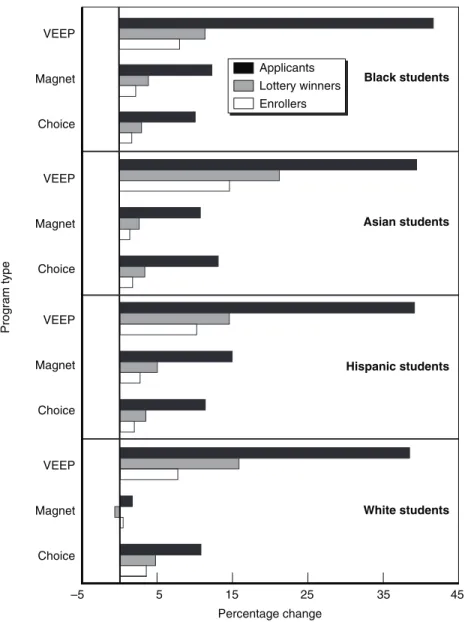
For example, if all the applications by black students to the VEEP program had been accepted, and all of these black students had then switched schools, these black students would experience a 48.2 percent increase in the number of white students in their school. However, VEEP’s supply constraint reduces the change in percentage of white students to just 10.9 percent. Some of the schools that are mainly white are also the most heavily oversubscribed, so that few applicants win admission through the lottery. Furthermore, not all those students who are accepted actually transfer. This reduces the increase of white students in the black applicants’ schools to 6.6 percent. Results are similar for other comparisons based on race/ethnicity.
We find that supply constraints cause similar reductions in
integration by parental education. Evidence on integration by test scores is somewhat mixed. However, in our analysis of integration by English-learner status, we show that supply constraints ultimately serve to reduce the segregatingeffect of attempts by non-EL students to distance themselves from EL students.
Overall, the choice programs generally increase overall integration in terms of race/ethnicity and parental education. However, in most cases
and along most dimensions, VEEP does the most to integrate and the open-enrollment Choice program does the least.
Effects of Choice on Reading and Math Achievement
For the VEEP, magnet, and open-enrollment Choice programs, which used a centralized lottery to admit students, we adopted a quasi-experimental approach in which we compared test scores in reading and math of applicants who won the lottery and applicants who lost the lottery. As detailed in Chapter 4, we examined students’ achievement one, two, and three years after the lottery was held, in spring 2001 for fall 2001 admissions. We used two state tests, the California Standards Test (CST), a criterion-referenced test that evaluates a student’s mastery of the state content standards, and a number of norm-referenced tests that compare students’ performance to performance in a nationally normed sample of students. Using regression models, we tested whether the various math and reading test scores in spring 2002, 2003, and 2004 differed significantly between those who won the lottery and those who lost.In the vast majority of cases, we found no evidence that winners and losers of a given lottery fared differently in these achievement tests one to three years after the admissions lottery was conducted. We interpret this to mean that winning a lottery neither helps nor hurts achievement growth.
There were two very important exceptions to this conclusion. First, in high schools, winners of lotteries for magnets performed significantly better on the CST math sections two and three years after the lottery took place. The gains were meaningful in size. There is a very good chance that this increased achievement can be causally attributed to magnet schools, because at the time of the lotteries in 2001, the only systematic difference between winners and losers of the magnet lotteries was the luck of the draw.
The second important exception is that in several cases, we detected statistically significant evidence that lottery winners underperformed in reading or math one year after winning the lottery but then made up this gap by the second year. This pattern, which is suggestive of a dislocation
effect that temporarily affects student learning after the student switches schools, occurred only in a handful of cases.
Figure S.2 graphs estimated effects of winning a lottery on math CST scores one to three years after the lottery and illustrates the main conclusions we have just summarized. The figure shows three separate panels for VEEP, magnet, and open-enrollment Choice lotteries. The bars in each graph show the sample size available for the regression model; the sample size can be read off the left-hand axis of each graph. In most cases, our sample numbers in the hundreds or thousands of students. The clear exception is VEEP elementary school applications. In this specific case, we need to be clear that our limited sample size makes it less likely that we could detect any but the biggest of causal effects of winning a lottery.
The “crosses” in the figure show the estimated effect of winning a lottery and the confidence interval. The first thing that becomes apparent is that the estimated effects of winning a lottery are typically quite small, ranging from –0.1 to +0.1 of a standard deviation. Such effects, especially three years into an intervention, are considered quite modest.
The standard approach in statistics is to assume that the actual effect is zero and to reject this hypothesis only if the 95 percent confidence interval does not include zero. As shown in the figure, there are only a few cases where this confidence interval does not include zero. We have already described these cases in which there is a statistically significant effect.
First, the results suggest that winning a magnet lottery at the high school level is associated with positive gains in math achievement two and three years later. As shown in the middle panel, the size of the effects is meaningful, at roughly 0.2 of a standard deviation in test scores. Also, in middle schools, winning either the VEEP or Choice lotteries is associated with slightly lower math achievement in 2001–2002, one year after the lottery. However, in later years the effect becomes
VEEP math
Choice math Magnet math
Sample size
Proportion of a standard deviation
3,500 3,000 2,500 2,000 1,500 1,000 500 0 0.8 0.6 0.4 0.2 0 –0.2 –0.4 –0.6 –0.8 0.8 0.6 0.4 0.2 0 –0.2 –0.4 –0.6 –0.8 0.8 0.6 0.4 0.2 0 –0.2 –0.4 –0.6 –0.8 Sample size
Proportion of a standard deviation
3,500 3,000 2,500 2,000 1,500 1,000 500 0 Sample size
Proportion of a standard deviation
3,500 3,000 2,500 2,000 1,500 1,000 500 0 01– 02 02– 03 03– 04 01– 02 02– 03 03– 04 01– 02 02– 03 03– 04 01– 02 02– 03 03– 04
NOTES: In the graphs, the horizontal line on each “cross” shows the estimated effect of winning a school choice lottery, measured in standard deviations; the corresponding vertical line shows the 95 percent confidence interval. The bars show the sample sizes used in the underlying regression and the scale for this is found on the left-hand side of each graph. Elementary school All grades High school Middle school
Figure S.2—Models of the Effects of Winning School Choice Lotteries on CST Math Achievement: Effect Sizes, Confidence Intervals, and Regression Sample Sizes
Charter Schools and Achievement Levels
As we describe in Chapter 5, San Diego has an unusually rich concentration of charter schools. On average, these charter schools serve student populations that are more likely than their traditional public school counterparts to be economically disadvantaged, black, or Hispanic.
Unlike VEEP and open-enrollment programs (and to a certain extent magnet schools), charter schools enroll only or mostly students who have applied, not a mix of local students and choice applicants. It is therefore important to understand what distinguishes them from regular public schools. To this end, we conducted a survey of charter school administrators in San Diego. Many charter schools draw students from the entire San Diego metropolitan area, perhaps owing to their unique curricular emphases. Teachers at charter schools are younger, less educated, and less experienced than teachers at traditional schools, and this gap is particularly pronounced at the high school level. Class sizes in charter schools are roughly the same as in traditional schools. Because teacher salaries are the primary cost of running a school, one could infer that charter schools spend less than regular public schools on the daily running of a school. Conversely, some charters have to spend
significantly more than the typical public school to pay for physical space.
Although the district does not conduct a centralized random drawing for charter schools, we are able to estimate the effect of attending a charter by looking for changes in trends in a student’s test scores during years when the student switches into or out of a charter school. This approach eliminates the need to compare students who do and do not choose charters; these two groups might differ in important but unobservable ways.
We do not find strong evidence that charter school students are uniformly over- or underperforming. Performance appears to differ by both grade span and subject. Performance also appears to depend on whether the charter school has converted from regular public school status or represents an entirely new startup charter school. Elementary startup charter schools typically underperform in their first few years of
operation but appear to catch up to traditional schools after the third year. Conversion schools—regular public schools that convert into charters, often retaining teachers and serving the same student population at the same school site, but no longer bound by district regulations governing standard schools—appear to underperform regular public schools in elementary school math and middle school reading but overperform in middle school math. Classroom characteristics, such as teacher qualifications and class size, do not explain much of the similarities or differences in achievement across the two areas.
These findings suggest that policymakers could benefit from a detailed comparative analysis of the revenue streams and costs of charter schools and traditional public schools. Charter schools appear to have less money available to spend in the classroom and so they must hire teachers with significantly less experience and education than the teachers that noncharter public schools can hire. Because it appears that the charter schools are performing at comparable levels, it is possible that charter schools in San Diego are somewhat more cost-effective than traditional public schools.
Our findings that in some cases conversion charters and startup charters perform differently raise questions about other aspects of
charters that matter for student performance. Over time, as new charters are created and existing charters fine-tune their academic approaches, we may be better able to explain variations in charter school outcomes. Additionally, it is of crucial importance to learn more about the types of students who benefit the most from attending charter schools. There is some evidence in our data that the effects of attending a charter school differ by race and ethnicity. More research is required to learn more about why these differences exist.
Conclusion and Policy Implications
Broadly speaking, this report examines two questions. First: Has school choice in San Diego served to integrate the city’s schools, both racially and socioeconomically, or has it served only to skim off affluent white students or high-scoring students into elite schools of choice, thereby increasing social stratification throughout the district? The
second question is: How have the various choice programs affected the math and reading achievement of participants?
Our results seem particularly clearcut on the first question of integration. We found a positive relationship, although weak, between the probability of applying to a choice program and a student’s test scores and parental education levels; the evidence of the relationship between a student’s GPA and probability of application was mixed. In addition, our analysis of both applications and actual school transfers makes it quite clear that the choice programs in San Diego do serve to integrate the city’s schools racially and socioeconomically. Our analysis of the student demography at charter schools makes clear that charters in San Diego do not fit the stereotype of elite schools skimming off
primarily white, affluent, and high-scoring students.
In spite of this general conclusion—that choice programs in SDUSD have integrated students along many dimensions—there are two
important qualifications here.
First, the program that clearly has done the least to integrate students is the open-enrollment Choice program. Perhaps it is not a coincidence that this program does not provide busing. One possible interpretation is that the provision of busing is an important mechanism to level the playing field in school choice. In less affluent families, parents (or a single parent) may lack access to private transportation or may lack the time to drive their children to distant schools and so could find it infeasible to send their children to a school choice program. However, a second factor may also be at play. The open-enrollment Choice program allows unfettered access by any student to any (nonmagnet) school, whereas both VEEP and magnet programs have built-in mechanisms aimed at promoting integration. It could well be that such mechanisms are needed to ensure that school choice programs lead to meaningful amounts of integration.
A second interpretation stems from our documentation that even in a district like San Diego, which has quite high participation in choice programs, space limitations sharply reduce the degree to which integration actually occurs. Application patterns show that nonwhite students, students whose parents have less education, and students with lower test scores want to move to nonlocal schools to a degree that far
surpasses what the existing choice programs can fulfill. This is a fairly remarkable finding, given that by 2003–2004, 28 percent of district students were already in various choice programs.
As for the second and larger question of student achievement, the best conclusion seems to be that in most cases, students who win lotteries to attend a school through VEEP, magnet, or Choice programs, or who switch into charters, show no statistically significant difference in reading and math achievement.
There are numerous exceptions, but two patterns stand out in a statistical sense. First, magnet high schools seem to produce higher math achievement. Second, in some grades and subjects in all the programs, students switching into the programs sometimes suffer temporary, typically one-year, declines in achievement. This is quite consonant with the recent literature on charter schools in other states.
Implications of Choice Popularity in San Diego
We are left with an important policy question. More than one-quarter of the district’s students participate in choice programs, and a large number of applicants are turned away for lack of space. Why are the four school choice programs so popular when they seem to produce no additional growth in math and reading achievement over that in students’ local schools?
Several answers come to mind, each with quite different
implications. The first and clearly most disturbing theory is that parents overestimate the academic benefits from the choice program and so base their school choice decisions on erroneous beliefs. The district’s
Enrollment Options Office annually mails a detailed school choice brochure to each family in the district describing the academic curriculum of each magnet school. But even this information cannot directly signal the elusive concept of “school quality.” Similarly, test scores are widely available, but even a sophisticated layperson could confuse a high level of test scores at a school with school quality. In reality, outside factors, such as parental background, might be
responsible in part for high test scores. A second explanation might be that improved math and reading achievement may not be the most important parental goal and that many other aspects of a school’s
environment matter to parents as well. Schools are not, after all, test-score factories that do nothing but boost academic achievement. Our evidence and that of other studies indicate that parents care deeply about the socioeconomic status of their children’s schoolmates. Parents may view this as an end in itself or as a means to a better future for their children.
Larger Implications and Questions
What are the policy implications for policymakers, both locally and nationally? The first is that school choice programs can indeed promote integration. Two policy levers appear to have increased the level of integration created by choice. The first is busing, so that students from less affluent families can get to their chosen school. Another is a system of pairing schools or the setting of quotas at each receiving school for students from various geographic areas.
What are the larger implications of the nondefinitive test-score results? It would be extremely premature to argue that they suggest that the school choice programs should be either curtailed or expanded. To some readers, the very fact that the programs are so popular with parents may be sufficient justification to continue them. To others, the lack of a consistently positive effect of choice on reading and math achievement may be quite troubling. But potentially mitigating factors abound here. Do the reading and math tests capture true achievement well? What about achievement in other domains? What about nonacademic
outcomes? Charter schools may actually receive less funding than regular public schools and so they may prove more cost-effective even though they seem to produce about the same achievement gains as regular public schools. For open-enrollment Choice, which does not provide
subsidized busing, the costs of transportation are borne by the family, so if the family wants to enroll a child, what is the public cost, if any? For the two programs with subsidized busing (VEEP and magnets), cost does become more of a concern. The positive results in math for magnet high schools insulate magnets somewhat. For VEEP, the issue of cost-effectiveness is perhaps most relevant.
Our findings are likely to prove useful to other districts as they think about their own choice programs, but there is a larger national
implication as well. The NCLB legislation requires that districts devote some of their Title I funds to provide busing for students in schools that have failed to meet “adequate yearly progress” standards two years in a row. This requirement would allow those students to attend “nonfailing” schools. SDUSD has implemented this requirement by combining NCLB busing with its preexisting VEEP busing routes.
It seems likely that the outcomes for these NCLB-busing
participants will resemble what we have found for VEEP participants in San Diego. The key national policy question then becomes this: If NCLB is concerned about boosting academic achievement in math, reading, and related core subjects, will busing provide the most cost-effective way to help students in low-performing schools? This debate could well become one of the central education policy issues nationwide by the time NCLB is up for reauthorization in 2007.
Contents
Foreword... iii Summary... v Figures ... xxv Tables...xxvii Acknowledgments...xxxiii 1. SCHOOL CHOICE IN SAN DIEGO ANDNATIONWIDE: AN INTRODUCTION AND
OVERVIEW... 1
Current School Choice Options... 2
The Current Policy Debate over School Choice... 3 Research on School Choice Effects... 4
Charter School Research... 6
Contributions of the Present Report... 6 San Diego’s Choice Programs in Detail... 8
Open Enrollment ... 8
VEEP... 9
Magnet Schools... 9
Charter Schools... 10
Other Programs ... 10
Similarities and Contrasts... 10 Admission to San Diego’s School Choice Programs ... 11
Outline of the Report... 12
2. WHO CHOOSES TO APPLY TO PUBLIC SCHOOL
CHOICE PROGRAMS AND WHY? ... 15
Which Students Apply to School Choice Programs?... 16 What Are Students Looking for in a School?... 23
Proximity and Distance... 23
Academic Performance Index... 24
Other School Characteristics... 25
3. SCHOOL CHOICE AND INTEGRATION... 29 Integration by Race and Ethnicity ... 31 Integration by Student Achievement... 36 Integration by Parental Education ... 38 Integration by Language Status ... 39 Changes in Districtwide Exposure ... 42
Conclusion ... 45
4. DOES SCHOOL CHOICE BOOST THE
ACHIEVEMENT OF THOSE WHO WIN LOTTERIES?.. 49
Results... 55
Conclusion ... 64
5. A PORTRAIT OF CHARTER SCHOOLS AND THEIR
EFFECT ON STUDENT ACHIEVEMENT... 67
Background... 68
A Comparison of Students, Teachers, and Class Sizes... 71 Survey-Based Evidence on San Diego’s Charter Schools ... 77
Students Served... 78
School Focus, Curriculum, and Operating Policies... 81 Facilities and Financing... 82
Teachers... 83
Parental Involvement... 83
The Effect of Attending a Charter School on Gains in
Student Achievement... 85
Gains Measured by the California Standards Test... 93
Conclusion ... 95
6. POLICY IMPLICATIONS AND NEW QUESTIONS... 99
Appendix
A. Data, Methods, and Results for Chapter 2... 107 B. Detailed Results on Integration ... 123 C. Methodology and Detailed Results on the Effect of Choice
Programs on Outcomes... 145
References... 177
About the Authors ... 183
Related PPIC Publications... 185 Web-Only Appendix
This web-only appendix is available at http://www.ppic.org/content/ other/806JBR_web_only_appendix.pdf
E. Methodology and Detailed Results for the Effect of Choice Programs on Student Academic Outcomes
Figures
S.1. Proportion of SDUSD Enrollment in Regular Schools and in Various School Choice Programs, 2001–2002
and 2003–2004 School Years. ... viii S.2. Models of the Effects of Winning School Choice
Lotteries on CST Math Achievement: Effect Sizes,
Confidence Intervals, and Regression Sample Sizes... xiv 1.1. Proportion of SDUSD Enrollment in Regular Schools
and in Various School Choice Programs, 2001–2002
and 2003–2004 School Years. ... 12 2.1. Change in the Probability of Application Associated with
Selected Student Characteristics... 17 2.2. Change in the Probability of Application Associated with
Local School Characteristics... 18 2.3. Change in the Probability of Application Associated with
Option School Characteristics ... 19 3.1. Average Differences in the Percentage of White Students
at Option and Local Schools of Program Participants, by
Race and Program Type ... 32
3.2. Average Differences in the Percentage of Above-Median Test-Score Performers at Option and Local Schools of Program Participants, by Students’ Own Level of
Achievement and Program Type... 37 3.3. Average Differences in the Percentage of Students from
High Parental Education Families at Option and Local Schools of Program Participants, by Students’ Own Parental Education Designation and Program
Type... 40 3.4. Average Differences in the Percentage of Non-English
Learners at Option and Local Schools of Program Participants, by Students’ Own English-Learner Status
3.5. Changes in Actual Exposure Generated by the Choice
Programs... 43
4.1. Models of the Effects of Winning School Choice Lotteries on CST Reading Achievement: Effect Sizes,
Confidence Intervals, and Regression Sample Sizes... 56 4.2. Models of the Effects of Winning School Choice
Lotteries on CST Math Achievement: Effect Sizes,
Confidence Intervals, and Regression Sample Sizes... 57 5.1. Charter School Enrollment Growth in San Diego
Unified School District Schools... 68 5.2. Effect of Attending a Charter School on Stanford 9
Test-Score Gains... 87
5.3. Effect of Attending a Startup or Conversion Charter
Tables
2.1. Average Annual Application Rates ... 16 3.1. Average Percentage Differences in the Racial/Ethnic
Makeup at Option and Local Schools, by Race and
Program Type ... 33
4.1. Estimated Effect of Winning a VEEP, Magnet, or Choice Lottery on Various Measures of Reading Achievement, by Grade Span, Spring 2002 Through
Spring 2004... 54
4.2. Estimated Effect of Winning a VEEP, Magnet, or Choice Lottery on Various Measures of Math Achievement, by Grade Span, Spring 2002 Through
Spring 2004... 61
5.1. Enrollment by Race and Meal Assistance Eligibility, San
Diego Unified School District Schools, 2002–2003... 72 5.2. Academic Performance Index Averages, 1999–2004... 73 5.3. Teacher Characteristics, 1997–1998 to 2003–2004 ... 74 5.4. Class Sizes, 1997–1998 to 2003–2004 ... 76 5.5. Summary Statistics of Responses to Charter School
Survey, June 2004... 79
5.6. Estimated Effect of Attending a New Startup Charter School Measured in Proportion of Stanford 9 Test-Score Standard Deviation Units ... 91 A.1. Probits for Applications to the School Choice Programs:
Elementary School Sample... 112 A.2. Probits for Applications to the School Choice Programs:
Middle School Sample ... 116
A.3. Probits for Applications to the School Choice Programs:
High School Sample... 119
B.1. Average Percentage Differences in the Racial/Ethnic Makeup at Option and Local Schools of Applicants for All Applications, by Applicant’s Race, Grade Span, and
B.2. Average Percentage Differences in the Racial/Ethnic Makeup at Option and Local Schools of Applicants, Adjusted for Lottery Results, by Applicant’s Race, Grade Span, and Program Type... 126 B.3. Average Percentage Differences in the Racial/Ethnic
Makeup at Option and Local Schools of Applicants, Adjusted for Actual Enrollment, by Applicant’s Race,
Grade Span, and Program Type... 127 B.4. Average Percentage Differences in School-Level Student
Achievement at Option and Local Schools, by
Applicant’s Achievement and Program Type... 128 B.5. Average Percentage Differences in School-Level Student
Achievement at Option and Local Schools of Applicants for All Applications, by Applicant’s Achievement Level,
Grade Span, and Program Type... 129 B.6. Average Percentage Differences in School-Level Student
Achievement at Option and Local Schools of Applicants, Adjusted for Lottery Results, by Applicant’s
Achievement Level, Grade Span, and Program Type... 130 B.7. Average Percentage Differences in School-Level Student
Achievement at Option and Local Schools of Applicants, Adjusted for Actual Enrollment, by Applicant’s
Achievement Level, Grade Span, and Program Type... 131 B.8. Average Percentage Differences in Parental Education
Levels at Option and Local Schools of Applicants, by
Applicant’s Parental Education Level and Program Type.. 132 B.9. Average Percentage Differences in Parental Education
Levels at Option and Local Schools of Applicants for All Applications, by Applicant’s Parental Education Level,
Grade Span, and Program Type... 133 B.10. Average Percentage Differences in Parental Education
Levels at Option and Local Schools of Applicants, Adjusted for Lottery Results, by Applicant’s Parental
Education Level, Grade Span, and Program Type... 134 B.11. Average Percentage Differences in Parental Education
Levels at Option and Local Schools of Applicants, Adjusted for Actual Enrollment, by Applicant’s Parental
B.12. Average Percentage Differences in the Proportion of English Learners at Option and Local Schools of Applicants, by Applicant’s English-Learner Status and
Program Type ... 136
B.13. Average Percentage Differences in the Proportion of English Learners at Option and Local Schools of Applicants for All Applications, by Applicant’s
English-Learner Status, Grade Span, and Program Type... 137 B.14. Average Percentage Differences in the Proportion of
English Learners at Option and Local Schools of Applicants, Adjusted for Lottery Results, by Applicant’s
English-Learner Status, Grade Span, and Program Type.. 138 B.15. Average Percentage Differences in the Proportion of
English Learners at Option and Local Schools of Applicants, Adjusted for Actual Enrollment, by Applicant’s English-Learner Status, Grade Span, and
Program Type ... 139
B.16. Districtwide Exposure Indices, by Race... 140 B.17. Districtwide Exposure Indices, by Student Achievement,
Based on the Average of Math and Reading
Performance... 142
B.18. Districtwide Exposure Indices, by Parental Education
Levels ... 143
B.19. Districtwide Exposure Indices, by English-Learner
Status ... 144
C.1. Priority Groups and Number of Applications for
Admission from Each Group, Fall 2001 ... 147 C.2. Lottery Counts for Unique Lotteries... 148 C.3. Tests for Identical Prelottery Test Scores Between
Lottery Winners and Losers, for Each Regression Sample
and Year ... 150
C.4. Estimated Effects of Winning a VEEP Lottery on Reading Scores on Various Measures of Reading Achievement, and for Various Specifications, Spring
2002 Through Spring 2004... 156 C.5. Estimated Effects of Winning a VEEP Lottery on Math
Grade Span and for Various Specifications, Spring 2002
Through Spring 2004... 158
C.6. Estimated Effects of Winning a Magnet Lottery on Reading Scores on Various Measures of Reading Achievement, by Grade Span and for Various
Specifications, Spring 2002 Through Spring 2004... 159 C.7. Estimated Effects of Winning a Magnet Lottery on Math
Scores on Various Measures of Math Achievement, by Grade Span and for Various Specifications, Spring 2002
Through Spring 2004... 161
C.8. Estimated Effects of Winning a Choice Lottery on Reading Scores on Various Measures of Reading Achievement, by Grade Span and for Various
Specifications, Spring 2002 Through Spring 2004... 162 C.9. Estimated Effects of Winning a Choice Lottery on Math
Scores on Various Measures of Math Achievement, by Grade Span and for Various Specifications, Spring 2002
Through Spring 2004... 164
D.1. Correlation Table of Survey Responses... 166 D.2. Stanford 9 Test-Score Gain Regression Coefficients on
Charter School Indicator... 168 D.3. Stanford 9 Test-Score Gain Regression Coefficients on
Charter School Type Indicators... 169 D.4. Stanford 9 Test-Score Gain Regression Coefficients, Year
in Operation ... 170
D.5. Stanford 9 Test-Score Gain Regression Coefficients,
Student Switching Behavior... 172 D.6. Estimated One-Year Effects of Switching to a Charter
School, Measured in Proportion of Stanford 9
Test-Score Standard Deviation Units, by Race ... 174 D.7. Estimated Effects of Attending a Charter School on
California Standards Test Score: Score Normalized to
Mean 0, Standard Deviation 1, in Each Grade Span... 175 D.8. Estimated Effects of Attending a Startup or Conversion
Charter School on California Standards Test Score: Score Normalized to Mean 0, Standard Deviation 1, in
Web-Only Appendix Tables
E.1. Summary Statistics for VEEP CST Reading Based on Specification 4
E.2. Summary Statistics for VEEP CST Math Based on Specification 4
E.3. Summary Statistics for Magnet CST Reading Based on Specification 4
E.4. Summary Statistics for Magnet CST Math Based on Specification 4
E.5. Summary Statistics for Choice CST Reading Based on Specification 4
E.6. Summary Statistics for Choice CST Math Based on Specification 4
E.7. Regression Results for VEEP, All Grade Spans Combined, for Various Measures of Reading Achievement
E.8. Regression Results for VEEP, All Grade Spans Combined, for Various Measures of Math Achievement
E.9. Regression Results for Magnet, All Grade Spans Combined, for Various Measures of Reading Achievement
E.10. Regression Results for Magnet, All Grade Spans Combined, for Various Measures of Math Achievement
E.11. Regression Results for Choice, All Grade Spans Combined, for Various Measures of Reading Achievement
E.12. Regression Results for Choice, All Grade Spans Combined, for Various Measures of Math Achievement
E.13. Regression Results for VEEP, Elementary School Students, for Various Measures of Reading Achievement
E.14. Regression Results for VEEP, Elementary School Students, for Various Measures of Math Achievement
E.15. Regression Results for Magnet, Elementary School Students, for Various Measures of Reading Achievement E.16. Regression Results for Magnet, Elementary School
Students, for Various Measures of Math Achievement E.17. Regression Results for Open-Enrollment Choice,
Elementary School Students, for Various Measures of Reading Achievement
E.18. Regression Results for Open-Enrollment Choice,
Elementary School Students, for Various Measures of Math Achievement
E.19. Regression Results for VEEP, Middle School Students, for Various Measures of Reading Achievement
E.20. Regression Results for VEEP, Middle School Students, for Various Measures of Math Achievement
E.21. Regression Results for Magnet, Middle School Students, for Various Measures of Reading Achievement
E.22. Regression Results for Magnet, Middle School Students, for Various Measures of Math Achievement
E.23. Regression Results for Open-Enrollment Choice, Middle School Students, for Various Measures of Reading Achievement
E.24. Regression Results for Open-Enrollment Choice, Middle School Students, for Various Measures of Math
Achievement
E.25. Regression Results for VEEP, High School Students, for Various Measures of Reading Achievement
E.26. Regression Results for VEEP, High School Students, for Various Measures of Math Achievement
E.27. Regression Results for Magnet, High School Students, for Various Measures of Reading Achievement
E.28. Regression Results for Magnet, High School Students, for Various Measures of Math Achievement
E.29. Regression Results for Open-Enrollment Choice, High School Students, for Various Measures of Reading Achievement
E.30. Regression Results for Open-Enrollment Choice, High School Students, for Various Measures of Math Achievement
Acknowledgments
Given the many facets of school choice within the San Diego Unified School District, we relied on a number of individuals for their insight, experience, and advice. We would like to thank former
Superintendent Alan Bersin, now California’s Secretary of Education, for granting us access to the data and staff. Karen Bachofer, Executive Director of Standards, Assessment, and Accountability, provided much useful assistance and feedback on our research throughout the entire project. We would also like to thank Sandra Robles and Patricia Trandal, current and former staff members, respectively, at the
Enrollment Options Office for taking considerable time to explain how the lottery system works and allowing us to work with the data. Without their support, this project would have been much more difficult. We thank Brian Bennett, formerly at the Office of School Choice, for his insights on charter schools. We also thank Peter Bell and Jeff Jones from the Research and Reporting Department for their assistance with the student data and test scores, Susie Millett for helpful discussions on school choice, and Charles Rynerson, formerly from the Instructional Facilities Planning Department, for information and expertise on school feeder patterns. Thanks also to Brad Lewis for assistance with calculating distances between schools.
A number of people provided invaluable advice relating to the design of our survey of charter schools. Brian Bennett, formerly of SDUSD, as well as Julie Umansky and Collin Miller of the California Charter Schools Association reviewed an early draft of the survey, and the final version of the survey was reviewed and approved by Brian Bennett’s advisory group of principals/directors. We are grateful to the many charter school administrators and leaders who took the time to fill out the survey.
This report has received generous funding from the Smith Richardson Foundation, Inc., the Girard Foundation, and the Public
Policy Institute of California (PPIC). Mark Steinmeyer and Phoebe Cottingham (current and former senior program officers at the Smith Richardson Foundation); Susan Wolking, Executive Director of the Girard Foundation; and Max Neiman and Paul G. Lewis (current and former program directors for the Governance and Education Programs at PPIC) have provided many helpful ideas.
We thank Richard Greene and Patricia Bedrosian for expert editorial assistance. Administrative support was provided by numerous staff members at PPIC.
The database used in this project builds on a large database that a PPIC team led by Julian Betts has been working on since 2000. We warmly acknowledge funders of our previous projects whose funding created the infrastructure that made the current project feasible: PPIC, The William and Flora Hewlett Foundation, and The Atlantic
Philanthropies. In addition, at the University of California, San Diego, Dean Paul Drake of the Division of Social Sciences kindly provided space for the overall SDUSD project since its inception in 2000. Without all of this support, this report would not have been possible.
We are indebted to our reviewers: Jaime Calleja Alderete, Ken Hall, Paul Hill, Christopher Jepsen, and Mark Schneider. Valuable comments on an earlier version of Chapter 2 were also provided by Steven Erie, Christopher Jepsen, Steven Raphael, James Rauch, Jon Sonstelie, and Christopher Woodruff.
Any opinions or interpretations expressed in this report are those of the authors alone and do not necessarily reflect the views of the Public Policy Institute of California.
1. School Choice in San Diego
and Nationwide: An
Introduction and Overview
School choice is a policy issue with a long history. Court-ordered busing designed to reduce racial segregation became commonthroughout the nation in the 1970s as a way to equalize school quality between whites and blacks. Lukas (1985) gives a riveting account of the political tensions that busing created in Boston, culminating in riots in 1974. Nationwide, dozens of court-ordered mandatory busing programs similar to the one in Boston have gradually evolved into nonmandatory systems of interschool choice and related magnet school programs. These descendants of court-ordered busing have continued to this day as voluntary ways to give parents some choice among public schools for their children. Recently, charter schools, and in a few locations vouchers, have provided additional types of school choice.
All these forms of school choice have attracted controversy. There should be little wonder why school choice continues to attract so much attention. In the United States, schools vary radically in quality, and without some form of choice, public school students are limited to schools in their own neighborhoods. A lack of choice hurts students who live in areas with low-performing schools. More often than not, the affected students are economically disadvantaged, Hispanic, black, or Indochinese, and, especially in California, English learners.
The controversy over school choice has gained new momentum with the passage in 2001 of the federal No Child Left Behind (NCLB) law. NCLB focuses interventions on schools receiving federal Title I funding that fail for two consecutive years to make adequate yearly progress, meaning that an insufficient number of students or subgroups of
These schools must allow low-performing students to choose to attend another school in the district, with the district providing busing. NCLB also mandates another option for failing schools—to convert into a charter school, thus representing a second school choice mechanism embedded in the federal law.
Probably the most controversial and perhaps best known type of school choice is a voucher system, which allows parents to use public money to send their children to private schools often affiliated with established religions. In spite of the 2002 U.S. Supreme Court Zelman v. Simmons-Harris decision allowing public money to be spent on vouchers for private school tuition, it seems clear that the voucher form of school choice will not prevail in the next few years: Many states have constitutional prohibitions on such plans that are stronger than the provisions in the U.S. Constitution. It could take years to resolve these issues at the state level. Moreover, voters do not seem ready to support private school vouchers. In 2000, for instance, voters in California decisively rejected Proposition 38, a private school voucher ballot initiative. The measure received only 29 percent support.
Current School Choice Options
Several other forms of school choice, although not the subject of virulent debates in the op-ed pages, have already quietly been providing large numbers of students with alternatives to their local neighborhood schools. Many states, including California, have implemented an open-enrollment policy that allows students to apply to any school they choose within a school district. Busing exists in many urban districts, typically originating in court desegregation orders. Additionally, many districts have created magnet schools to attract diverse groups of students to a given campus. Finally, charter schools represent a relatively new but quickly growing type of public school choice.
We know surprisingly little about these widespread forms of school choice. Among the unanswered questions are: Who chooses open enrollment, magnets, charters, and more traditional busing programs? How does choice change the extent of student integration in terms of race/ethnicity, socioeconomic status, and language? Do students who transfer under these programs gain academically? If so, why? Which
types of students gain the most from these choice programs? Are the programs truly reducing the achievement gap between affluent and less affluent students? How could administrators improve the programs’ effectiveness? Research on these issues has been lacking.
To understand why these questions are so important, it is useful to survey the national controversy surrounding school choice.
The Current Policy Debate over School Choice
Advocates of the various forms of school choice view them as a way to improve schools in general and to reduce the disparities between students in affluent and less affluent areas. Underlying this is a concern for relatively disadvantaged students who, it is argued, often attend local schools that are of poor quality. If students’ destinies are largelydetermined by the quality of their local schools, then why not give motivated students whose local schools are failing a chance to attend a better school elsewhere? Disadvantaged students stand to gain considerably from this expanded choice, proponents argue. A second argument is that decentralized school control will ensue from a system of choice, which in turn should generate a greater variety of curricula and pedagogical methods to cater to the heterogeneous needs of students. A key advantage of decentralization is that it improves the flow of
information between families and school providers; it is difficult for a central district administration to react quickly to the needs of students and families without a massive investment in surveys or parent
interviews. A third argument is that active competition among schools for students might improve the quality of all schools by creating a market environment that forces substandard schools to improve or lose students.
Most objections to school choice generally have centered on its more radical forms, such as the use of publicly funded vouchers that would allow students to attend private schools; some extreme school choice schemes envision the complete privatization of schools. Critics worry that these forms of choice would simply replicate the existing
inequalities, with well-to-do families sending their students to the most exclusive private schools by topping up their public voucher money out of their own pockets. Other concerns are that the public school system represents the only existing example of the cultural “melting pot,” and
that a system of complete private choice would lead to greater segregation than currently exists along a variety of lines—economic, racial/ethnic, cultural, and religious. Another criticism of a partially privatized system is that publicly funded vouchers could drain resources away from public schools, hurting educational quality for those left behind.
A quite separate line of criticism of school choice maintains that the real solution to the problem of low and unequal academic achievement in our schools is simply to spend more. Choice, in this view, is a red herring. But empirical evidence is not compelling; it does not show that dollars alone can do much to improve student achievement on average or that money alone can narrow the achievement gap between affluent and less affluent students.1 Betts and Danenberg (2001) present calculations
suggesting that even large injections of money would not equalize achievement across California’s schools. The main obstacle is the large gaps in achievement related to students’ socioeconomic status (Betts, Rueben, and Danenberg, 2000; Coley, 2002). In the end, even large infusions of cash into the public school system are unlikely by themselves to eliminate these achievement gaps across all schools. The clear
implication is that other reforms, including school choice, must remain on the table as long as there is a case to be made that they could boost average achievement or reduce disparities in achievement.
Research on School Choice Effects
Although public school choice exists and is much more prevalent than commonly realized, we know very little about its effects.
Roughly speaking, there have been two waves of research on the effects of school choice. One arose from traditional busing programs intended to reduce racial segregation that have existed for three decades
_____________
1For reviews of the effect of school resources, such as spending per pupil on student
achievement and on students’ ultimate years of schooling and earnings after leaving school, see Hanushek (1996) and Betts (1996), respectively. In the California context, see Betts, Rueben, and Danenberg (2000), Jepsen and Rivkin (2002), and Betts, Zau, and Rice (2003). Betts, Zau, and King (2005) study a massive literacy intervention in San Diego and find that in many cases it did narrow gaps in achievement among students, but even the large expenditures accompanying this program could not come close to eliminating disparities in achievement among students.
or more in many states. Many studies, most done in the 1970s and early 1980s, examined the effectiveness of these programs. But we argue that almost none of these studies has anything convincing to say about whether busing improves outcomes for bused students or has effects on the populations in the sending and receiving schools.
Several good reviews of this literature (e.g., Crain and Mahard, 1981; Cook et al., 1984) show that the vast majority of studies are observational, lacking a valid comparison or “control” group. For instance, many of the earlier studies compare students who were bused with those who remained behind. But if those who volunteered for busing differed in unobservable ways from those who did not volunteer, we cannot reliably disentangle the effects of busing from the effects of these unobserved differences.
A convincing and fully legitimate measure of the causal effect of busing requires a valid comparison group, preferably accomplished through some sort of randomization. For example, if there were a lottery for busing, with some students who apply being randomly chosen for the busing program, then those students who “lost” the lottery would provide a valid comparison group. On average, they would have the same observed and unobserved characteristics (including motivation and learning aptitude) as the students from the same applicant pool who are randomly chosen to be bused. This randomization removes the “apples and oranges” problem inherent in the bulk of the busing literature.
Crain and Mahard (1981) find only two cases nationally in which busing was performed using randomization (Mahan and Mahan, 1970; and Zdep, 1971). Although their results showed some minor gains in achievement, it seems obvious that a handful of experiments involving a few hundred students in the 1960s does not provide a good guide for policy decisions that need to be made about today’s quite distinct choice programs in California or elsewhere in the United States. Moreover, the racial/ethnic and language mix that exists in the state and country today stands in stark contrast to that of the 1960s. The goals of school choice and busing have also changed markedly.
A second and more recent literature on school choice has tended to use more convincing methodologies, although the same lack of
For example, early research reports on the Milwaukee private school voucher program drew radically varying conclusions. Over time, it has become clear to outside researchers that the source of the disagreement stems from variations in the comparison group chosen by each set of researchers.
Some of the most recent work on vouchers has used randomization (see for instance Howell and Peterson, 2002; Mayer et al., 2002). This work has been challenged on a number of technical grounds, such as a lack of robustness to alternative definitions of race and choice of samples (Krueger and Zhu, 2003).
One notable recent paper examines public school choice using quasi-experimental methods. Cullen, Jacob, and Levitt (2003) study an open-enrollment program at the high school level in Chicago public schools. They take advantage of the lotteries used to draw from the applicant pool, in this way solving the apples and oranges problem. They find little evidence that this program improved student achievement.
Charter School Research
Similarly, early work on charter schools, although extremely useful, has not fully dealt with the selective nature by which students apply to charter schools (and in many instances the selective nature by which charter schools admit students). The best of this work has avoided comparing students at charters and regular public schools and has instead followed individual students as they switch between regular public schools and charters, or vice versa. This method tests whether the test-score trajectory of individual students alters after these switches. But this literature is still quite small.
Gill et al. (2001) give a sobering account of the limits of our knowledge about vouchers for either private schools or charter schools.
Contributions of the Present Report
The present report uses data from the San Diego Unified School District (SDUSD) to study three related issues: the decision to leave the local school, the effects on integration, and the effects on achievement for those who switch schools.
The report fills several gaps in knowledge about school choice. It documents exactly who opts for school choice and the types of schools that are chosen. Second, it makes use of an unusual random drawing procedure that SDUSD uses to determine which applicants are accepted to its open enrollment, busing, and magnet programs. This
randomization solves the apples and oranges problem inherent in most of the earlier literature by providing a valid comparison group against which to compare those who are randomly chosen to participate in the
programs. Further, because we use a rich longitudinal dataset, we are able in theory to open up the black box of school choice to determine which aspects of switching schools, such as changes in curriculum, teacher qualifications, class size, or peer groups, contribute most strongly to increasing the academic achievement of school choice participants. Third, on the question of integration, we extend the analysis beyond the traditional focus on race and ethnicity by also studying integration based on language, socioeconomic status, and test scores. We also examine how the limited supply of spaces in the various choice programs reduces the amount of integration that occurs relative to the demand expressed in applications by students, many of whom do not win in the lotteries. This is an important issue to study because proponents and opponents often debate what more widespread forms of school choice, such as universally provided busing, might do to attempt to integrate public schools.
We also study the effect of charter schools on achievement. However, because the district does not conduct a centralized lottery for admission to charter schools, we cannot use the quasi-experimental approach described above. We use what many consider a next-best method—a fixed-effect approach that makes each student his or her own comparison group. This is accomplished by comparing test-score growth in years the student is in a charter school to years that he or she is in a regular public school.
One advantage of the present study is that SDUSD is a very large and diverse district with a large number of students entering choice programs each year. Our available sample size is quite large compared to the more highly publicized voucher programs. For example, the