An Evaluation of Logistics Determinants, Business Relationships and
Firms Characteristics of the Greek Small and Medium Enterprises
Vassilis Orfanos
Senior Manager, Greek Telecommunications Organization 21 Vourleza str., 19003, Porto-Rafti, Markopoulo Attikis, Greece
E-mail: [email protected]
John Mylonakis
10 Nikiforou str., Glyfada, 166 75, Athens, Greece E-mail: [email protected]
Michalis Evripiotis
Senior Manager, Greek Telecommunications Organization 4 Aghisilaou str., 166 75, Glyfada, Athens, Greece
E-mail: [email protected] Abstract
The present study assesses the relationship between Small & Medium-sized Enterprises (SMEs) operating in various economic sectors and the entire function of logistics. It focuses on three primary factors that are essentially associated with SMEs and affect their logistics operations, namely their own perception on the way these operate, SME behaviour towards their clients and the behavior of suppliers to small and medium-sized enterprises. The research was carried out with the use of 620 questionnaire sent to specialists and employees working in executive positions in three SME categories. The research results revealed the relationships and inter-dependence among the various factors for SMEs operating in all economic sectors. SMEs operating in certain sector appear to pay more attention to specific factors and less to others. SME performance is directly associated with and affected not only by the procurement system, but also by logistics, and particularly by the general attitude and behaviour adopted by enterprises towards their customers and suppliers.
Keywords: Logistics, Supplier evaluation, Quality of goods & Services, Customer satisfaction, Transportation, Operation strategy, Leadership
1. Introduction
Interest in logistics has risen since 1980, when enterprises started to recognise its advantages and the cooperative relationships that exist within and beyond its scope. Logistics are closely associated with maximising the results of Small & Medium-sized Enterprises, which seek to achieve better logistics support and management in an integrated and joint manner, in order to increase overall customer satisfaction (by reducing delivery times through improved planning in expected demand and by minimising errors during order execution). Enterprises further seek to limit total costs, by reducing stocks and through better control over procurement and production processes.
Essentially, logistics operate as a means to improve the end result of enterprises, operating within a demanding and highly competitive environment, by establishing a competitive advantage. Through a proper logistics management, SMEs manage to become more competitive against other companies.
2. Past Literature
The process of selecting suppliers began around 1960, when the term “vendor selection” was still used (currently replaced by the tern “supplier selection”) and was considered as an issue entailing several different objectives and characteristics (Degraeve, et al., 1998; Degraeve et al., 2000; Masella et al., 2000). It requires the intervention of several business services, such as production, transport, storage, purchasing and logistics, as the activities performed as part of logistics have now extended beyond the scope of transport and storage to several other production sectors. An important element in selection is the time of supply operations, i.e. it is important that suppliers deliver to businesses on time and several pieces in order to avoid shortcomings. Supplier
evaluation is a term used in businesses to refer to the assessment and approval of prospective suppliers through an actual and measurable evaluation process (Braglia et al., 2000; Weber et al., 1991; Weber et al., 1992; Weber et al., 1996; Ghodsypour and O’ Brien, 1998).
It is commonly believed that supplier evaluation is very important and must be implemented in the most efficient way. It is also applied for measuring and controlling the performance of existing suppliers in relation to cost cuts, continuous improvement and risk minimisation (Gordon and Ross, 2008, Baily, 2005). Vonderembse and Tracey, (1999) studied the effect of supplier selection in companies and have shown that regular selection has a positive impact in business performance. They also showed that high-performance businesses pay a great deal of attention to such methods. Krause set forth certain elements that are expected from innovative suppliers, such as the ability to design new products or change existing ones, technical characteristics, quality certificates, the ability to find immediate solutions, technological level, ability and willingness to cooperate and develop production and to improve (Krause et al., 2001).
Successful studies on the development of new products have shown that readiness helps staff selection when it comes to buyer-vendor relationships that exist in a good geographical location. This means that in fact it constitutes a success factor in the incorporation of suppliers within an enterprise (McGinnis and Vallopra, 1999; Ragatz et al., 1997; Murphy and Heberling, 1996) and in establishing a mutual relationship (Håkansson, 1989; Anderson et al., 1988; Anderson et al. 1989; Kralji, 1983).
A very well known study is that of Dickson, (1966), which includes a questionnaire of 23 qualitative criteria, covering the majority of criteria used until today. Later, in a study by Weber et al. (1991), several authors classified all the articles until 1966 based on the criteria used. In this effort, they realised that price, delivery, quality, production ability and location are very often used; however, more criteria should be added in order to conduct a more thorough and better evaluation. Thus, in another study, Weber et al. (1991) added certain criteria, such as price, time for procedure implementation, location, supplier certifications, facilities, continuous improvement, physical distribution, built-in relationships, as well as qualitative criteria. Later on, the following criteria were incorporated: reputation, financial stability, supplier’s work volume, the ability to cover demand and respond to company and client needs, proper invoicing, on-time delivery and on-time production, the ability to respond to unexpected changes, continuous improvement of goods and services, as well, as the technical, mechanical, economic, productive and managerial ability to assess new prospective suppliers. Therefore, more recent methods study more criteria (subjective-objective), being both simple and complex. Most criteria are subjective (non quantifiable), i.e. they are qualitative criteria; however, the objective criteria (quantifiable), i.e. the quantitative criteria are of high importance. Of course, these are usually contradictive and, as such, they are difficult to distinguish and measure. As a result, the supplier who can better keep up with these criteria is finally selected.
3. Research Methodology
The purpose of this study is to examine: the attitude adopted by modern SMEs, their behaviour towards customers, and the behaviour of suppliers towards them.
The study initially examines the attitude of SMEs which forms the basis for their operation. It also examines the attitude of SMEs towards customers and suppliers, namely how they behave towards these two categories, which are important for their growth. The study was conducted with the use of a questionnaire which was sent to Small and Medium-sized Greek companies. The finding and selection of eligible enterprises was based on information collected from the Piraeus Chamber of Commerce and Industry, the Athens Stock Exchange and the Internet by performing searches by specific sector and company size. The questionnaire was sent to a total of 620 specialists and employees working in executive positions, in three SME categories. 235 valid and statistically significant questionnaires were returned for response analysis.
Out of these 235 questionnaires, 206 contained complete responses (free of omissions, double or misleading responses), which we included in our research. To summarise: we received a total of 206 responses (from the three categories and sectors). The number of responses/questionnaires per individual sector is as follows: 28/80 from the primary sector, 22/80 from manufacturing (small industries), 20/80 from constructions, 17/70 from tourism, 8/50 from logistics, 10/50 from telecommunications, 13/60 from financial activities (IT, real estate, etc.), and 11/50 from the public sector (public administration-defense, education, entertainment, etc.).
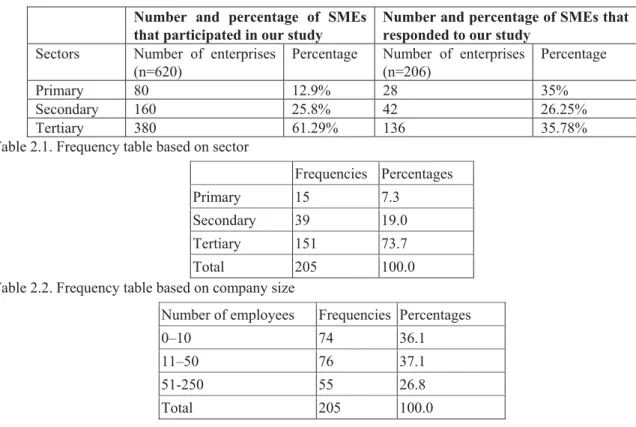
Table 1 shows the number and percentage of enterprises in the above three sectors that were included in our study, out of a total of 620 SMEs, as well as the number and percentage of enterprises that had a positive response to our research attempt. The analysis of statistical data was carried out using the Statistical Package for Social Sciences, version 15.0.
4. Research Results 4.1 Frequency Tables
The frequency tables (2.1, 2.2 and 2.3) present the qualitative characteristics of the questionnaire and the study per sector, company size and SME operation.
4.2 Reliability Analysis
An alpha reliability analysis was applied for the three elements under examination (SME attitude, behaviour towards customers and behaviour towards suppliers), which aims at evaluating the internal consistency of questionnaire data, i.e. whether data (total of variables) have the tendency to extensively measure the same thing or not (Hair et al. 1995; Kline, 1993; Nunnaly, 1978; Cortina, 1993; Grayson, 2004; Field, 2009).
With regard to the attitude of SMEs for both the secondary and tertiary sector, alpha reliability of the 20 factors equals 0.847, a fact that proves that the scale is reliable. With regard to a company’s behaviour towards clients and supplier behaviour towards companies, the alpha reliability for the 10 factors equals 0.672 and 0.728, respectively; this indicates that the scale is reliable and, therefore, the 10 questions have greatly contributed to the scale's reliability.
4.3 Factor analysis
Factor analysis aims at locating common factors among all of the above variables that concern the SME operating sectors. In order to classify variables and create smaller groups (Eigen values >1), the Principal Components Analysis was used (Gronbach, 1951) with the Varimax Rotation method of Varimax axes, one of the most commonly known rotation methods (Scharma, 1996; Hair et al., 1995; Grimm, 1993; Johnson and Wivhern, 1998) for a better interpretation of the factors.
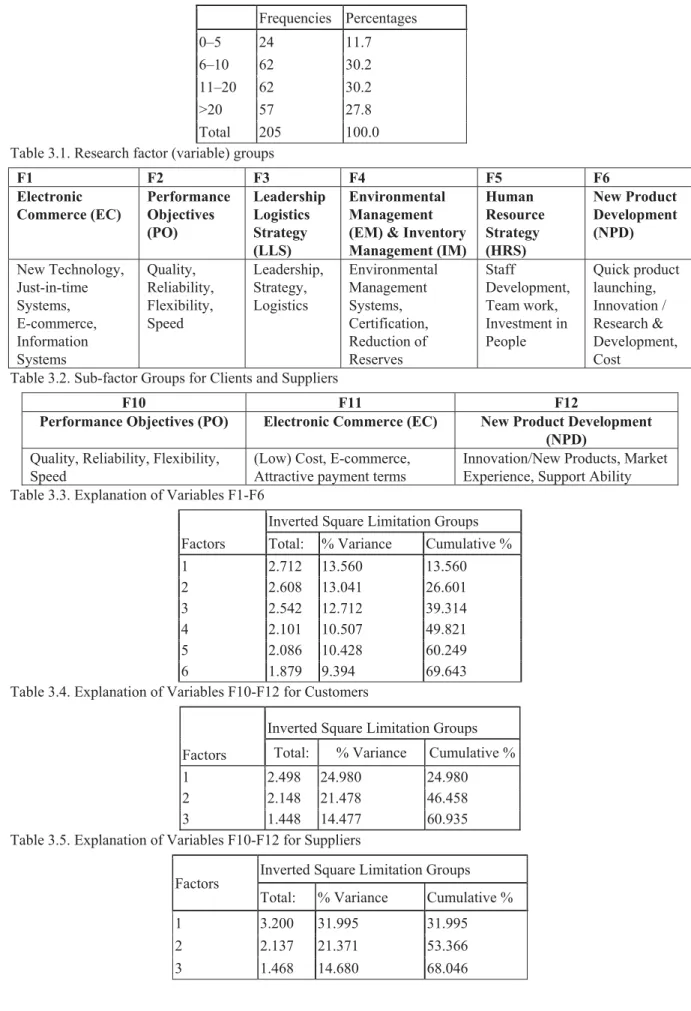
The 20 first variables that concern the attitude of SMEs were reduced to 6 smaller variables, which were given names for the sake of ease and better understanding (Table 3.1). From the 69.64% of data variance. Similarly, the 10 first customer and supplier factors were reduced to 3 and were named accordingly (Table 3.2). The factors that relate to customers, according to the 61% of data variance (Table 3.4) and those that relate to suppliers 68% (Table 3.5).
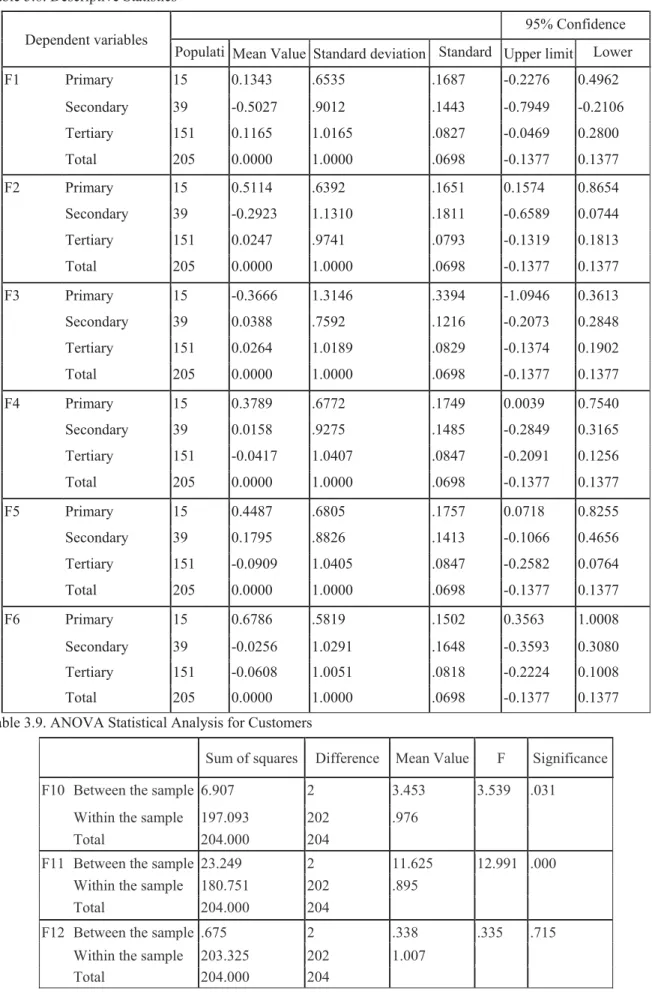
Considering the results from the calculation of the mean values, we noticed that, with regard to factors F1, F2, F6, the mean value was low both for the secondary (-0.5027) and the tertiary sector (-0.2923, -0.0256). For factor F3, the primary sector holds the lowest mean value (-0.3666), while for factors F4, F5, the lowest mean value appears in the tertiary sector (-0.0417, -0.0909). On the other hand, the highest mean values for factors F1, F2 are seen in the primary sector (0.1343, 0.5114), while for F3 in the secondary sector (0.0388). Finally, in the factors F4, F5, F6, the highest mean value is seen again in the primary sector (0.3789, 0.4487, 0.6786). What is striking is that the tertiary sector does not present a high mean value for the factors currently under examination, while the lowest mean value is seen in the secondary sector (-0.5027) and the highest mean value in the primary sector (0.5114).
The comparison of multiple Tukey mean values for those factors associated with behaviour towards customers has shown that for factor F10 the lowest mean value belongs to the primary sector (-0.2949), for F11 to the primary sector (-1.0166) and the secondary sector (-0.2843), with -1.0166 < -0.2843, and for F12 to the primary sector (-0.0997) and the tertiary sector (-0.0186), with -0.0997 > -0.0186. The highest mean value for F10 belongs to the primary sector (0.4753), for F11 to the tertiary sector (0.1744) and for F12 to the secondary sector (0.1102). It was generally observed that both the lowest (-0.2949) and the highest (0.4753) mean values are seen in the primary sector for factor F10.
From the comparison of multiple Tukey mean values, the following has emerged for each group sub-factor: The lowest mean value for factor F10 corresponds to the secondary sector (-0.3980), for factor F11 to the primary sector (-0.3264) and the secondary sector (-0.3034), with -0.3264 > -0.3034, and for factor F12 it relates to the secondary sector (-0.0939) and the tertiary sector (-0.0050), with -0.0939 < -0.0050. The highest mean value for factor F10 is seen in the primary sector (0.5200), for factor F11 in the tertiary sector (0.1108) and for factor F12 in the primary sector (0.2941). Therefore, the lowest mean value belongs to the secondary sector and mainly for
factor F10 (-0.3980), while the highest is seen in the primary sector. The only one that was statistically significant was factor F10 (since its mean value was 0.004, a value very close to the desired value of 0.005). 4.4 Analysis of Variance (ANOVA)
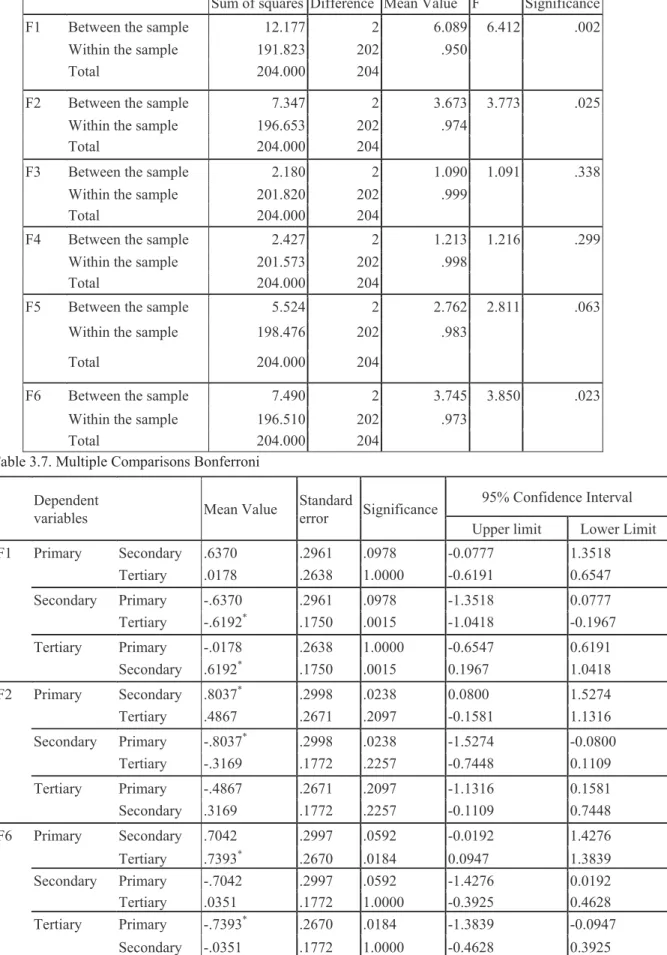
ANOVA produced the following conclusions, as presented in Table 3.5 for the three examined elements (attitude, behaviour towards customers-suppliers). When it comes to the element of attitude adopted by SMEs, only factors F1, F2, F6 were found to be statistically significant. The mean value for factor F1 that we have determined is significantly different depending on the economic sector (F=6.412 – P=0.002<0.05). The same stands also for factor F2 (F=3.773 – P=0.025) and factor F6 (F=3.85 – P=0.023). On the contrary, factors F3 (F=1.091–P=0.338> 0.05), F4 (F=1.216 –P=0.299) and F5 (F=2.811–P=0.063) do not significantly differ depending on the economic sector.
The ANOVA statistical analysis has shown that there are statistically significant differences in factors F1, F2 and F6 and, for this reason, a Bonferroni test was conducted (Post Hoc Tests) to supplement ANOVA and to determine between which factors these differences exist (Table 3.6). Therefore, for factor F1, the difference is found between the secondary and the tertiary sector at a value of =0.0015. For factor F2, a difference has been found between the primary and the secondary sector at a value of =0.238, and finally for factor F6 between the primary and the tertiary sector at a value of =0.184.
With regard to factor F1, it has been found that the use of new technologies, information systems, etc. varies depending on the economic sector under question (ANOVA: F=6.412–P=0.002). More specifically, as shown in Table 4.11, SMEs of the secondary sector (-0.5027) pay less importance in the use of new technologies than SMEs of the tertiary sector (0.1165). By examining the exact same data as above and the mean values shown in the table, it has been found that for factor F2 the significance of the factors varies greatly depending on the economic sector (ANOVA: F=3.773–P=0.025), because SMEs of the secondary sector (-0.2923) pay less importance to factors such as quality, reliability, etc. than those of the primary sector (0.5114).
With regard to factor F6, which also presents statistically significant differences depending on the sector (F=3.85–P=0.023), it has become clear that the importance paid by SMEs to innovation, research & development, etc. differs in the primary and tertiary sector. By comparing the mean values, it is stressed that the tertiary sector SMEs (-0.0608), pay less importance to these factors than primary sector SMEs (0.6786).
Moreover, the application of ANOVA was deemed necessary for the factors associated with customers, in order to ascertain whether their mean values present any statistically significant differences, depending on the economic sector. With regard to factors F10-F11, research has shown (Table 3.8) that they present statistically significant differences depending on the sector (F=3, 53–P=0, 031< 0.05 and F=12, 991–P=0.000< 0.05), as opposed to factor F12 which has produced no significant differences (F=0.335–P=0.715> 0.05).
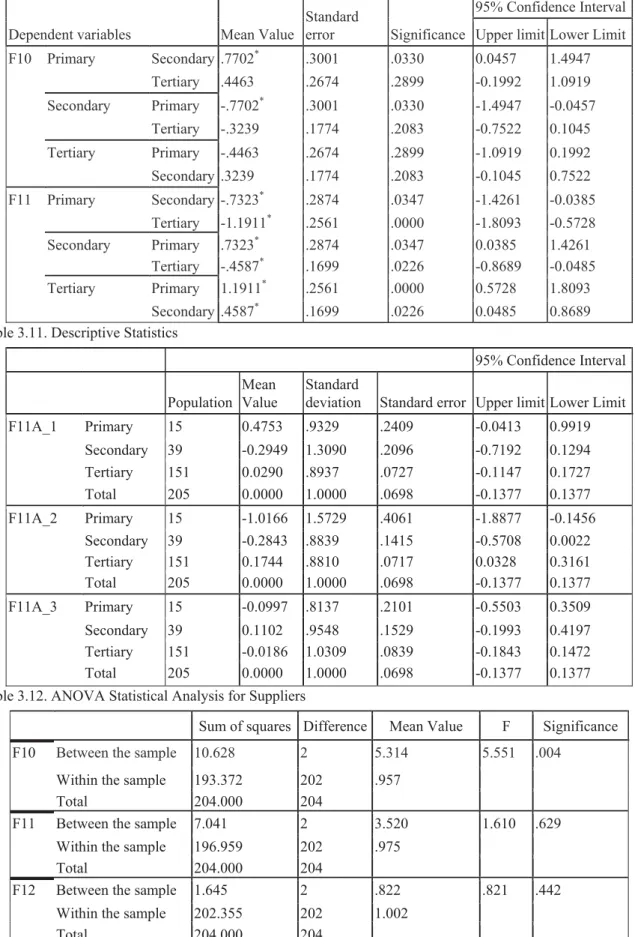
Due to the fact that ANOVA produced differences in these factors, the Bonferroni test was conducted, in order to accurately determine the groups in which such differences exist (Table 3.9). For factor F10, these differences are found between the primary and secondary sector at a value of =0.0330, while for F11 between the primary and secondary sector at a value of =0.0347, the primary and tertiary sector at a value of =0.0000, and the secondary and tertiary sector at a value of =0.0226. Particularly, it has been observed that the importance of factors quality, reliability, etc. varies significantly depending on the economic sector (ANOVA: F=3.539–P=0.031). As shown in Table 3.10, secondary sector SMEs (-0.2949) pay less attention to these factors that primary sector SMEs (0.4753). As far as factor F11 is concerned, this also varies a lot depending on the economic sector (F=12.991–P=0.000). In this case, the factors e-commerce, low cost, etc. are of less importance in primary sector SMEs (-0.0166), compared with secondary sector SMEs (-0.2843). Comparatively, primary sector SMEs (-0.0166) show less interest in these factors than tertiary sector SMEs (0.1744), while secondary sector SMEs (-0.2843) show less importance in these factors than tertiary sector SMEs (0.1744).
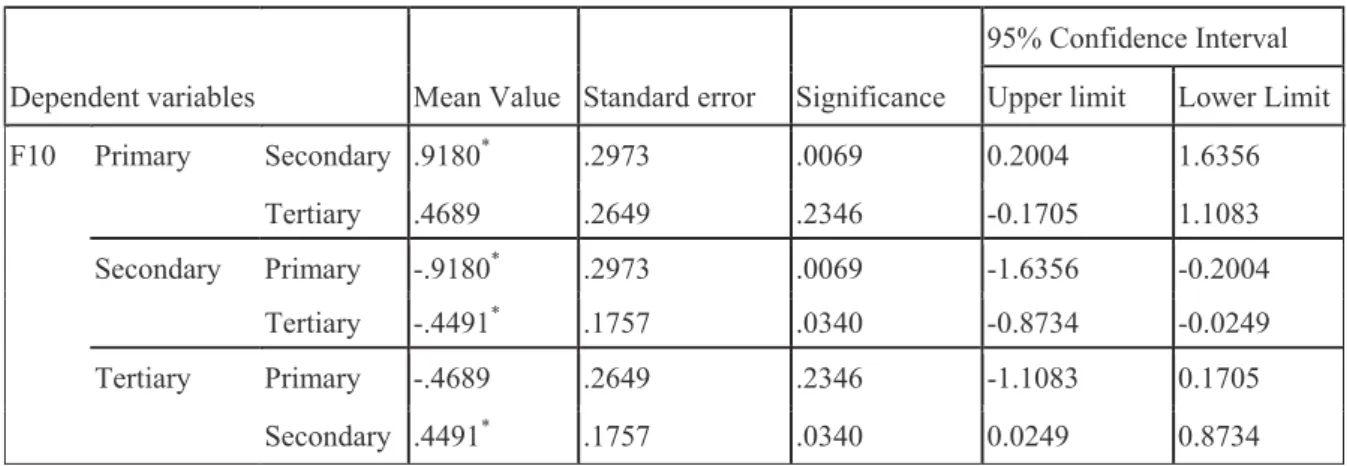
The ANOVA statistical analysis was in turn conducted in order to ascertain whether the factors associated with suppliers present any significant differences in the various economic sectors, again comparing with factor mean values. Therefore, for these factors (Table 3.1), research has shown that they do differ greatly among the various sectors (F=5.551–P=0.004< 0.05). The Bonferroni test was then in turn applied to accurately determine the differences between factors (Table 3.12). We have noticed that these differences concern the primary with the secondary sector at a value of P=0,0669, and the secondary with the tertiary sector at a value of P=0,0340. More specifically, the importance paid to the factors of quality, reliability, etc. present significant differences depending on the economic sector (ANOVA: F=5.55–P=0.004). It then becomes apparent through the comparison of mean values among different sectors (Table 3.13), that secondary sector SMEs pay les importance
(-0.3980) to quality, reliability, etc. than primary sector SMEs (0.5200). Finally, secondary sector SMEs pay less attention (-0.3980) to these factors than tertiary sector SMEs (0.0511).
5. Research Discussion
The percentage of SMEs from all three economic sectors that responded to our study was fairly satisfactory; this fact that permits us to consider this study to be a typical sample and consider the results that emerged from it as valid and reliable.
With regard to the attitude adopted by SMEs from all three sectors, the highest scores correspond to those factors associated with the use of new technologies, information systems and just-in-time systems, e-commerce, quality of goods-services offered, reliability, SME flexibility, task-order execution speed, quick product launching, innovation-research & development and the cost of performing tasks. These factors attract the attention of SMEs and are considered to be very important for them. On the other hand, administration-environmental factors, as well as factors associated with work relations are considered less important. It is thus clear that leadership within SMEs, operation strategy, the management of logistics, the existence of environmental management systems, certifications, the reduction of stocks, staff development programmes, group work and investment in people, are all of less importance to SMEs.
Although the above-mentioned factors are of great interest to SMEs, their level of importance differs among different sectors. More specifically, the use of new technologies, the availability of e-commerce, information systems and just-in-time systems present differences between the secondary and tertiary sector. This signifies that secondary sector SMEs consider these factors to be less interesting and less important than tertiary sector SMEs, which seem to pay more attention. Regarding the quality of good and services offered, reliability and flexibility of SMEs, and task execution speed, there are differences between secondary and tertiary sector SMEs. These factors, which are in fact more associated with the products, are of high importance to primary sector SMEs and of quite lower importance to those of the secondary sector. Considering the nature of primary sector businesses (e.g. farming, fisheries, agriculture, etc.), this may be construed as a justifiable result. Regarding the low cost of tasks, innovation / research & development and the quick launching of products, there are differences between the primary and tertiary sector. To our surprise, it has emerged that primary sector SMEs aim at improving these factors and pay a great deal of attention to them, as opposed to tertiary sector businesses, which appear to show almost no concern at all.
On the customer side, most importance and attention is paid to the quality of goods and services, reliability of goods and services as well as reliability of SMEs, order execution speed, SME flexibility, lowest possible costs, e-commerce and attractive payment terms. These factors constitute priorities for customers and concern all three sector SMEs. Customers seek that SMEs meet these requirements to a fairly satisfactory extent, while all three sector businesses seem to pay less importance to elements concerning innovation-research & development, purchasing experience by SMEs, ability for support.
The conclusions reached for customers and the priorities set were all as expected. Although it seems reasonable for the quality of goods and services, reliability of these goods and services and reliability of SMEs that offer these, to be construed as main factors, several differences have been observed among SMEs, depending on the sector they do business in. The importance of these factors between the primary and secondary, the secondary and tertiary, and the primary and tertiary sector, has shown significant variations. The following factors: quality of goods and services, reliability of these goods and services, reliability of SMEs, order execution speed and SME flexibility, are all of high importance for SMEs of the primary sector, yet less important for SMEs of the secondary sector. Differences have been found in all three sectors for factors associated with lower costs, e-commerce and attractive payment terms. More specifically, the interest and importance of these factors is higher for secondary sector SMEs (even though the respective scores are not too high), as opposed to primary sector SMEs. As regards the tertiary sector, the respective SMEs show a great deal of attention in these factors and they focus on these a lot compared with the other two economic sectors.
On the side of suppliers, only the following factors have obtained high importance scores: the quality of goods and services, reliability with respect to goods and services and with respect to SMEs, order execution speed, and SME flexibility. Suppliers make efforts to meet SME needs that are associated with the above factors, while they seem to care less for the lowest possible costs, e-commerce, attractive payment terms, innovation-research & development, purchasing experience and the ability to provide support.
The factors quality of goods and services, reliability of goods and services, reliability of SMEs, order execution speed and SME flexibility, are on one hand very important, but on the other hand they differ depending on the economic sector. These differences are found between the primary-secondary and the secondary-tertiary sector.
For primary sector SMEs, these factors are more important than for secondary sector SMEs. Tertiary sector SMEs consider these factors more important and pay more attention to them compared with secondary sector SMEs, while most importance is paid to these by primary sector SMEs. This is a reasonable result considering the nature and activity of businesses in this sector.
It is commonly accepted that the quality was, is and will be one of the key factors, not just for SMEs but for all types of enterprise. There are thousands of studies and extensive bibliographical research that acknowledge this phenomenon. What is odd is the fact that, while cost has always been considered as a very important factor, lately it does not seem to attract the attention of suppliers and SMEs. Its score was fairly low both in this as well as in many other studies. As far as suppliers and SMEs are concerned, meeting the expected level of quality, the speed of settling liabilities, and therefore customer service, appear to be more valuable (Carr and Pearson, 1999; Monczka and Trecha, 1998; Monczka et al., 1998; Walton et al., 1998; Giunipero and Brewer, 1993; Watts and Hahn, 1993) than the cost associated with meeting these expectations.
Given that the factors examined were the same for both customers and suppliers, it was deemed necessary to perform a comparison of the results, in order to detect any similarities or differences. These comparisons revealed what is important for customers, what their priorities are and what the case is with regard to suppliers. The study results have proven that the following factors are of major importance for both customers and suppliers: quality of goods and services, reliability, SME flexibility and task-order execution speed. Both the above categories seek to cover their needs on the above factors, which they consider to be top priorities. However the difference between customers and suppliers lies in the fact that customers also have other factors that they consider important. These factors are: low cost, e-commerce and attractive payment terms. For reasons of ease, better personal service and interest, customers seek to satisfy the above-mentioned factors in the best possible way and pay a great deal of attention to these. On the other hand, suppliers are not in the least interested in these factors, while they focus on the other factors mentioned earlier, making continuous efforts to make improvements and corrections (which does in fact make sense). Another similarity between the two categories is that innovation / research & development, purchasing experience and the ability for support are not considered important by customers and suppliers. These elements are of no value and are not taken into account when they seek to cover their needs, which are associated with the above-mentioned factors.
6. Conclusions
SME performance is directly associated with and affected not only by the procurement system, but also by logistics, and particularly by the general attitude and behaviour adopted by enterprises towards their customers and suppliers.
One of the many ways to ensure the above is to perform valid and regular supplier evaluations not only for SMEs but also for all other types of businesses. In this manner, it is possible to correct or even replace certain inadequate suppliers if the latter refuse to comply with the new requirements or if they cannot be improved; this will result in improved chain and business operations, customer satisfaction and improved communication with suppliers. In order for the above to materialise, it is essential that SMEs adopt an appropriate attitude towards all the above-mentioned business factors (mostly clients-suppliers), achieve good cooperation-trust with suppliers, and respond to the requirements of the business itself, as well as the requirements of consumers, since customers are extremely important for all types of businesses.
To summarise, all the above reveal the relationships and inter-dependence among the various factors for SMEs operating in all thee economic sectors. SMEs operating in certain sector appear to pay more attention to specific factors and less to others. This is considered as absolutely normal, since every small or medium size enterprise has different needs and engages in different activities, depending on its sector. Despite the above, if SMEs in all sectors manage to obtain satisfactory results and achieve an adequate level of satisfaction in the factors that they consider important, they will become successful and viable and they will manage to develop and make profits. In conclusion, in order for SMEs to become prosperous, they must engage in regular supplier evaluations, conducted in a valid and quality manner, adopt an appropriate business attitude and pay special attention to their behaviour towards customers and suppliers. These points need to be further studied and improved, in order for SMEs to de able to grow and develop.
References
Anderson, E. (1989). Determinants of continuity in conventional industrial channel dyads. Marketing Science, Vol. 8, No. 4, pp. 310323.
Anderson, J.C., and Gerbing, D.W. (1988). Structural equation modelling in practice: a review and recommended two-step approach. Psychological Bulletin, Vol. 103, No. 2, pp. 411–423.
Baily, P. (2005). Purchasing Principles and Management. Chapman and Hall, London.
Braglia, M., and Petroni, A. (2000). A quality assurance-oriented methodology for handling trade-offs. In Supplier selection. International Journal of Physical Distribution & Logistics Management, Vol. 30, No. 2, pp. 96-112.
Carr, A.S., and Pearson, J.N. (1999). Strategically Managed Buyer-Supplier Relationships and Performance Outcomes. Journal of Operations Management, Vol. 17, No. 5, pp. 497-519.
Cortina, J.M. (1993). What Is Coefficient Alpha? An Examination of Theory and Applications. Journal of Applied Psychology, Vol. 78, No. 1, pp. 98-104.
Degraeve, Z., and Roodhooft, F. (1998). Determining sourcing strategies: a decision model based on activity and cost driver information. Journal of the Operational Research Society, Vol. 49, No. 8, pp. 781–789.
Degraeve, Z., and Roodhooft, F. (2000). A mathematical programming approach for procurement using activity based costing. Journal of Business Finance and Accounting, Vol. 27, No. 1–2, pp. 69–98.
Dickson, (1966). An analysis of vendor selection: systems and decisions. Journal of purchasing, Vol. 1, N. 2, pp. 5-17.
Field, A. (2009). Discovering Statistics Using SPSS. 2nd ed., London: Sage.
Ghodsypour, S.H. and O’Brien, C. (1998). A decision support system for supplier selection using an integrated analytic hierarchy process and linear programming. International Journal of Production Economics, Vol. 56/57, No. 1, pp. 199-212.
Giunipero, L.C., and Brewer, D.J. (1993). Performance Based Supplier Systems under Total Quality Management. International Journal of Purchasing and Materials Management, Vol. 29, No. 4, pp. 41-46.
Gordon, S.R., and Ross. (2008). Supplier Evaluation and Performance Excellence, A Guide To Meaningful Metrics and Successful Results. J. Ross Publishing, USA.
Grayson, D. (2004). Some myths and legends in quantitative psychology. Understanding Statistics, Vol. 3 No. 1, pp. 101-134.
Grimm, L.G. (1993). Statistical applications for the behavioural sciences. Wiley & Sons, New York.
Gronbach, L.J. (1951). Coefficient alpha and the internal structure of tests. Psychometrika, Vol. 16, No. October, pp. 297-334.
Hair, J.F., Anderson, R.E., Tatham, R.L., and Black, W.C. (1995). Multivariate data analysis. Upper Saddle River: Prentice Hall.
Håkansson, H. (1989). Corporate technological behaviour-Co-operation and Networks, New York, London: Routledge.
Johnson, R., and Wivhern, D. (1998). Applied Multivariate Statistical Analysis. Prentice Hall, Upper Saddle River, New Jersey.
Kline, P. (1993). The Handbook of Psychological Testing. London: Routledge.
Kralji, P. (1983). Purchasing must become supply management. Harvard Business Review, Vol. 61, No. 5, pp. 109117.
Krause, D. R., Pagell, M., and Curkovic, S. (2001). Service review: Toward a Measure of Competitive Priorities for Procurement. Journal of Operations Management, Vol. 19, No. 4, pp. 497-512.
Masella, et al. (2000). A contingent approach to the design of vendor selection systems for different types of co-operative customer/supplier relationships. International Journal of Operations and Production Management, Vol. 20, No. 1, pp. 70-84.
McGinnis, M., and Vallopra, R. M. (1999). Purchasing and Supplier Involvement: Issues and Insights Regarding New Product Success. The Journal of Supply Chain Management, Vol. 35, No. 3, pp. 415.
Monczka, R., Trent, R., and Handfield, R. (1998). Purchasing and supply chain management. South-Western College Publishing, Cincinnati, Ohio.
Monczka, R.M., and Trecha, S.J. (1988). Cost-based supplier performance evaluation. Journal of Purchasing and Materials Management, Vol. 24, No. 2, pp. 2–7.
Murphy, D. J., and Heberling, M. E. (1996). A Framework for purchasing and integrated product teams. International Journal of Purchasing and Materials, Vol. 32, No. 3, pp. 11–19.
Nunnaly, J.C. (1978). Psychometric Theory. 2nd ed., New York: McGraw-Hill.
Ragatz, G. L., Handfield, R. B., and Scannell, T. V. (1997). Success Factors Integrating Supplier Into New Product Development. The Journal of Product Innovation Management, Vol. 14, No. 3, pp. 190203.
Sharma, S. (1996). Applied Multivariate Techniques. Willey, New York.
Vonderembse, M.A. and Tracey, M. (1999). The impact of supplier selection criteria and supplier involvement on manufacturing performance. Journal of Supply Chain Management, Vol. 35, No.3, pp.33-93.
Walton, S.V., Handfield, R.B., and Melnyk, S.A. (1998). The Green Supply Chain: Integrating Suppliers into Environmental Management Processes. International Journal of Purchasing and Materials Management, Vol. 34, No. 1, pp. 2-11.
Watts, C.A., and Hahn, C.K. (1993). Supplier Development Programs: An Empirical Analysis. International Journal of Purchasing and Materials Management, Vol. 29, No. 1, pp. 2-11.
Weber, C.A., and Desai, A. (1996). Determination of paths to vendor market efficiency using parallel co-ordinates representation: a negotiation tool for buyers. European Journal of Operational Research, Vol. 90, No. 1, pp. 142–155.
Weber, C.A., and Ellram, L.M. (1992). Supplier selection using multi-objective programming: a decision support system approach. International Journal of Physical Distribution & Logistics Management, Vol. 23, No. 2, pp. 3–14.
Weber, C.A., Current, J.R., and Benton, W.C. (1991). Vendor selection criteria and methods. European Journal of Operational Research, Vol. 50, No. 1, pp. 2–18.
Tables
Table 1. Number of SMEs in the study and number of SMEs that responded
Table 2.1. Frequency table based on sector
Frequencies Percentages
Primary 15 7.3
Secondary 39 19.0
Tertiary 151 73.7
Total 205 100.0
Table 2.2. Frequency table based on company size
Number of employees Frequencies Percentages
0–10 74 36.1
11–50 76 37.1
51-250 55 26.8
Total 205 100.0
Number and percentage of SMEs that participated in our study
Number and percentage of SMEs that responded to our study
Sectors Number of enterprises (n=620)
Percentage Number of enterprises (n=206)
Percentage
Primary 80 12.9% 28 35%
Secondary 160 25.8% 42 26.25%
Table 2.3. Frequency table based on the years of operation of the SMEs Frequencies Percentages 0–5 24 11.7 6–10 62 30.2 11–20 62 30.2 >20 57 27.8 Total 205 100.0
Table 3.1. Research factor (variable) groups
F1 F2 F3 F4 F5 F6 Electronic Commerce (EC) Performance Objectives (PO) Leadership Logistics Strategy (LLS) Environmental Management (EM) & Inventory Management (IM) Human Resource Strategy (HRS) New Product Development (NPD) New Technology, Just-in-time Systems, E-commerce, Information Systems Quality, Reliability, Flexibility, Speed Leadership, Strategy, Logistics Environmental Management Systems, Certification, Reduction of Reserves Staff Development, Team work, Investment in People Quick product launching, Innovation / Research & Development, Cost
Table 3.2. Sub-factor Groups for Clients and Suppliers
F10 F11 F12
Performance Objectives (PO) Electronic Commerce (EC) New Product Development (NPD)
Quality, Reliability, Flexibility, Speed
(Low) Cost, E-commerce, Attractive payment terms
Innovation/New Products, Market Experience, Support Ability Table 3.3. Explanation of Variables F1-F6
Factors
Inverted Square Limitation Groups Total: % Variance Cumulative %
1 2.712 13.560 13.560 2 2.608 13.041 26.601 3 2.542 12.712 39.314 4 2.101 10.507 49.821 5 2.086 10.428 60.249 6 1.879 9.394 69.643
Table 3.4. Explanation of Variables F10-F12 for Customers
Factors
Inverted Square Limitation Groups Total: % Variance Cumulative %
1 2.498 24.980 24.980
2 2.148 21.478 46.458
3 1.448 14.477 60.935
Table 3.5. Explanation of Variables F10-F12 for Suppliers
Factors Inverted Square Limitation Groups Total: % Variance Cumulative %
1 3.200 31.995 31.995
2 2.137 21.371 53.366
Table 3.6. ANOVA Statistical Analysis on the Attitude of SMEs
Sum of squares Difference Mean Value F Significance
F1 Between the sample 12.177 2 6.089 6.412 .002
Within the sample 191.823 202 .950
Total 204.000 204
F2 Between the sample 7.347 2 3.673 3.773 .025
Within the sample 196.653 202 .974
Total 204.000 204
F3 Between the sample 2.180 2 1.090 1.091 .338
Within the sample 201.820 202 .999
Total 204.000 204
F4 Between the sample 2.427 2 1.213 1.216 .299
Within the sample 201.573 202 .998
Total 204.000 204
F5 Between the sample 5.524 2 2.762 2.811 .063
Within the sample 198.476 202 .983
Total 204.000 204
F6 Between the sample 7.490 2 3.745 3.850 .023
Within the sample 196.510 202 .973
Total 204.000 204
Table 3.7. Multiple Comparisons Bonferroni
Dependent
variables Mean Value
Standard
error Significance
95% Confidence Interval Upper limit Lower Limit
F1 Primary Secondary .6370 .2961 .0978 -0.0777 1.3518 Tertiary .0178 .2638 1.0000 -0.6191 0.6547 Secondary Primary -.6370 .2961 .0978 -1.3518 0.0777 Tertiary -.6192* .1750 .0015 -1.0418 -0.1967 Tertiary Primary -.0178 .2638 1.0000 -0.6547 0.6191 Secondary .6192* .1750 .0015 0.1967 1.0418 F2 Primary Secondary .8037* .2998 .0238 0.0800 1.5274 Tertiary .4867 .2671 .2097 -0.1581 1.1316 Secondary Primary -.8037* .2998 .0238 -1.5274 -0.0800 Tertiary -.3169 .1772 .2257 -0.7448 0.1109 Tertiary Primary -.4867 .2671 .2097 -1.1316 0.1581 Secondary .3169 .1772 .2257 -0.1109 0.7448 F6 Primary Secondary .7042 .2997 .0592 -0.0192 1.4276 Tertiary .7393* .2670 .0184 0.0947 1.3839 Secondary Primary -.7042 .2997 .0592 -1.4276 0.0192 Tertiary .0351 .1772 1.0000 -0.3925 0.4628 Tertiary Primary -.7393* .2670 .0184 -1.3839 -0.0947 Secondary -.0351 .1772 1.0000 -0.4628 0.3925
Table 3.8. Descriptive Statistics
Dependent variables
95% Confidence Populati Mean Value Standard deviation Standard Upper limit Lower
F1 Primary 15 0.1343 .6535 .1687 -0.2276 0.4962 Secondary 39 -0.5027 .9012 .1443 -0.7949 -0.2106 Tertiary 151 0.1165 1.0165 .0827 -0.0469 0.2800 Total 205 0.0000 1.0000 .0698 -0.1377 0.1377 F2 Primary 15 0.5114 .6392 .1651 0.1574 0.8654 Secondary 39 -0.2923 1.1310 .1811 -0.6589 0.0744 Tertiary 151 0.0247 .9741 .0793 -0.1319 0.1813 Total 205 0.0000 1.0000 .0698 -0.1377 0.1377 F3 Primary 15 -0.3666 1.3146 .3394 -1.0946 0.3613 Secondary 39 0.0388 .7592 .1216 -0.2073 0.2848 Tertiary 151 0.0264 1.0189 .0829 -0.1374 0.1902 Total 205 0.0000 1.0000 .0698 -0.1377 0.1377 F4 Primary 15 0.3789 .6772 .1749 0.0039 0.7540 Secondary 39 0.0158 .9275 .1485 -0.2849 0.3165 Tertiary 151 -0.0417 1.0407 .0847 -0.2091 0.1256 Total 205 0.0000 1.0000 .0698 -0.1377 0.1377 F5 Primary 15 0.4487 .6805 .1757 0.0718 0.8255 Secondary 39 0.1795 .8826 .1413 -0.1066 0.4656 Tertiary 151 -0.0909 1.0405 .0847 -0.2582 0.0764 Total 205 0.0000 1.0000 .0698 -0.1377 0.1377 F6 Primary 15 0.6786 .5819 .1502 0.3563 1.0008 Secondary 39 -0.0256 1.0291 .1648 -0.3593 0.3080 Tertiary 151 -0.0608 1.0051 .0818 -0.2224 0.1008 Total 205 0.0000 1.0000 .0698 -0.1377 0.1377
Table 3.9. ANOVA Statistical Analysis for Customers
Sum of squares Difference Mean Value F Significance
F10 Between the sample 6.907 2 3.453 3.539 .031
Within the sample 197.093 202 .976
Total 204.000 204
F11 Between the sample 23.249 2 11.625 12.991 .000
Within the sample 180.751 202 .895
Total 204.000 204
F12 Between the sample .675 2 .338 .335 .715
Within the sample 203.325 202 1.007
Table 3.10. Multiple Comparisons: Bonferroni)
Dependent variables Mean Value
Standard
error Significance
95% Confidence Interval Upper limit Lower Limit
F10 Primary Secondary .7702* .3001 .0330 0.0457 1.4947 Tertiary .4463 .2674 .2899 -0.1992 1.0919 Secondary Primary -.7702* .3001 .0330 -1.4947 -0.0457 Tertiary -.3239 .1774 .2083 -0.7522 0.1045 Tertiary Primary -.4463 .2674 .2899 -1.0919 0.1992 Secondary .3239 .1774 .2083 -0.1045 0.7522 F11 Primary Secondary -.7323* .2874 .0347 -1.4261 -0.0385 Tertiary -1.1911* .2561 .0000 -1.8093 -0.5728 Secondary Primary .7323* .2874 .0347 0.0385 1.4261 Tertiary -.4587* .1699 .0226 -0.8689 -0.0485 Tertiary Primary 1.1911* .2561 .0000 0.5728 1.8093 Secondary .4587* .1699 .0226 0.0485 0.8689
Table 3.11. Descriptive Statistics
95% Confidence Interval
Population Mean Value
Standard
deviation Standard error Upper limit Lower Limit
F11A_1 Primary 15 0.4753 .9329 .2409 -0.0413 0.9919 Secondary 39 -0.2949 1.3090 .2096 -0.7192 0.1294 Tertiary 151 0.0290 .8937 .0727 -0.1147 0.1727 Total 205 0.0000 1.0000 .0698 -0.1377 0.1377 F11A_2 Primary 15 -1.0166 1.5729 .4061 -1.8877 -0.1456 Secondary 39 -0.2843 .8839 .1415 -0.5708 0.0022 Tertiary 151 0.1744 .8810 .0717 0.0328 0.3161 Total 205 0.0000 1.0000 .0698 -0.1377 0.1377 F11A_3 Primary 15 -0.0997 .8137 .2101 -0.5503 0.3509 Secondary 39 0.1102 .9548 .1529 -0.1993 0.4197 Tertiary 151 -0.0186 1.0309 .0839 -0.1843 0.1472 Total 205 0.0000 1.0000 .0698 -0.1377 0.1377
Table 3.12. ANOVA Statistical Analysis for Suppliers
Sum of squares Difference Mean Value F Significance
F10 Between the sample 10.628 2 5.314 5.551 .004
Within the sample 193.372 202 .957
Total 204.000 204
F11 Between the sample 7.041 2 3.520 1.610 .629
Within the sample 196.959 202 .975
Total 204.000 204
F12 Between the sample 1.645 2 .822 .821 .442
Within the sample 202.355 202 1.002
Table 3.13. Multiple Comparisons: Bonferroni)
Dependent variables Mean Value Standard error Significance
95% Confidence Interval Upper limit Lower Limit
F10 Primary Secondary .9180* .2973 .0069 0.2004 1.6356 Tertiary .4689 .2649 .2346 -0.1705 1.1083 Secondary Primary -.9180* .2973 .0069 -1.6356 -0.2004 Tertiary -.4491* .1757 .0340 -0.8734 -0.0249 Tertiary Primary -.4689 .2649 .2346 -1.1083 0.1705 Secondary .4491* .1757 .0340 0.0249 0.8734
Table 3.14. Descriptive Statistics
95% Confidence Interval Populati on Mean Value Standard deviation Standard error Upper
limit Lower Limit F10 Primary 15 0.5200 .5135 .1326 0.2357 0.8044 Secondary 39 -0.3980 1.3742 .2201 -0.8434 0.0475 Tertiary 151 0.0511 .8866 .0722 -0.0914 0.1937 Total 205 0.0000 1.0000 .0698 -0.1377 0.1377 F11 Primary 15 -0.3264 1.2713 .3282 -1.0304 0.3776 Secondary 39 -0.3034 1.0733 .1719 -0.6513 0.0446 Tertiary 151 0.1108 .9329 .0759 -0.0392 0.2608 Total 205 0.0000 1.0000 .0698 -0.1377 0.1377 F12 Primary 15 0.2941 .5075 .1310 0.0131 0.5751 Secondary 39 -0.0939 1.1466 .1836 -0.4655 0.2778 Tertiary 151 -0.0050 .9960 .0810 -0.1651 0.1552 Total 205 0.0000 1.0000 .0698 -0.1377 0.1377