Abstract—this paper explores distribution system automa-tion, automatic reconfiguration after a disturbance and the impact on reliability in a ‘smart’ power distribution system. The use of network incidence or connectivity matrices is shown and an example indicates the potential operational capabilities of a ‘smart distribution system’. A discussion of the potential advantages of electronic switching in distribu-tion engineering is also given. The connecdistribu-tion with the Smart Grid initiative is made in the paper.
Index Terms— Distribution automation, distribution system reconfiguration, distribution system restoration, reliability, distribution engineering, Smart Grid.
I. POWER DISTRIBUTION SYSTEMS AND THE ‘SMART GRID’
MART GRID technology includes the application of
automation and digital controls to power systems in general and to distribution systems in particular. Title XIII of the recently signed Energy Independence and Secu-rity Act of 2007 [1] includes the following characteristics of
a Smart Grid:
Increase in use of digital control and information technology with real time availability
Dynamic optimization relating to grid operability Inclusion of demand side response (DSR) Demand side management (DSM) technologies Integration of distributed resources (DR) including
renewables and energy storage Deployment of smart metering Distribution automation
Smart appliances and customer devices at the point of end use.
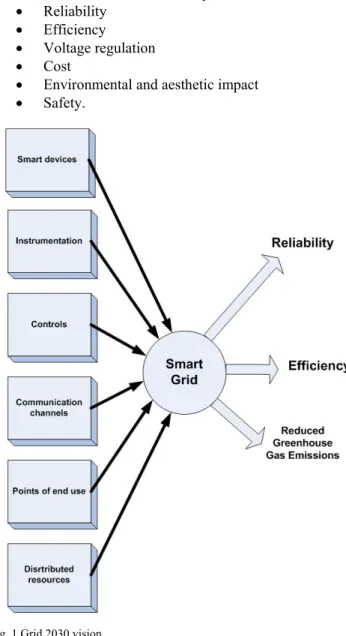
The details of how the Smart Grid will accomplish these goals and the details of what is (and is not) included in the Smart Grid is a subject of continuing discussion; however, the elements of Fig. 1 illustrate the scope of the Department of Energy (DoE) Grid 2030 vision [2].
It is interesting to contrast ‘Smart Grid’ technologies with classical distribution system design. One conclusion of such an exercise is that Smart Grid designs should have the same
The authors acknowledge the Power Systems Engineering Research Center (PSerc) for supporting this work. G. T. Heydt also acknowledges the support of the Future Renewable Electric Energy Management and Distri-bution (FREEDM) center, a National Science Foundation Engineering Research Center (award number EEC-08212121).
Authors Haughton and Heydt, are with the Department of Electrical, Computer and Energy Engineering, Ira A. Fulton Schools of Engineering, Arizona State University, Tempe, AZ 85287 USA (e-mail: {da-niel.haughton, heydt}@asu.edu).
or superior levels of safety and reliability as compared to classical designs. References [3-5] are a small sample of the
many comprehensive references relating to classical design. The main elements of distribution system assessment are:
Reliability Efficiency Voltage regulation Cost
Environmental and aesthetic impact Safety.
Fig. 1 Grid 2030 vision
The art and science of distribution engineering, distribution system design and system operation present a multitude of complex objectives, as previously identified. For example, reliability, efficiency, and safety must be maximized while simultaneously protecting assets, minimizing costs and cus-tomer disturbances. These objectives impact the choice of distribution system assets, substation topologies, locations,
Smart Distribution System Design:
Automatic Reconfiguration for Improved Reliability
D. Haughton,
Student Member IEEE
G. T. Heydt,
Life-Fellow
IEEE
primary feeder design, feeder and substation protection schemes and other significant engineering decisions.
Transitioning from contemporary systems to smart dis-tribution systems of the future requires a paradigm shift in both design and operations. This paradigm shift is due in part to the increased use of DSM and DSR; even more significant is the burgeoning of distributed resources, many of which are considered renewable energy sources—wind and solar. Massive deployment of renewable energy systems is ex-pected to occur in electric distribution systems in the near future [1, 2]. New philosophies of redesigning the existing
distribution system topology and rapid restoration following system disturbances are imperative to maximize the use of these resources.
This paper focuses on specific aspects of the technical design and operation of a ‘smart’ distribution system, con-sidering impacts on reliability and incorporating new tech-nology in the design process. No attempt is made to manage any of the aforementioned multiobjectives. Taking the above elements under consideration, this paper describes some design and operational philosophies for the smart distribution system. The paper is organized as follows: Sec-tion II briefly describes relevant contemporary indices for measuring system reliability; Section III discusses the up-grading of legacy radial distribution systems; Section IV discusses the promise of electronic switching; Section V illustrates an example; Section VI discusses the use of sen-sory information in a Smart Grid; Section VII explores practical benefits of automation and Section VIII summa-rizes the main conclusions.
II. SYSTEM RELIABILITY MEASURES
Perhaps the best known distribution system reliability measures are the system average interruption duration index (SAIDI) and the system average interruption frequency index (SAIFI),
(1) (2) These indices do not capture all information relating to system reliability, and they notably omit capture of the load lost during outages. The indices also suffer from the fact that they are often calculated inconsistently [6]. Since these
indices are system averages, they may not give information on specific bus reliability. For specific bus reliability, load point indices are required. Additional similar indices are the customer average interruption duration index (CAIDI) and the average service availability index (ASAI),
(3)
(4)
Note that the ASAI and similar indices may be expressed as a ‘number of nines,’ N9, where
N9 = -log10(1-ASAI). (5)
Thus N9 for ASAI = 0.9999 would be 4 as an example [7]. Eq.
(5) can be approximated by the Taylor series expansion,
0.43429 1
(6) where a system upgraded from an ASAI of A to an ASAI of A + ΔA results in a concomitant increase in reliability of N9to . Similarly, for an upgrade of SAIDI to SAIDI + ΔSAIDI (i.e., ΔSAIDI < 0) ,
0.43429
. (7)
Indices like SAIDI, SAIFI and others provide system wide reliability measures. The reliability measures of distribution system components or individual buses (also referred to as load point indices in references [8, 9]) can be determined. These indices include the average failure rate, λ (expected number of failures/year); expected outage time, r (h); annual unavailabil-ity, U (h/y); and expectation of unserved energy, E
(kWh/outage or kWh/y), that captures the energy demanded by system loads that cannot be delivered to those loads. [8].These probabilistic data may be adjusted using historical data or factors unique to the area of study, such as weather effects, aging infrastructure or other data pertinent to assessing ex-pected component lifetime. Load point indices can be used to evaluate the relative performance of alternative system de-signs, restoration plans or system topology changes. Reference
[6] discusses the advantage of using these indices for
ben-chmarking in a repeatable and standardized environment. Standardized test beds are useful in calculating reliability indices and in evaluating the reliability of systems that have been seen before and ‘solved’ before (e.g., a restoration plan has been calculated in the open literature). Reference [9] presents a realistic power system test bed, complete with gen-eration, transmission and distribution along with system relia-bility analysis and data. As indicated by the authors of refer-ence [9], the distribution system is the most significant part of the integrated power system that negatively impacts system reliability indices. Therefore, distribution systems are the most appropriate location to realize system reliability improvement. References [8-13] further elaborate on measures of distribution
system reliability.
III. UPGRADING THE DISTRIBUTION SYSTEM FOR IMPROVED
PERFORMANCE DURING RESTORATION
The ‘Smart Grid’ initiative is visualized by the authors as a coordinated transition from contemporary legacy distribution systems to an automated, self-healing, and more reliable sys-tem. The Smart Grid includes the elements discussed in Sec-tion I and refined tools for real-time assessment of system operating conditions as indicated in Fig. 2. Reference [14] further elaborates on the topic of self-healing power systems,
communications and controls required, and the Smart Grid initiative.
The distribution system of the future must be designed so that rapid restoration is possible. Research on system resto-ration has largely been confined to transmission systems. This is because transmission systems are networked. However, it is envisioned that future distribution systems will increasingly migrate to networked configurations – especially in areas of high load density. Rapid distribution restoration can accomplish multiple objectives, including reduction of the classical system average interruption dura-tion and frequency indices, and/or the minimizadura-tion of un-served energy to loads. A highly reliable, reconfigurable, and fault tolerant system, must contain multiple redundant paths. More important than multiple paths are smart strate-gies for fault detection, isolation and reconfiguration (FDIR) to manage redundancy. The existence of FDIR in contem-porary networked distribution systems is limited to local protection schemes which usually do not communicate with each other. Thus, in order to selectively convert existing distribution systems into smart distribution systems, it is proposed to add FDIR mechanisms and other automatic control devices. The methods used for FDIR may replicate transmission system concepts that use system restoration logic to automatically restore the distribution system. Using circuit matrix concepts, the optimization of the reliability at system buses shall be performed based on the reliability of individual components.
Fig. 2 Visualization of the transition from legacy distribution systems to the Smart Grid, enabling technologies, and tools
Various methods are available to accomplish system re-configuration. In this paper, a binary connection matrix, B, is used to model the distribution system for connectivity. Branches are modeled as ones when energized and zero
when deenergized,
1
1
0
For a system with n buses, the matrix Bn-1 will contain all
ones except in positions ij where i and j are not connected to
each other through any number of intervening buses. Thus a
zero entry in Bn-1 identifies buses that are not energized
[10]. B
is an n x n matrix and contains binary entries. It is possible to ‘raise B to higher powers’ using Boolean operations, e.g., where and are Boolean OR and AND operators respec-tively. This matrix and its powers (i.e. Bn) can be used to trace connectivity of the networked system. The modeling of circuit breakers and switches is such that breakers or switches are represented as ones when closed and zero when open.
As an example, an objective may be the minimization of unserved energy after a component failure and consequent reconfiguration. The B matrix allows all energized loads, line segments and buses to be identified for all allowable network configurations.
IV. THE PROMISE OF ELECTRONIC SWITCHING
Determination of whether a low voltage or outage event ‘counts’ toward some reliability metric (e.g., SAIDI, SAIFI) depends on the duration and severity of the event. This subject has been examined in connection with the electric power quality of voltage at a given bus. As an example, consider the Information Technology Industry Council (ITIC) curve as shown in Fig. 3.
Fig. 3 ITIC power acceptability curve, total outage tolerated for about 16.7 ms
Fig. 3 defines a region in the T-|ΔV| plane (T is the duration of an event, |ΔV| is the depth of low (or high) root mean square voltage at a load bus. A low voltage event as low as -100% (i.e., a total outage) could be tolerated for about one cycle (60 Hz system). If electronic switches were used to reconfigure a distribution system, the 16.7 ms objective is readily realized. Note that the system must detect the low voltage condition within this period – and this is presently commercially attain-able in the one-quarter cycle range. As an example, the dq0
transformation may be used to track the voltage magnitude in real time [15] and the dq0 signal amplitude may be used to initiate circuit reconfiguration. It is concluded that with
elec-0.0001 0.001 0.01 0.1 1 10 100 1000 -100 -50 0 50 100 150 200 250 TIME IN SECONDS PER C E N T C H A N G E IN BU S VO LTAG E 8.33 ms OVERVOLTAGE CONDITIONS UNDERVOLTAGE CONDITIONS 0. 5 CYCLE RATED VOLTAGE ACCEPTABLE POWER 10%
+--tronic switching of the primary distribution system, it is possible to insure continuous operation of loads that comply with the ITIC curve.
Electronic components in the distribution system offer the possibility of energy management in the presence of distri-buted renewable resources. That is, as renewable resources become available, these generation resources usually require electronic converters to interface to the distribution system. The converters could be controlled to effect energy man-agement.
The ‘promise’ of electronic control in distribution systems does not come without its challenges. Table I shows some of these challenges. These challenges are the subject of present research. For example: Silicon Carbide offers the possibility of high power switching at high speed; cost of components is frequently reduced in mass production of semiconductor devices; voltage withstand capability is possible with series connections and optically controlled semiconductors; and it may be that the value of integration of renewable resources and high speed control comes at a manageable dollar cost.
TABLE I CHALLENGES OF SEMICONDUCTOR CONTROLLED
DISTRIBUTION CLASS DEVICES
Phenomenon Basic problem Mitigation possibilities
Basic impulse level – insulation coordination Voltage breakdown of typical semicon-ductor components may be problematic (below distribution class voltages)
Use of voltage limiting devices
Use lower distribution voltages
Development of more suitable semiconductor materials
Switching losses
High power loss, proportional to switching frequency
Low loss switching strate-gies (e.g., zero voltage or zero current switching) Bulk resistive losses in semi-conductors I2R loss in semicon-ductors Development of more suitable semiconductor materials
Use of low current con-figurations
Cost of compo-nents
High cost of high power switches Mass production Development of better manufacturing tech-niques Cooling semi-conductor com-ponents Losses in semicon-ductor switches
Oil and air cooled tech-nologies
Reduce losses in semi-conductor switches
Isolation and
safety No ohmic isolation afforded by semi-conductor switches
Principle of ‘insulation by isolation’
Judicious use of circuit breakers to isolate cir-cuits
Use a magnetic trans-former for isolation Component
life-time
Loss of life due to
heat Better cooling Reduce losses
It should be noted that the greatest improvement in system reliability is obtained through networking with appropriate interruption of unserviceable circuits [8, 16]. This generally means the inserting of network interrupters (fuses, circuit breakers, load break switches, solid state interruption de-vices) – and sensors should be used to effectuate the inter-ruption. References [16, 17] discuss networking the
sec-ondary distribution system – a method that has given im-provement in SAIDI and SAIFI by nearly a factor of ten in some cases.
Note that there are disadvantages to a solid state controlled energy processor (e.g., a solid state transformer). Some of the disadvantages can be obviated by passing a certain percentage of the power that is ultimately delivered to the load through a conventional magnetic transformer. This configuration is shown in Fig. 4. Note that this hybrid configuration avoids some of the problematic conditions indicated in Table I, namely:
Reduces losses due to electronic switching (the magnetic transformer losses are generally below 2% for 50% load) Renders manufacturing problems of the semiconductor
controlled elements easier Reduces cooling requirements Improves component life.
Fig. 4 Two configurations for a controlling energy flow to a load (A) via a solid state transformer and (B) a hybrid approach using a magnetic transformer as well as an SST.
V. AN EXAMPLE OF RAPID RESTORATION
A rapidly restorative system will follow an algorithm similar to that identified in Fig. 5 where real time sensory monitoring and analysis of the distribution network takes place. It is im-portant in many automated systems that controls exist such that an operator may assume control of the distribution system. For example, maintenance work or construction may require that automated system reconfiguration or restoration be disengaged for the safety of utility or construction workers.
References [8, 9] provide details of the test bed used in this paper, better known as the RBTS. The RBTS is a six bus test system with five load buses, eleven generators, nine transmis-sion lines, 240 MW of installed capacity and a peak load of 185 MW. The system also has voltages at the 230 kV, 138 kV, 33 kV, 11 kV and 4 kV. The system is sufficiently small that it can be studied and analyzed in detail but sufficiently large to be considered non-trivial. [9].
Fig. 5 Automated monitoring of system connectivity in real-time
The largest distribution subnetwork in the RBTS is bus 3; it has peak total load of 85 MW, average load of 52.63 MW, industrial, large user, office buildings, residential and commercial customers. The one line diagram of bus 3 is show in Fig. 6. The one line diagram of the overall system
may be found in reference [9]. The RBTS is used for
eva-luating the performance of incorporating automated, re-motely operated electronic switches and the corresponding increase in reliability. A system incorporating electronic switching is consistent with the goals of a Smart Grid.
The system of Fig. 6 depicts the distribution network of bus 3 with 44 load buses, 77 line segments, switches and normally open points. Manually operated isolation switches are replaced with remotely controlled switches in selected locations. The algorithm identified by Fig. 5 and the binary bus connectivity matrix may be used for a comparative evaluation of contemporary methods of circuit reconfigura-tion for restorareconfigura-tion versus automated switching. This exam-ple assumes FDIR systems operate in an ideal manner; switching times for automated restoration and system re-configuration scenarios are drastically reduced. Failure probability and frequency of events are held constant for comparison purposes. The results obtained show that aver-age repair times, annual unavailability and expectation of unserved energy can be reduced. Table II presents load point reliability indices of the base case situation presented in reference [9]. Table III presents results of an automated, ‘smart’ distribution system. As indicated, λ values for each load point are the same in each case, but all other indices are reduced with automation.
TABLE IIBASE CASE RELIABILITY INDICES FOR BUS 3 GIVEN IN [9]*
Load Point λ (f/y) r (hr) U (h/y) E (MWh/y)
1 0.3010 11.4352 3.4420 1.6122 3 0.3140 11.1688 3.5070 1.0121 8 0.2210 1.9412 0.4290 0.3634 27 0.3205 10.9626 3.5135 1.9957 41 0.1885 1.8276 0.3445 2.5319 44 0.2015 1.7742 0.3575 1.5689 Total† 66.68 SAIDI 3.4726 SAIFI 0.3028 *The data in the table are taken directly from [9] and they do not entail the use of any electronic switching devices. The notation f/y refers to failures per year. †The total energy unserved is summed over all 44 load points
TABLE IIIRELIABILITY INDICES FOR BUS 3 WITH ELECTRONIC SWITCHING*
Load Point λ (f/y) r (hr) U (h/y) E (MWh/y)
1 0.3010 10.6146 3.1950 1.4965 3 0.3140 10.3822 3.2600 0.9408 8 0.2210 1.1765 0.2600 0.2203 27 0.3205 10.1716 3.2600 1.8517 41 0.1885 1.0345 0.1950 1.4332 44 0.2015 0.9678 0.1950 0.8558 Total† 57.14 SAIDI 3.2322 SAIFI 0.3028 *The data in the table reflect system performance with electronic devices inserted in every branch. Note the improvement over data shown in [9] (which are tabulated in Table II).
†The total energy unserved is summed over all 44 load points
It should be noted here that further networking of the pri-mary distribution system, and especially of the secondary distribution system, can produce far greater reductions in r, U,
E, and SAIDI, as reliability increases when the number of redundant paths increase [17, 18].
VI. UTILIZATION OF SENSORY INFORMATION
In Figs. 1 and 2, there is an implication that a key element of the Smart Grid philosophy is the use of sensory information to effectuate system control. Conventional instrumentation might be used to measure quantities such as voltage magnitude, cur-rent, power, reactive power. Additional instrumentation may augment the legacy measurements in areas such as tempera-ture, overhead conductor sag, weather, condition of insulating oil, and customer information. Also, the prospect of using the Global Positioning System allows the synchronization of these measurements via time stamping. Alternative instrumentation concepts are discussed in [24].
As an example of the dimensionality of the sensory re-quirements, note that in the segment of the RBTS system stu-died in Section V, approximately 37 active power measure-ments need to be made and approximately 80 control signals need to be sent. As a reminder, this example has 33 load buses.
VII. INCLUSION OF ECONOMIC CONSIDERATIONS IN THE
RESTORATION PLAN
Assigning value to the cost of unserved energy is a complex, subjective issue. Effects of interruptions may be direct or in-direct. Cost of effects such as industrial and manpower effi-ciency reduction, injury, social disruptions due to unexpected outages (e.g., electrified public transit systems, traffic signals) are not easily quantifiable [13, 20].
Literature suggests that the average customer may not be willing to pay more for improved reliability. Also, the simple calculation of lost revenue from unsupplied energy does not sufficiently capture the aggregated cost of an interruption. References [19-22] detail a number of attempts to quantify
the cost of unserved energy; there is no standardized me-thodology for assessing interruption cost.
An alternate scenario involves assigning a ‘multiplication factor’ to calculate the value of unserved energy. Industrial, commercial, residential, government and other loads have different multipliers that correlate to the impact of an inter-ruption [20]. For example, a short duration interinter-ruption of a manufacturing plant process may halt production from a few minutes to a few hours. This may translate to millions of dollars in lost revenue to the manufacturer [19]. This same philosophy can be applied to large and small industrial, large and small commercial, and residential loads. These multip-liers may be applied to a reliability study to determine the cost-to-benefit of alternate cases.
The following example incorporates multiplication factors using automated electronic switching described in Section V. Table IV presents a range of multiplication factors for different load types based on data obtained from [19 – 22] and average historical electricity prices as identified by the U.S. DoE Energy Information Administration (EIA) [23]. Consider as a final example the RBTS system without au-tomation (exactly as in [9]), versus the configuration in Fig. 6 with every switch automated / operated using the algorithm shown in Fig. 5. Incorporating the multipliers shown in Table IV, one obtains improvement in unserved energy which results in a dollar value also indicated in Table IV. In Table IV, the improvement value is shown for selected load points, and also for the entire RBTS.
TABLE IVMULTIPLICATION FACTOR METHOD FOR DETERMINING THE COST OF UNSERVED ENERGY DEMONSTRATING POTENTIAL FINANCIAL SAVINGS OF AN AUTOMATED SYSTEM
Load Point
Load Type Multipliers ($/MWh) Value of auto-mation ($/y) 1 Residential 1 - 50 11 - 532 3 Commercial 20 - 200 119 - 1190 8 Small industrial 10 - 100 76 - 760 27 Office buildings 20 – 200 240 - 2400 41 Large industrial 50 - 300 3000 - 17,600 44 Large industrial 50 - 300 1900 - 11400 Total† . 16720 - 118210 †The total energy unserved is summed over all 44 load points
In order to fully assess the cost to benefit of automation of the distribution system, one would need a less uncertain set of multipliers than those indicated in Table IV. The results of a cost to benefit analysis would be system dependent; however, the values tabulated suggest that there may be cases for which the proposed automation is favored.
VIII. CONCLUSIONS
Automated restoration offers the potential of improved reliability over manually restored systems. It is possible to reduce average customer outage times, annual unavailability and expectation of unserved energy by automating distribu-tion systems. There is a considerable potential in
improve-ment of system performance in terms of reliability, speed of restoration, and the integration of distributed resources through the use of electronic switching; but these enhance-ments come with challenges. The challenges include reduc-tion of losses due to electronic switching; improvement of the reliability of electronic converters (especially micro-processor controlled devices); and innovative solutions to insulation coordination. Cost is also an identified key chal-lenge. The analysis of when to restore, and how to restore service has been proposed through the use of an off-line calculated table and properties of the binary bus connection matrix. A suggestion has been offered for the calculation of the cost to benefit ratio of distribution automation. The ideas indicated are in line with the Smart Grid concept which is basically the use of sensory information to enhance system performance through control and system reconfiguration.
IX. REFERENCES
[[1] 110th Congress of United States, “Smart Grid,” Title XIII, Energy
Independence and Security Act of 2007, Washington DC, December 2007.
[2] Office of Electric Transmission and Distribution, United States De-partment of Energy, “Grid 2030: a national vision for electricity’s second 100 years,” Washington DC, April 2003.
[3] Westinghouse Electric Co., Electrical Transmission and Distribution
Reference Book, East Pittsburgh, PA, 1964.
[4] W. Kersting, Distribution System Modeling and Analysis, New York, NY: CRC Press, 2006.
[5] I. Novak, Power Distribution Network Design Methodologies, Chicago,
IL: IEC Publications, 2008.
[6]V. Werner, D. Hall, R. Robinson, C. Warren, “Collecting and
catego-rizing information related to electric power distribution interruption events: data consistency and categorization for benchmarking surveys,” IEEE Trans. on Power Delivery, v. 21, No. 1, January 2006, pp. 480 – 483.
[7] G. Heydt, “Improving distribution reliability (the N9 problem) by the
addition of primary feeders,” IEEE Transactions on Power Delivery, v. 19, No. 1, January 2004, pp. 434 – 435.
[8] R. N. Allan, R. Billinton, Reliability Evaluation of Power Systems, 2nd ed., Springer, 1996
[9] R. Billinton, S. Jonnavithalu, “A test system for teaching overall power system reliability assessment,” IEEE Transactions on Power Delivery, v. 11, No. 4, November 1996, pp. 1670-1676
[10] G. Heydt, Computer Analysis Methods for Power Systems, 2nd ed., Scottsdale, AZ: Stars in a Circle Publications, 1996.
[11] H. L. Willis, Power Distribution Planning Reference Book, New York,
NY: Marcel Dekker, 1997.
[12] R. Billinton, R. Ringlee, A. Wood, Power System Reliability Calcula-tions, Cambridge MA: MIT Press, 1973.
[13] J. Burke, Power Distribution Engineering – Fundamentals and Ap-plications, New York, NY: Marcel Dekker, 1994.
[14] S. Amin, B. Wollenberg, “Towards a smart grid—power delivery for the 21st century,” IEEE Power and Energy Magazine, v. 3, No. 5, pp. 34-41
[15]S. Suryanarayanan, G. T. Heydt, R. Ayyanar, J. D. Blevins, S. W. Anderson, “Simulation based Considerations in Placement of Capacitors near a Dynamic Voltage Restorer,” Simulation Modeling Practice and Theory, vol. 16, no. 9, October 2008, pp. 1430-1437.
[16] R. E. Brown, "Network reconfiguration for improving reliability in distribution systems," in Proc. 2003 IEEE Power Engineering Society General Meeting, Toronto, Canada, July 2003.
[17] W. Steeley, C. Perry, M. Vaziri, “Interconnection of Distributed Energy Resources in Secondary Distribution Network Systems,” EPRI white paper 1012922, Technical Update, Palo Alto, CA, December 2005 [18] R. P. Fanning, “Implementation of networked primary and secondary distribution systems for US utilities,” Proc. IEEE Power Engineering Society General Meeting, July 2003, vol. 4, pp. 2425 – 2429.
[19] R. Thallam, “Impact of grid connected distributed generation on power quality and reliability at a semiconductor fab,” presentation at Arizona State University, Tempe, AZ, October 2, 2009
[21] P. J. Balducci, J. M. Roop, L. A. Schienbein, J. G. DeSteese, M. R. Weimar, “Electrical power interruption cost, estimates for individual in-dustries, sectors, and the U.S. economy,” Pacific Northwest National La-boratories, U.S. DoE Office of Power Technologies, February 2002. [20] K. H. LaCommare, J. H. Eto, “Cost of power interruptions to electricity consumers in the United States,” Ernest Orlando Lawrence Berkeley Na-tional Laboratory, February 2006.
[22] A. A. Chowdhury, D. Koval, “Value-based power system reliability planning,” IEEE Transactions on Industry Applications, v. 35, No. 2, March/April 1999, pp. 305 – 311
[23] “Average Retail Price of Electricity to Ultimate Customers: Total by End-Use Sector,” Energy Information Administration, [Online]:
http://www.eia.doe.gov/fuelelectric.html
[24] G. T. Heydt, S. Bhatt, “Present and future trends and needs in electric power quality sensors and instrumentation,” Journal of Electric Machines and Power Systems, v. 27, No. 7, July, 1999, pp. 691 – 700.
X. BIOGRAPHIES
Daniel Haughton (StM ’09) was born in Kingston, Jamaica and spent most of his life in Belize City, Belize. His B.S.E.E degree is from the University of South Florida, Tampa FL (2006), and M. S. E. E. from Arizona State University, Tempe AZ (2009).Mr. Haughton has industrial experience with the California ISO, Folsom, CA; Tampa Electric Co., Tampa FL; and Belize Electricity Limited, Belize City. He is presently completing requirements for the PhD. at Arizona State University.
Gerald Thomas Heydt (StM ’62, M ’64, SM ’80, F ’91, LF ‘08) is from Las Vegas, NV. He holds the Ph.D. in electrical engineering from Purdue University, West Lafayette, Indiana (1970). His industrial experience is with the Commonwealth Edison Company, Chicago, and E. G. & G., Mercury, NV. He is a member of the National Academy of Engineering. Dr. Heydt is presently the site director of a power engineering center program at Arizona State University in Tempe, AZ where he is a Re-gents’ Professor. He is the recipient of the 2010 Harold Kaufmann IEEE Field Award.


![Fig. 6 RBTS test bed with one line diagram of bus 3 [9]](https://thumb-us.123doks.com/thumbv2/123dok_us/1041655.2637919/6.1188.195.982.83.736/fig-rbts-test-bed-line-diagram-bus.webp)