UKnowledge
UKnowledge
MPA/MPP Capstone Projects Martin School of Public Policy and Administration
2008
Property Tax Revenue Decline in the State of California and the
Property Tax Revenue Decline in the State of California and the
Implications: An Examination of Selected Local Governments in
Implications: An Examination of Selected Local Governments in
the State of California
the State of California
Ryan M. MauldinUniversity of Kentucky
Follow this and additional works at: https://uknowledge.uky.edu/mpampp_etds
Part of the Finance and Financial Management Commons, Policy Design, Analysis, and Evaluation
Commons, and the Taxation Commons
Right click to open a feedback form in a new tab to let us know how this document benefits you. Right click to open a feedback form in a new tab to let us know how this document benefits you.
Recommended Citation Recommended Citation
Mauldin, Ryan M., "Property Tax Revenue Decline in the State of California and the Implications: An Examination of Selected Local Governments in the State of California" (2008). MPA/MPP Capstone Projects. 160.
https://uknowledge.uky.edu/mpampp_etds/160
This Graduate Capstone Project is brought to you for free and open access by the Martin School of Public Policy and Administration at UKnowledge. It has been accepted for inclusion in MPA/MPP Capstone Projects by an authorized administrator of UKnowledge. For more information, please contact UKnowledge@lsv.uky.edu.
Martin School of Public Policy & Administration, University of Kentucky
Property Tax
Revenue Decline in
the State of California
and the Implications
An examination of Selected Local Governments in the State of California Ryan M. Mauldin 4/10/2008Acknowledgements: I would like to thank
Dr. Dwight Denison and Dr. Edward Jennings of the Martin School of Public Policy & Administration My panel- Dr. Merl Hackbart; Dr. David Wildasin
In addition, each
individual who devoted their time and effort to ensure the successful completion of this project.
Table of Contents
Executive Summary ... 4
Background ... 5
The Impact of Subprime Mortgages on California’s Economy ... 7
Property Taxes in California its Role & Key Legislation ... 11
SB 154 (Chapter 292, Statutes of 1978)... 14
AB 8 (Chapter 282, Statutes of 1979)... 14
Proposition 98 ... 14
Creation of the Educational Revenue Augmentation Fund (ERAF) ... 15
(Chapters 699, 700, and 1369, Statutes of 1992, and Chapters 68, 904, 905, 906, and 1279, Statutes of 1993) ... 15
AB 1290 (Chapter 942, Statutes of 1993) ... 16
State-Local Agreements in FY 2003-04 and FY 2004-05... 16
Data ... 19 Methodology... 21 Conclusion ... 25 Works Cited……… ... 26 Appendix Mauldin
Executive Summary
The Center for Responsible Lending projects California local governments to experience a $107 billion dollar decrease in home values and taxable property rolls as a result of subprime mortgage related foreclosures [Lending, 2008]. Due to Proposition 13, property taxes do not account for a substantial portion of local government revenue1. They do, however, constitute
53%2 of statewide K-14 funding, as stipulated by Proposition 98 (Education Revenue
Augmentation Fund or ERAF). As a result of ERAF, local governments (defined as counties, cities, schools, and special districts) receive less money through a complex fund shifting process that offsets statewide general fund spending. If property tax revenues decline, the state will have to take a greater share of responsibility to fund K-14 schools [Lin, Bee Capital Bureau, 2007].
There is a major problem associated with this: The state has already proposed to cut $4 billion in education spending to offset a major $16 billion 3 budget shortfall [Lin, Emergency cuts likely today, 2008].
The goal of this research, though limited in scope and nature, was to examine the property tax revenue decline as it relates to property tax delinquency (defined as percentage of property tax levied but uncollected within a given year) in the state of California. For this research, I proposed to measure the property tax delinquency rate as property tax delinquencies serve as local government economic “fiscal health” indicators and display the “lack of ability and obstacles of short-term financial management for governments” [Denison, Yan, & Zhao, 2007]. Therefore, the property tax delinquency rates of 11 California counties were examined to see if there was a statistically significant relationship between the dependent variable—county property tax delinquency rate—and a host of independent variables under the classifications of Race, Age, and Socioeconomic Indicators. It is important to understand this relationship to gain further insight into the complexities associated with the effects of the subprime market and resulting soft-housing market on California’s local government to see if certain criteria make counties more susceptible to experiencing property tax revenue decline. This is all done with hope that if local governments are aware of these factors, then they can prepare and plan accordingly as to mitigate these effects.
Through an analysis of the variables at the 95% confidence level it was determined that
the following specific variables “median home price”, “percent of population Black or African- American”, “percent of population with Bachelor’s degree age 25+ or higher”, and “change in population” were statistically significant. In other words, it was found that higher median home values, higher black or African-American communities, or a greater change in population can increase property tax revenue decline. In contrast, the presence of educated adults age 25+ with a Bachelor’s degree or higher decreases the property tax delinquency rate by 0.088%.
1
,2 Figure Taken from “California Property Tax: An Overview Publication 29”September 2005, California State Board of Equalization www.boe.ca.gov
3
Figure taken from California Legislative Analyst Office Report, “Highlights of the 2008-09 Analysis,” Chief Analyst Elizabeth Hill http://www.lao.ca.gov/analysis_2008/highlights/pandi_highlights_022108.pdf
Background
The economic turmoil associated with the subprime market fallout and overall soft-housing market has had a direct impact on property values and local governments’ property tax rolls. Many Californians are finding it difficult to live the “American Dream” and make ends meet as is illustrated by the mounting rates of foreclosures and declines in home sales. In 2007,
“California had a total of 250,000 foreclosure filings…1.9% of California homes were in foreclosure which is nearly twice the national average of 1%” (Christie, 2008) Additionally, California’s existing home market has plummeted. Sales of existing single-family homes dropped nearly 15 percent from August through September 2007, and were down nearly 39 percent from one year earlier, according to the California Association of Realtors. (Finance, 2007)
The Center for Responsible Lending projects California local governments to experience a $107 billion dollar decrease in home values and taxable property rolls as a result [Lending, 2008]. Due to Proposition 13, property taxes do not account for a substantial portion of local
government revenue4. They do however constitute 53%5 of statewide K-14 funding as stipulated by Proposition 98 (Education Revenue Augmentation Fund or ERAF) to offset statewide
general fund spending. If the property tax revenue of local governments (here defined as counties, cities, schools, and special districts) generate declines, the state will have to take a greater share of responsibility to fund K-14 schools [Lin, Bee Capital Bureau, 2007]. The major
4
,5 Figure Taken from “California Property Tax: An Overview Publication 29”September 2005, California State Board of Equalization www.boe.ca.gov
problem associated with this is that the state has proposed to cut $4 billion in education spending in order to offset a major $16 billion 6 budget shortfall [Lin, Emergency cuts likely today, 2008].
The goal of this research, though limited in scope and nature, was to explore some of the
underlying factors that make certain counties more susceptible to property tax revenue
delinquency in the state of California. I proposed to measure property tax delinquency because property tax delinquencies serve as local government economic “fiscal health” indicators and display the “lack of ability and obstacles of short-term financial management for governments”
[Denison, Yan, & Zhao, 2007]. Therefore, the property tax delinquency rates of 11 California7
counties were examined to see if there was a statistically significant relationship between the dependent variable—county property tax delinquency rate—and a host of independent variables: “percent of population Black or African-American” and “percent of population Hispanic”(the Race variables); “ percent of population 21+” and “percent of population 65+”(the Age variables); “unemployment rate”, “annual change in population”, “median income”, “median home price”, and “educational attainment levels of population 25+”(the Socioeconomic Indicator variables). It is important to understand this relationship to gain further insight into the
complexities associated with the effects of the subprime market and resulting soft-housing market on California’s local government and to see if certain criteria make counties more susceptible to experiencing property tax revenue decline.
6
Figure taken from California Legislative Analyst Office Report, “Highlights of the 2008-09 Analysis,” Chief Analyst Elizabeth Hill http://www.lao.ca.gov/analysis_2008/highlights/pandi_highlights_022108.pdf
7
For this particular research, a comprehensive data set from 2000-2006 was only available on these 11 counties: Alameda, Contra Costa, Los Angeles, Orange, Riverside, Sacramento, San Bernardino, San Diego, San Francisco, Santa Clara, and Tulare
The Impact of Subprime Mortgages on California’s Economy
In the wake of mounting financial distress and recessionary threat looming on the
national and regional economy, everyone from Wall Street to “Main Street” is finding it difficult to make ends meet: “California’s low home affordability rate led to an unusually high use of subprime loans…The percentage of households that could afford to buy an entry-level home in California stood at 25 percent in the first quarter of 2007.” According to the Wall Street Journal, 28 percent of all subprime mortgage loans originated nationally in 2006 were in California. Over $100 billion of subprime mortgages have been originated in the state since 2005 [Finance C. C., 2007].
Figure 1 Obtained from (Finance C. C., 2007)
Subprime mortgages are a class of mortgages used by borrowers with low credit ratings. “The average subprime borrower’s credit score is 620 or below, which reflects a very poor credit history. About a fifth of all U.S. consumers have a credit rating of 620 or below,” [Finance C. C., 2007]. Borrowers with this credit score typically do not qualify for prime mortgages with lower interest rates because they have damaged credit or no credit history and are considered posing a greater risk to lending institutions. A study conducted by the Center for Responsible Lending estimated that “one out of every five subprime mortgages originated since 2006 will end in foreclosure,” [Schloemer, Li, Ernst, & Keest, 2006].Due to this inherently increased risk of default for this class of credit borrowers, interest rates are usually higher: “Normally, high interest rates would lead to higher monthly payments that would disqualify, or at least dissuade, all but the most credit-worthy home buyers…A critical component of the subprime phenomenon was the unconventional use of mortgage instruments” [Finance C. C., 2007], such as an
adjustable rate mortgage instrument.
Adjustable rate mortgages (ARM’s) typically feature an introductory period where the interest rate is relatively low and comparable to one found with a prime mortgage loan.
However, after this introductory period the mortgage typically resets to an interest rate tied to the market rate or higher. “Hundreds of billions of dollars were lent through a vast array of
adjustable rate mortgages that offered low introductory teaser rates, no money down, and
interest-only payments options. In 2006, subprime loans accounted for 20 percent of the national loan flow and 15 percent of the stock of the $8 trillion mortgage securities,” [Finance C. C., 2007].
The safety of this new financial market was totally dependent on rising home prices. The typical subprime mortgage is a “2/28” adjustable rate mortgage, which means it has an initial low 2-year fixed rate that is then adjusted based on an interest rate index and an added margin
[Finance C. C., 2007]. In many cases, borrowers were qualified for loans based on monthly payments under the initial “teaser” rate even though they likely wouldn’t qualify for, nor likely could afford, payments due when the mortgages “reset” to higher interest rates. However, it was these higher, unaffordable interest rates that attracted investors seeking high returns from
mortgage-backed securities into lending to these borrowers [Finance C. C., 2007]. The popularity of adjustable rate mortgages was based on the assumption that the borrower would not have to live with the higher payments for long. Given strong home price appreciation in the early 2000s, especially in California, it was often taken for granted that by the time interest rate resets were triggered, borrowers would qualify for a better mortgage based on their newly acquired home equity or they could sell the property and buy something else. Even if this did not work out, the lenders and investors could foreclose on properties potentially worth more than the balance of the loan. As long as home prices continued to spiral upward, subprime lending appeared to pose minimal risks to investors or borrowers [Finance C. C., 2007].
The upward home price trend displayed “double digit gains in early 2002 but slowed quickly in the second quarter of 2006.The annual rise in the median sales price of an existing single-family detached home in California’s dropped from 16.6 percent in 2005 to 6.4 percent in 2006. The median price rose only 4.1 percent during the first five months of 2007 compared to the same months of 2006,” [Finance C. C., 2007].
The decrease in price increases can be attributed to increased home inventories and increased interest rates. California’s existing single-family, unsold home inventory index rose to
10.7 months in May 2007, as calculated by the California Association of Realtors [Finance C. C., 2007]. The sluggish rate of price increase left many subprime mortgage holders with limited options to afford their mortgages as a result. At the local government level, this inability to pay mortgages is captured in the rising rates of foreclosure and increased rates of property tax
delinquency. As market researcher Robert Martinez, director of research for MarketPointe Realty Advisors, pointed out about this phenomenon, “Anyone that's not making their house payment is probably not going to make their tax payment, either," [Fox, 2008].
For 2007, the county of San Diego reported a 20% increase in delinquent tax bills, leaving the county with $143.9 million missing in property tax revenue [Fox, 2008]. A rise in property tax delinquency is often observed as interest rates rise above penalty rates, leading taxpayers to delay payments thus, in effect, using their local governments as a source of credit [Deboer & Conrad, 1988]. Under current California law, homeowners have up to 5 years to repay any delinquent property taxes before it becomes government property and moves into
foreclosure proceedings. “[The] constant tax liabilities in the face of declining abilities to pay
have led to increases in property tax delinquency,” [Conrad & DeBoer, 1988].
“Tax delinquency is defined as the percent of property taxes levied by a city and uncollected in a given year,” [Sternleib & Lake, 1976]. It is important to note that local
governments anticipate a portion of property tax revenue to be uncollectible. Uncollectible taxes measure the “lack of ability and obstacles of short-term financial management for governments,”
[Denison, Yan, & Zhao, 2007]. Normally “property tax delinquency rates are very small—on
average less than 3%,” [Deboer & Conrad, 1988]. The property tax delinquency rate is an indicator that can be used to measure the “fiscal health” of a local government. Groves determined a delinquency rate above 5% is an indication of fiscal problems [Groves, 1980].
Property Taxes in California its Role & Key Legislation
While mentioned that property taxes are not the main source of revenue for a locality, it is still a significant form of revenue for counties, cities, schools, and special districts in the State of California. The 2007 property tax roll was estimated to be worth $4.4 trillion [Walters, 2007]. Property tax revenue in California was observed to be allocated in the following manner:
Counties accounted for 18 percent, cities 11 percent, schools (school districts and community colleges) 53 percent, and special districts 18 percent [Equilization, 2005].
On January 10, 2008, Governor Schwarzenegger declared a fiscal emergency for the state
of California as it was facing a reported $16 billion 8deficit for the 2008-09 fiscal year. Due to
legislation that requires the state budget to be balanced, there will have to be reductions in spending and allocations to offset the deficit and revenue decline at the state level. According to
McNichol, states tend to cut services, such as education, or increase local taxes [McNichol &
Lav, 2008]. However, due to Proposition 13, in California caps are set that determine how much local property taxes can be raised. Both the legislature and governor have proposed cuts in education as part of their solutions to close the gap.
Under the current system, education is funded primarily by local government property tax revenue, and the difference in mandatory spending determined by Proposition 98 (ERAF) is supplemented by the state general fund. However, due to legislation that established the Education Revenue Allocation Fund (ERAF), the state is able to offset increased funding responsibility to local governments by reducing their share of property tax funds through
Mauldin
8
Figure taken from California Legislative Analyst Office Report, “Highlights of the 2008-09 Analysis,” Chief Analyst Elizabeth Hill http://www.lao.ca.gov/analysis_2008/highlights/pandi_highlights_022108.pdf
redistribution. The local government is limited in what it can do to raise funds due to
Proposition 13 and the property tax roll is projected to decline by $107 billion dollars [Lending 2008] due to increased foreclosures and reassessed home values. Essentially, the existence of Proposition 13 renders local governments unable to offset property tax revenue declines through a substantial increase in property tax rates due to the caps in place. This is why Tax Deliquency
Rates are relevant to this research: It is imperative that local governments minimize their
property tax delinquency—or uncollectible revenue—in order to maximize their revenue earning capabilities. In addition, the state’s plans to further redistribute property tax revenue away from counties, cities, and special districts to assist in funding the gap in education spending further supports why counties need to decrease their rates of uncollectible property taxes. Some of the serious implications that may occur when uncollectible/delinquent property tax rates increase, is a local governments inability to provide services such as libraries and parks, infrastructure maintenance, and a decrease in administrative services. This was seen in the 1990’s when some California local governments, such as San Diego County, experienced hiring freezes and
reductions in the services they could provide [Fox, 2008].
What will follow is a brief chronology of the events and legislation that are significant or relevant to the issues surrounding property taxation in California. It is important to have an understanding of these issues in order to fully understand the limitations that local governments face in increasing property taxes and why it is necessary to mitigate the rate of uncollectible property taxes.
Key Property Tax Legislation
Property taxes in the state of California have been the subject of controversy for as long as the state has assessed taxes. Before Proposition 13 passed in 1978, property taxes could increase dramatically from year to year based on the assessed value of the home. During the seventies, the real estate market experienced dramatic growth and the values of homes increased substantially [Data, 2002]. Because assessors were required to keep assessed values current, property taxes increased at a substantial rate. However, increases in the assessed value of the home were not made every year, thus resulting in a major tax increase for homeowners every few years. Proposition 13 was introduced as a way to provide effective tax relief and protect taxpayers from unanticipated increases in property taxes.
The passage of Proposition 13 introduced a 1% cap that restricts the amount to be paid in property taxes at 1% of the assessed value of the home. The assessed value of homes cannot exceed the 1975-76 assessed value and can increase based on the Consumer Price Index (CPI) by no more than 2% per year. If a transfer of ownership takes place or improvements are made, the property then becomes subject to a reassessment at the current market value. The newly assessed value will then increase on a yearly basis not to exceed 2% per year. For FY 1977-78, statewide property tax revenues totaled $10.3 billion and represented 57% of combined city and county general-purpose revenues [Chiang, 2007]. Proposition 13 reduced property taxes by $7 billion in the first year of its implementation [Chiang, 2007].
The decrease in property taxes as a gross percentage of the assessed value of homes has forced local agencies (cities, counties, and other special districts) to find other sources of funding [Data, 2002].
Immediately after the passage of Proposition 13, the State enacted numerous statutes to implement it and to provide state relief to mitigate the impact of the reduction in property tax
revenues on local governments. Over the years, additional measures were adopted to refine the system and to address State budget shortfalls through various fund shifts. Approval by the voters of Proposition 98 in 1988, which set a minimum annual funding level for K-12 school districts and community colleges, also significantly affected the way property tax revenues are allocated among the local entities.
SB 154 (Chapter 292, Statutes of 1978)9
SB 154 was enacted immediately after Proposition 13’s passage to provide direction over how the 1% property tax revenue was to be allocated among all local governments and provide for the distribution of State assistance to make up, in part, for local property tax losses.
AB 8 (Chapter 282, Statutes of 1979)10
AB 8 prescribed the methodology for a one-time adjustment that would permanently establish the property tax base for each local agency for distribution of state assistance and growth in assessed valuation. The statute also prescribed the methodology for redistributing property tax revenues resulting from changes in jurisdictional boundaries and/or services.
Proposition 98i
Proposition 98 establishes a minimum annual funding level for K-12 school districts and community colleges. The goal of Proposition 98 is to provide schools with a guaranteed funding level that grows each year with the economy and the number of students. The guaranteed funding is provided through a combination of state general fund and local property tax revenues. For K-12 school districts, if available property tax revenues are insufficient to meet the minimum annual funding level, state law provides for a continuous appropriation from the general fund to backfill any shortfall. For the community colleges, legislative action is needed to appropriate 9
This portion can be found in the Distribution of Property Tax Revenue Review November 2007, John Chiang Controller’s Report (Chiang, 2007)
10
The following portion of legislation information can be found in the Distribution of Property Tax Revenue Review November 2007, John Chiang Controller’s Report (Chiang, 2007)
funding for any shortfall. Proposition 98 originally mandated funding at the greater of two calculations or tests (Test 1 or Test 2). In 1990, Proposition 111 was adopted to allow for a third funding test in low-revenue years (Test 3). Test 3 was designed so that education is treated no worse in low-revenue years than other segments of the State budget. In years following a Test 3 year, the State is required to return school funding to the long-term Test 1 or Test 2 level, using a mechanism referred to as the “maintenance factor.”
Creation of the Educational Revenue Augmentation Fund (ERAF)11
(Chapters 699, 700, and 1369, Statutes of 1992, and Chapters 68, 904, 905, 906, and 1279, Statutes of 1993)
In FY 1992-93 and FY 1993-94, the state permanently shifted $3.6 billion of property tax revenues from counties, cities, and special districts to the newly created Education Revenue Augmentation Fund (ERAF) to fund the schools. The shifts are commonly referred to as ERAF I and ERAF II. The ERAF also receives its share of each year’s annual tax increment growth based on growth in assessed value. The state general fund benefits from this funding shift because California schools are guaranteed a minimum amount of funding under Proposition 98. For example, if a school district is identified as being “basic aid”, then it is not entitled to any State funding because its guaranteed minimum funding is fully met with local property tax revenues. As a result of ERAF legislation since 1992, over $65 billion dollars has been redirected to schools from local government property tax revenue funds [Coleman, 2006].
To the extent that property tax revenues do not meet the minimum requirement, the state must fund the difference from its general fund revenues. Therefore, when property tax revenues
11
The following portion of legislation information can be found in the Distribution of Property Tax Revenue Review November 2007, John Chiang Controller’s Report (Chiang, 2007)
are redirected from counties, cities, and special districts to fund schools, the state’s obligation to schools is generally reduced.
AB 1290 (Chapter 942, Statutes of 1993) 12
The State enacted the Community Redevelopment Law Reform Act of1993 (AB 1290),
which requires redevelopment agencies to return aportion of their tax revenues to affected taxing
jurisdictions in the formof a mandatory “pass-through” funds for redevelopment projects
adoptedor amended on or after January 1, 1994. Prior to January 1, 1994, taxingjurisdictions
could either negotiate pass-through payments with aredevelopment agency or elect to receive
the annual inflationary increases in assessed valuation (up to 2%) before a project is adopted.
For redevelopment projects adopted before January 1, 1994, the pass-throughfunds have no
effect on the State’s obligation to schools.
AnAttorney General opinion, dated October 25, 1990, states that pass-through agreement
payments do not constitute an allocation of property tax revenue because the redevelopment
agency revenues arecollected under the Health and Safety Code rather than the Revenue and
Taxation Code. For projects adopted or amended on or after January 1, 1994, the amount of pass-through funds redirected from the redevelopment agencies to the schools counts in satisfaction of
theState’s funding obligation to schools. This is because of a provision of AB 1290 that
specifies that a portion of such funds are to be used for calculation of the schools’ revenue limits.
StateLocal Agreements in FY 200304 and FY 20040513
In FY 2003-04 and FY 2004-05, the State reached agreements with the local governments in a series of financial arrangements, some of which involved complex fund shifts or fund
12
The following portion of legislation information can be found in the Distribution of Property Tax Revenue Review November 2007, John Chiang Controller’s Report (Chiang, 2007)
13
The following portion of legislation information can be found in the Distribution of Property Tax Revenue Review November 2007, John Chiang Controller’s Report (Chiang, 2007)
transfers. Following are the state local financial arrangements that are relevant to the issues identified in this report. Triple Flip (Chapters 211 and 610, Statutes of 2004) The Triple Flip was a funding mechanism devised to free up an existing revenue stream and establish a dedicated funding source to pay for the deficit-financing, or economic recovery, bonds authorized by the voters in 2004. The Triple Flip allowed the State to provide a funding stream for repayment of the loans without raising the overall level of taxes. Ultimately, the state General Fund pays for the bond repayments.
The Triple Flip entailed the following financial transactions:
1. Flip 1: A ¼-cent reduction in the city and county share of the local sales tax with the
simultaneous establishment of a new ¼-cent state sales tax dedicated to deficit-bond repayments. 2. Flip 2: A shift of property taxes from the support of schools to cities and counties to offset their sales tax loss.
3. Flip 3: The state General Fund is to backfill the property tax revenues diverted from K-12 school districts and community colleges.
Review of Distribution and Reporting of Local Property Tax Revenues Property Tax Allocation Program
Vehicle License Fee (VLF) Swap (Chapters 211 and 610, Statutes of 2004) The Budget Act of 2004 prescribed a “swap” of city and county Vehicle License Fee (VLF) revenues for property tax revenues, effective for FY 2004-05. Beginning in 1999, the VLF rate for taxpayers was reduced from 2% to 0.65%. The Legislature authorized appropriations from the General Fund to make up for the reduction in VLF revenues to the local governments. During budget negotiations on the 2004-05 Budget, the State and local governments agreed to the VLF Swap, which
consisted of the following:
1. Reduction of the VLF rate from 2% to 0.65%.
2. Replacement of reduced VLF revenues by a shift of school district and community college property tax revenues beginning with each county’s ERAF, thus providing the local governments with a stable funding source.
3. If the ERAF contains insufficient funds, a shift of the AB 8 allocation of property tax revenues from non-basic aid K-12 school districts and community colleges to local governments. A “non-basic aid” school district receives State funding when its property tax revenue is insufficient to meet the guaranteed minimum funding level. A “basic aid” school district is a district that is not entitled to any State funding because its guaranteed minimum funding is fully met with local property tax revenues.
4. Backfill by the state General Fund of the property tax revenues diverted from K-12 school districts and community colleges.
The State enacted SB 1096 (Chapter 211, Statutes of 2004) to accomplish the objectives listed above. In the November 2004 election, voters approved Proposition 1A, which set the VLF rate at 0.65% as a revenue source for counties and cities.
ERAF III (Chapters 211 and 610, Statutes of 2004)
In 2004, the State reached an agreement with counties, cities, redevelopment agencies, and special districts in which the local governments agreed to contribute an additional $1.3 billion per year in FY 2004-05 and FY 2005-06 into the ERAF, an agreement commonly referred to as ERAF III. In exchange, Proposition 1A was placed on the November 2004 ballot by the
Legislature to protect local revenues from additional reallocations. The voters approved the proposition. Although Proposition 1A was passed, ultimately, it would fail to provide additional
sources of revenue or funding for local governments, nor would it reduce previous ERAF I and II legislation (Coleman, 2006).
ERAF III shifts ended in FY 2006-2007. The total annual impact of all ERAF shifts of revenue away from counties, cities, and special districts, for FY 2006-2007 was estimated to be $6.7 billion (Coleman, 2006.) In light of the recent announcement of education spending cuts at the state level, local governments have an even greater impetus to reduce the rate of uncollectible property taxes and assume a proactive approach in understanding what factors may leave their communities at a greater risk for property tax revenue decline. In an effort, to prepare for the future events that may arise as local governments may be expected to shift funds back into ERAF, to offset the state general fund spending cuts.
Data
Annual data on current year secured property tax revenue collection from 1993-2007 was collected from the California State Controller’s Office:
http://www.sco.ca.gov/col/taxinfo/tcs/index.shtml. It is important to note that only the secured property tax roll was used.14
The demographic information for this research was obtained from U.S. Census Data, American Community Surveys annual and multi-year information from 2000-2006. Due to limitations in obtaining comprehensive American Community Survey information for all 58 California Counties the data set includes 77 observations from 2000-2006 of the following 11 counties: Alameda, Contra Costa, Los Angeles, Orange, Riverside, Sacramento, San Bernardino, San Diego, San Francisco, Santa Clara, and Tulare.
These 11 counties account for 74% of the state’s property tax base 2000-2006.
Mauldin
14The term "Secured" simply means taxes that are assessed against real property, (e.g., land or structures). vs.
Chart 1
They account for $179,884,865,658 of the total $ 243,480,478,713 property tax charges issued.
Furthermore, the total population estimate within these counties is 27,241,934 of the total California population of 37,662, 518. These 11 counties are among the most populous and diverse within the state. It is important to note this because the variables represented in this analysis are most reflective of the greater macroeconomic conditions associated with property tax delinquency rate in contrast to microeconomic factors that may weigh heavier on the
variables as in smaller communities. Based on this information one can assume that the data and variables obtained for this analysis are fairly comprehensive and will provide a fair and
meaningful representation for these counties.
Chart 2. Data obtained from American Community Survey, US Census
Total California Population 2007 Estimate
72% 28% 11 Counties 58 Counties
Methodology
The property tax delinquency rate was selected as an indicator because it is likely to vary with macroeconomic conditions [Deboer & Conrad, 1988] and is positively correlated with an increase in foreclosure [Sternleib & Lake, 1976]. To determine the percentage of property tax revenue uncollectible which served as the property tax rate of delinquency, the actual percentage of revenues collected provided in the table was subtracted from 100. The resulting difference elicited the percentage of property tax uncollected.
The goal of this analysis was to determine if there was a statistically significant
relationship between the dependent variable—percentage of property tax uncollected—and the following independent variables: “percent of population Black or African-American only,” “percent of population Hispanic,” “unemployment rate,” “annual percent change in population,” “median household income,” “median home price,” “Educational Attainment levels of
population 25+ (percent high school graduates or higher),” and the “percent Bachelor’s degree or higher”. This information was obtained for each of the 11 counties from the American Community Surveys & US Census Data for 2000-2006. The information was then put into an
Excel spreadsheet and sorted alphabetically by county and listed in descending order by year from 2006-2000. For each of the independent variables a prediction (increase or decrease) was made about their projected affects on the percentage of tax revenue that is uncollectible
(Appendix III). The data was then imported into STATA IC 10 into the Data Editor and loaded for the following analysis.
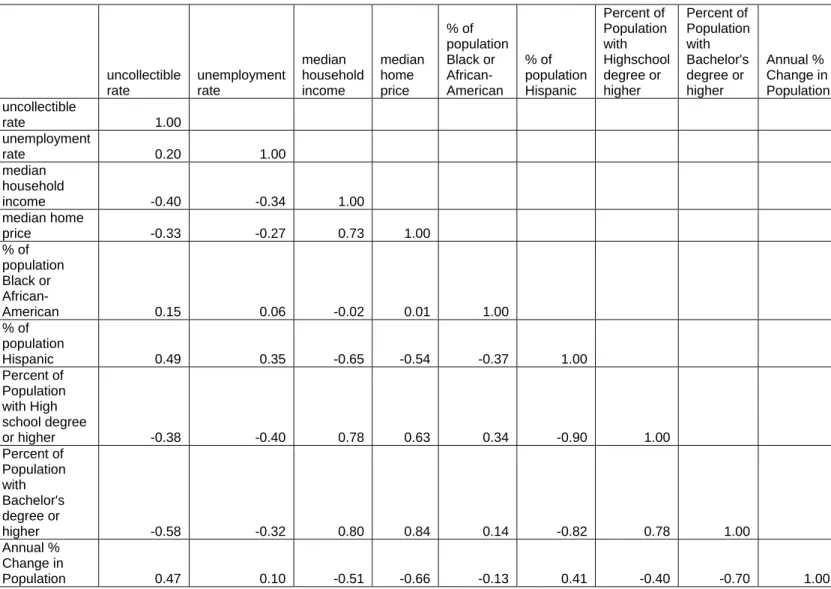
The first analysis performed on the data was a correlation study to verify and confirm that correlations among variables made sense.15 A variable was determined to be correlated if it elicited an absolute value of greater than 0. The following items were positively correlated: “Median household income” was positively correlated to “median home price”, “percent high school graduates or higher”, and “percent Bachelor’s degree or higher”. “Median home price” was positively correlated to “percent Bachelor’s degree or higher”. The “percent Bachelor’s degree or higher” was positively correlated with “change in population”.
These correlations confirm the following ideas: As income increases, the amount of home one can afford also increases. In addition, it is widely known that those with more education tend to make more in their lifetime on average than those without an educational degree. It also supports the idea that the state of California tends to attract a growing population of college degree holders.
The following variables were negatively correlated: The “percent Hispanic population” was negatively correlated with “percent of high school graduates or higher” and “percent Bachelor’s degree or higher”. This was rather interesting as it suggests that the Hispanic population age 25+ is less likely to obtain formal education degrees (high school diplomas or Bachelor’s degrees).
15
After this step, a simple linear regression model was performed on the data, as well as a general statistical information summary. This information can be seen below.
Table 1 Linear Regression of Uncollectible Property Taxes
Dependent
Uncollectible Coefficient Std. Err. t P>t Independent
Variable
Rate of
unemployment -0.00021 0.056927 0 0.997 Median Household
Income 1.94E-05 1.55E-05 1.25 0.214 Median Home Price 3.56E-06 1.07E-06 3.32 0.001 % of Population Black or African 0.117606 0.030652 3.84 0 % of Population Hispanic 0.008306 0.022549 0.37 0.714 Percent of Population with High School Degree
or higher -0.02655 0.041638 -0.64 0.526 Percent of Population with Bachelor’s Degree or Higher -0.0878 0.028849 -3.04 0.003 Annual % Change in Population 0.296682 0.131044 2.26 0.027
Table 2 Statistical analysis of both the dependent and independent variables
Variable Obs Mean Std. Dev. Min Max
uncollectible 77 2.21039 1.067099 0.35 6.14 Rate of unemployment 77 7.255844 1.717594 3.9 11.1 Median Household Income 77 56636.05 12466.78 33647 85978 Median Home Price 77 386118.8 182585 104859 806700 % of Population Black or African 77 6.568961 3.675179 1.1 14.3 % of Population Hispanic 77 30.97312 12.65331 13.75 55.83 Percent of Population with High School Degree or higher 77 80.39156 6.805481 62 89.8 Mauldin
Percent of Population with Bachelor’s Degree or Higher 77 30.53117 11.03992 10.5 51 Annual % Change in Population 77 1.638961 1.073538 0.18 4.75
To determine if the variables were statistically significant at the 95% confidence level, an analysis was performed. The data values ranged from -∞ to -∞ or ∞ to ∞. If they excluded 0 it was determined to be statistically significant at the 95% confidence level. If the values ranged from -∞ to ∞ including 0, it was determined to be statistically insignificant at the 95%
confidence level.
R
ESULTSThrough an analysis of the variables it was determined that the following variables were statistically significant: “median household ”, “percent of population Black or
African-American”, “percent Bachelor’s degree or higher”, “change in population”. Out of all 8 variables it is interesting to note that these were the only ones which proved to be statistically significant at the 95% confidence level. From the regression it is interesting to see that the only variable to promote a decline in the property tax delinquency rate is percentage of population holding a Bachelor’s degree or higher. For every 1% of uncollectible or delinquent tax revenue, the presence of a population with a Bachelor’s degree or higher decreases it by -0.09%. What can be inferred from the data is that in counties with a higher presence of the population with
Bachelor’s degree or higher there should be lower rates of property tax delinquency.
In contrast the following variables increase property tax delinquency rate: “median home price”, “percent of population Black or African-American”, and “change in population”. These increase delinquency by 0.036% (for every $100,000), 0.12%, and 0.30%, respectively. The coefficient for the “median home price” was relatively small at 3.56E-06. To make it more
relevant, this number was multiplied by $100,000. For every $100,000 increase in median home value in a county the property tax delinquency rate increases by 0.036%.
In an examination of race and its effects on the property tax delinquency rate, the only variable that was statistically significant was Black or African-American. It was found that for every 1% of Black or African American population within a county the property tax delinquency rate increases by 0.12%. This incidence can partially be explained by historical factors such as the prevalence of lower incomes and poor credit history. As a result many blacks were limited to subprime mortgages for financing their homes. For many Blacks or African Americans who live in “low-income, minority areas” with limited “credit history, they pay more interest on
mortgages,” [Tedeschi, 2007]. According to data from the Federal Reserve, “55% of blacks who took out purchase mortgages in 2005 got higher-cost loans, compared with about 17% of whites and Asians,” [Kirchoff & Keen, 2007]. As these “higher-cost” subprime loans reset many blacks or African-Americans are unable to afford their mortgage payments, and consequently this leads to higher rates of property tax delinquency. According to a study done by Deboer & Conrad in 1988, people may utilize the local government as a form of credit by forgoing payments on property tax. This may have very well been the case in counties or communities with a higher black or African-American presence
The last variable to be statistically significant was the change in population. For every 1% increase in annual population change the property tax delinquency rate increases by 0.30%. This result was unexpected due to the historic correlation between population and economic activity. As population increases usually economic activity and vitality are present thus leading to a broader property tax base. Currently, no speculation can be made to interpret the meaning of this result.
Conclusion
In conclusion, the goal of this research, though limited in scope and nature, was to examine the property tax revenue decline, in relation to property tax delinquency, in the state of California. Therefore the property tax delinquency rate of 11 California counties was examined to see if there was a statistically significant relationship between the county property tax
delinquency rate and a host of independent variables that can be classified under Race, Age, and Socioeconomic Indicators.
Through regression, it was determined that the following variables were statistically significant: “median home price”, “percent of population Black or African-American”, “percent Bachelor’s degree or higher”, and “change in population”. It was found that higher median home prices, higher black or African-American communities, or a greater change in population can increase property tax revenue decline. However, in contrast the presence of educated adults age 25+ with a Bachelor’s degree or higher decreases the property tax delinquency rate by 0.088%.
It is important to understand these relationships, as the state of California faces a $16
billion budget deficit and may look to local governments to support more of the educational funding. For future research, it would be interesting to look at property tax roll and minorities as it relates to equity in order to gain further insight into the complexities associated with the effects of the subprime mortgage market on minority populations within communities.
Works Cited
Chiang, J. (2007). Distribution and Reporting of Local Property Tax Revenue Review Report Property Tax Allocation Program. Sacramento: California State Controller.
Christie, L. (2008, January 29). Real Estate Mortgage Meltdown. Retrieved March 10, 2008, from
CNNMoney.com: http://money.cnn.com/2008/01/29/real_estate/foreclosure_filings_2007/
Coleman,M. (2006). Fact Sheet: The ERAF Property Tax Shift. Retrieved April 16, 2008, from League of California Cities: http://www.ci.covina.ca.us/news/ERAF_facts.pdf
Conrad, J., & DeBoer, L. (1988). Rural Property Tax Delinquency and Recession in Agriculture. American Journal of Agricultural Economics Vol.70, No.3. , 553-559.
Data, C. T. (2002). History of Taxation. Retrieved March 10, 2008, from California Tax Data: http://www.californiataxdata.com
Deboer, L., & Conrad, J. (1988). Do High Interest Rates Encourage Propety Tax Delinquency? National Tax Journal , 555-560.
Denison, D., Yan, W., & Zhao, Z. (. (2007). Is Management Performance a Factor in Municpal Bond Credit Ratings? The Case of Texas School Districts. Public Finance & Budgeting , 86-98.
Equilization, C. S. (2005, September). California Property Tax an Overview. Retrieved March 10, 2008, from Boad of Equilization: http://www.boe.ca.gov
Finance, C. C. (2007). California Economic Indicators: Real Estate Woes Persist. Sacramento: California Department of Finance.
Finance, C. D. (2007). California Economic Indicators: Disappointing Real Estate News. Sacramento: Department of Finance.
Fox, Z. (2008, January 25). Property Tax Delinquencies Rise: North County Times. Retrieved March 30, 2008, from North County Times:
http://www.nctimes.com/articles/2008/01/26/news/top_stories/22_36_591_25_08.txt
Groves, S. (1980). "Financial Trend Monitoring System" Handbook 2 of Evaluation of Local Government Financial Condition. Washington, D.C.: International City Management Association.
Kirchoff, S., & Keen, J. (2007, April 26). In 2005, half of minorities purchased their homes with subprime loans Today, delinquency rate are soaring in minority neighborhoods; Across the USA, the same story: 'I got into a bad deal'. USA Today , p. 1B.
Lending), C. (. (2008, February 22). The Impact of Court Supervised Modifications on Subprime Foreclosures. Retrieved March 10, 2008, from Center for Responsible Lending:
http://www.responsiblelending.org/
Lin, J. (2007, October 10). Bee Capital Bureau. Retrieved March 10, 2008, from Sacramento Bee: http://www.sacbee.com/111/story/424058.html
Lin, J. (2008, February 15). Emergency cuts likely today. Retrieved April 1, 2008, from Sacramento Bee: http://www.sacbee.com/capolitics/story/714631.html
McNichol, E. C., & Lav, I. J. (2008). 20 STATES FACE TOTAL BUDGET SHORTFALL OF AT LEAST $34 Billion in 2009; 8 Others Expect Budget Problems. Washington D.C.: Center on Budget & Policy Priorities.
Schloemer, E., Li, W., Ernst, K., & Keest, K. (2006, December). Losing Ground Foreclosures in the Subprime Market and Their Cost to Homeowners. Retrieved April 1, 2008, from Center for Responsible Lending: http://www.responsiblelending.org/pdfs/foreclosure-paper-report-2-17.pdf
Sternleib, G., & Lake, R. W. (1976). THE DYNAMICS OF REAL ESTATE TAX DELINQUENCY. National Tax Journal , 261-271.
Tedeschi, B. (2007, February 25). New Help for Subprime Mortgages. The New York Times , p. 12. Walters, D. (2007, August 27). Capitol Alert. Retrieved April 1, 28, from Sacramento Bee:
http://www.sacbee.com/772/v-print/story/346979.html
Appendix
Appendix I Correlation Table by Variable Appendix II County Profiles
Appendix III Independent Variable Predictions
Appendix I Correlation Table by Variable
Table 3. Correlation Statistics of Uncollectible Rate and Independent Variables
Percent of Population with Highschool degree or higher Percent of Population with Bachelor's degree or higher % of population Black or African-American median household income median home price % of population Hispanic Annual % Change in Population uncollectible rate unemployment rate uncollectible rate 1.00 unemployment rate 0.20 1.00 median household income -0.40 -0.34 1.00 median home price -0.33 -0.27 0.73 1.00 % of population Black or African-American 0.15 0.06 -0.02 0.01 1.00 % of population Hispanic 0.49 0.35 -0.65 -0.54 -0.37 1.00 Percent of Population with High school degree or higher -0.38 -0.40 0.78 0.63 0.34 -0.90 1.00 Percent of Population with Bachelor's degree or higher -0.58 -0.32 0.80 0.84 0.14 -0.82 0.78 1.00 Annual % Change in Population 0.47 0.10 -0.51 -0.66 -0.13 0.41 -0.40 -0.70 1.00
Appendix II County Profiles
Table 4. Educational Attainment by Percentages by County (Population, Age 25+)
Percent high school graduate or higher Percent bachelor's degree or higher High school graduate (includes equivalency) Graduate or professional degree Associate's degree Bachelor's degree County Alameda 20.03 6.74 23.16 15.36 84.76 38.50 Contra Costa 19.94 7.47 23.52 14.33 86.49 37.85 Los Angeles 20.84 6.42 17.89 9.23 73.39 27.14 Orange 17.79 7.88 22.05 11.29 80.89 33.36 Riverside 27.28 7.35 11.95 6.72 78.59 18.70 Sacramento 22.98 8.67 18.75 8.64 84.59 27.36 San Bernardino 27.13 7.92 11.05 6.04 75.71 17.11 San Diego 19.10 7.50 19.58 12.25 83.06 31.83 San Francisco 14.39 5.73 30.83 18.22 84.60 49.06 Santa Clara 16.94 7.68 25.44 18.12 85.81 43.56 Tulare 24.82 6.76 8.34 3.78 64.46 12.11
Table 5. Economic Indicators by County
Mean household income (dollars) Median household income (dollars) Median Home Value (dollars) Unemployment Rate County Alameda 7.61 62008.57 79738.57 477426.57 Contra Costa 7.26 66681.30 86480.84 464670.84
Los Angeles 7.76 46677.57 66574.14 357141.00 Orange 5.30 63848.57 84460.86 454199.43 Riverside 7.31 48365.14 63096.57 250979.57 Sacramento 7.39 50572.29 62668.29 259822.57 San Bernardino 8.16 47220.57 59437.00 223337.86 San Diego 5.30 53157.43 69747.57 398684.00 San Francisco 7.04 61530.43 86891.00 632873.57 Santa Clara 7.37 80333.71 101735.71 598985.14 Tulare 9.71 37260.71 49921.71 143764.00
Table 6 Social Indicators by County
%Non‐ Family Household Single Average household size Average family size Median age (years) %21 Years and Over %65 Years & Over % of Family Households County Alameda 35.43 71.26 10.04 63.97 36.03 2.76 3.44 Contra Costa 36.10 70.74 10.46 66.77 33.23 2.78 3.40 Los Angeles 32.89 67.95 9.64 67.42 32.58 3.05 3.75 Orange 34.23 69.09 9.98 70.46 29.54 3.03 3.59 Mauldin
Riverside 32.39 66.18 11.84 73.55 26.45 3.02 3.53 Sacramento 33.60 68.25 10.65 65.24 34.76 2.70 3.33 San Bernardino 30.29 63.53 8.21 75.71 24.29 3.25 3.73 San Diego 33.96 69.00 14.27 65.64 34.36 2.75 3.38 San Francisco 38.27 82.76 14.10 44.58 55.42 2.28 3.22 Santa Clara 35.36 71.34 9.85 69.88 30.12 2.92 3.47 Tulare 28.71 61.76 9.19 78.14 21.86 3.33 3.75
Table 7. Race & Ethnicity by County
% Hispanic or Latino (of any race) %Black or African American ONLY %Asian ONLY %White ONLY County Alameda 41.37 13.41 22.92 20.32 Contra Costa 47.72 11.33 18.00 20.18 Los Angeles 29.89 8.88 12.40 46.63 Orange 48.98 1.44 14.86 32.16 Riverside 47.73 5.60 4.17 39.28 Sacramento 55.06 9.76 12.57 17.77 San Bernardino 40.38 8.62 5.03 42.98 San Diego 53.04 5.14 9.66 28.91 San Francisco 43.53 6.68 32.24 14.04 Santa Clara 41.34 2.40 28.35 24.73 Tulare 39.38 1.37 3.32 53.88
Appendix III Variable Predictions
Predicted Outcome on Delinquency Rate Statistically Significant? Independent Variable (% Uncollectible)
↓ Yes, increased
property tax delinquency rate. %Change in Population As population increases I would predict the
property tax roll & base to increase. Signs of economic growth in a community are often mirrored by an increase in population. In contrast supporting an decrease in uncollectible
↑
Unemployment Rate An increase in unemployment will increase % Uncollectible.
No
↑ No
%21 Years and Over An increase in population 21 years to 64 years would increase the rate of
Uncollectible due to most subprime mortgage holders being 1st time homeowners with little credit history.
↓ No
%65 Years & Over I predicted that if there was a higher population of population that was historically more stable and current homeowners then the rate of uncollectible would decline.
Race
↓ No
%White only I would predict a decrease in the
delinquency rate. Historically, Caucasians tend to make more income than other ethnicities & minorities.
↑ Yes, increased
property tax delinquency rate %Black or African American I would predict an increase in the
delinquency rate. Tend to make less in income than counterparts. In addition the low home affordability rate in California may have increased this demographics use of subprime loans to aide in first time home ownership.
↓ No
%Asian I would predict a decrease in the delinquency rate. Of all minorities most equivalent to Caucasians in income and education level.
↑ No
Hispanic or Latino (of any race)
I would predict an increase in the delinquency rate. Tend to make less in income than counterparts. In addition the low home affordability rate in California may have increased this demographics use of subprime loans to aide in first time home ownership.
Social Measure
↓ No
% of Family Households I would predict the rate of delinquency to go down. Perhaps greater vested interest in community due to property tax revenue providing a large portion of school funding.
↑ No
%NonFamily Households Single
I would predict a greater rate of property tax delinquency due to the role of speculative investors in California's housing market‐tend to be non family households.
Educational Attainment
↑ No
Less than 9th grade Due to less education tend to make less income, less likely to be homeowners and if they are would be considered in the low‐ income bracket with little credit history.
↑ No
9th to 12th grade, no diploma
Due to less education tend to make less income, less likely to be homeowners and if they are would be considered in the low‐ income bracket with little credit history.
↑ No
High school graduate (includes equivalency)
Although they are a high school graduate the population in this bracket makes significantly less in income then
counterparts with college experience. Due to the correlation between income and
education this demographic is less likely to be homeowners. If they are would be considered in the low‐income bracket.
↑
Some college, no degree Due to less education tend to make less income than counterparts, with college degrees.
No
↓ No
Associate's degree Would expect delinquency rate to decrease. Degree attainment signifies greater sense of responsibility perhaps more likely to pay property taxes, in addition to increase income.
↓ Would expect delinquency rate to decrease.
Degree attainment signifies greater sense of
responsibility perhaps more likely to pay
property taxes, in addition to increase income.
Bachelor's degree No
↓ No
Graduate or professional degree
Would expect delinquency rate to decrease. Degree attainment signifies greater sense of responsibility perhaps more likely to pay property taxes, in addition to increase income.
↓ No
Percent high school graduate or higher
The greater the population of a community illustrates education attainment increases the likelihood of property tax revenue payment.
↓ Yes, decreased
property tax delinquency rate. Percent bachelor's degree
or higher
The greater the population of a community illustrates education attainment increases the likelihood of property tax revenue payment.
Economic
↓
Median Income As median income increases I would expect a decrease in % uncollectible No Yes, increased property tax delinquency rate Median Home Price ↑ As median home price increases I would
expect an increase in uncollectible. This is due to the low home affordability rate in California