1
An Introductory Approach to
Risk Visualization as a Service
Victor Chang
A, BA School of Computing, Creative Technologies and Engineering, Leeds Metropolitan University,
Headingley, Leeds LS6 3QR, UK, V.I.Chang@leedsmet.ac.uk
B Electronics and Computer Science, University of Southampton, ESS Group, Level 4, Building 53,
University Road, Southampton SO17 1 BJ, UK, vic1e09@ecs.soton.ac.uk
A
BSTRACTThis paper introduces the Risk Visualization as a Service (RVaaS) and presents the motivation, rationale, methodology, Cloud APIs used, operations and examples of using RVaaS. Risks can be calculated within seconds and presented in the form of Visualization to ensure that unexploited areas are ex-posed. RVaaS operates in two phases. The first phase includes the risk modeling in Black Scholes Model (BSM), creating 3D Visualization and Analysis. The second phase consists of calculating key derivatives such as Delta and Theta for financial modeling. Risks presented in visualization allow the potential investors and stakeholders to keep track of the status of risk with regard to time, prices and volatility. Our approach can improve accuracy and performance. Results in experiments show that RVaaS can perform up to 500,000 simulations and complete all simulations within 24 seconds for time steps of up to 50. We also introduce financial stock market analysis (FSMA) that can fully blend with RVaaS and demonstrate two examples that can help investors make better decision based on the pricing and market volatility information. RVaaS provides a structured way to deploy low cost, high quality risk assessment and support real-time calculations.
T
YPE OFP
APER ANDK
EYWORDSShort communication: Risk Visualization as a Service (RVaaS), Black Scholes Model, Delta and Theta in financial computing, 3D risk modeling, financial stock market analysis, special issue from the first international workshop on Emerging Software as a Service
1 I
NTRODUCTIONRisk analysis is useful to help organizations to understand the extent of business and operational risks, which can vary from time to time. According to Lord Turner, Chair of the Financial Service Authority (FSA) UK, the problem was that the banks' mathematical models assumed a ‘normal’ or ‘Gaussian’ distribution of events. Although this reduces computational effort, it can seriously underestimate the real risk [7], [9]. More recently,
debt problems in the US and Euro Zone have triggered a further downturn. A study by Hamnett [8] concluded that unsustainable mortgage lending leading to a housing bubble and subsequent collapse was the cause of the Global economic down-turn; certainly the collapse of Lehman Brothers [6] which triggered the global financial crisis was the result of irresponsible mortgage lending. Another reason for global financial crisis is the over-reliance of using Gaussian copula, which simplified the complex derivative modeling and had
Open Access
Open Journal of Cloud Computing (OJCC)
Volume 1, Issue 1, 2014
www.ronpub.com/ojcc ISSN 2199-1987
2
the tendency of underestimating the risk [4], [11]. Some researchers believe that it was the greed of the bankers who misused the model and led into financial crisis [11]. Nevertheless, all these factors contribute to the financial crisis. A more accurate and reliable model should be deployed. Performance is important to ensure that all results can be calculated within seconds, so that investors and stakeholders can get sufficient time to make the right decision of their investment. Cloud Computing offers a solution to deal with challenges in risk analysis and financial modelling, improving accuracy of risk analysis and offering distributed high-performing resources required to perform extensive and detailed investigation [3]. Cloud Computing enables the use of Monte Carlo Methods [2] and Black Scholes Models [1] to present results in a form which experts from finance and computing can study, review and recommend. However, there are few services in the market. Although there was an EU-funded project, BEInGRID [13], it does not offer full details about recommendations of resolving accuracy, reliability and performance in computational finance.
We present a case of Risk Visualization as a Service (RVaaS), which uses Cloud Computing to analyze risk and make risk visible. RVaaS is a Cloud based Software as a Service (SaaS) based on Mathematica and MATLAB designed to improve the accuracy and quality of both pricing and risk analysis in financial markets, compared with traditional desktop technologies. This allows investors to identify the status of risks in associations of changes in prices, market confidence and implied volatility. RVaaS has a two stage service in which the stages address the following challenges:
1. Performing a sufficiently high number of
simulations in an acceptable time.
2. Quantifying risks and assisting with analysis by
providing clear presentations of results.
The structure of this paper is as follows. Section 2 introduces RVaaS, which includes Black Scholes, Delta and Theta, the commonly used derivatives in financial computing. Section 3 describes a full use case scenario to explain how the command-line-like APIs, Black Scholes, Delta and Theta, can be used. Section 4 presents experiments of running RVaaS services. Section 5 illustrates financial analysis and Section 6 sums up Conclusion.
2
R
ISKV
ISUALIZATION ASA
S
ERVICEBetter ways to identify risks, rectify errors and perform accurate and fast simulations are highly desirable. Requirements for the RVaaS include the followings:
1. Based on the reputable models – Our RVaaS adopts reputable models including Black-Scholes-Merton (known as Black Scholes Model, BSM) to run exhaustive cases and compute the best pricing and risks for different scenarios.
2. Identification and visualization of risks –BSM is used to identify risks and can make risks to be in visualized formats to expose risks and understand its extent of impacts of implied volatility.
3. High-performance simulations – Our RVaaS should not allow simplicity as the expense of the accuracy due to the use of Gaussian Copula on desktop [4]. Our RVaaS should complete all simulations and derivative calculations with a quick time.
2.1 Black Scholes in theory and practice
The BSM is commonly used in financial markets and derivative calculations. It is also an extension from Brownian motion. BSM has been extensively used in financial modelling and optimisation. Our previous work [3] has demonstrated applications running on Clouds for risk analysis, and has explained how to achieve risk computation and 3D analytics. With regard to the BSM, it calculates call and put prices of European options (a financial model) [9].
The value of a call option for the BSM is ( ) ( ) ( ) ( ) (1) where ( ) ( )( ) √ and √ .
The price for the put option is
( ) ( ) ( ( ) ( ) ( ))
3 For both formulas [6],
( ) is the cumulative distribution function of the standard normal distribution
is the time to maturity
is the spot price of the underlying asset
is the strike price
is the risk free rate
is the volatility in the log-returns of the underlying asset.
BSM is used as a command-line API. It means users can type in the key figures in the command which compute the numerical values for prices and risk. Mathematica is used to support calculations of derivatives in the Cloud. Both BSM and auxiliary functions (delta and theta compute derivatives) take the same five variables as follows.
p = current price of the stock.
k = exercise price of the option.
sd = volatility of the stock (standard deviation of annual rate of return)
r = continuously compounded risk-free rate of return, e.g., the return on U.S. Treasury bills with very short maturities.
t = time (in years) until the expiration date The contribution from RVaaS is to develop BSM as an easy-to-use command-line API, which allow users to type in key values to get the final answer. The command is
BlackScholes[p_, k_, sd_, r_, t_]
2.2 Delta, Theta and other requirements To facilitate the use of BSM command, additional command-line APIs are required. Two of them are known as Delta and Theta, which are part of financial derivatives of calculating advanced pricing ad risk [3], [12]. Delta can indicate how much the price of an option will respond to a change of price of the stock. Delta is useful in risk management where a portfolio contains more than one option on the stock. The derivative function, D, is built in Mathematica, which explains why Mathematica is used. This much simplifies coding for Delta, which can be presented as
Delta[p_, k_, sd_, r_, t_] = D[BlackScholes[p, k, sd, r, t], t] Theta[p_, k_, sd_, r_, t_] =
- D[BlackScholes[p, k, sd, r, t], t]
To get an inverted Delta, a new function, Theta, is introduced. The operations of RVaaS include:
1. Risk calculation and analysis: This includes calculations of derivatives such as delta and theta which can calculate the accurate approximation for volatility, and the right prices and risk associated with it.
2. A visualization service using BSM: This translates all different types of risk into 3D Visualization so that there is no hidden or missing area of risk.
The benefits of using command-line APIs, BlackScholes, Delta and Theta, allow fast computation of results presented in Section 3.
3
S
CENARIOS OFR
UNNING3D
R
ISKThis section describes how RVaaS is used to calculate risk and pricing based on the market value. With regard to BSM, key values such as p, k, sd, r and t need to be known before the calculation. The value p, k and t are known because these values represent the starting values and the target values. The value of sd can be obtained from Volatility S&P 500 (VIX) Chicago options [4], which releases the daily values of sd. The value of r can be obtained from the government body such as the US Treasury. There are two scenarios given in this case.
The first scenario involves profits/loss in relation to put price. The call price (buying price) for a particular investment is 60 per stock. The put price (selling price) to get zero profit/loss is also 60. The risk-free rate, the guarantee rate that will not incur loss, is between 0 and 1.5%. However, the profit/loss varies because of the impact of volatility in the market. In turn, this means selling prices between 50 and 60 will lead to different extents of loss due to the rapid fluctuations in the market. Similarly, selling prices between 60 and 70 will result in differing levels of profit. The intent is to find out the percentage of profit and loss for a massive sale and the risk associated with it.
Using Black Scholes function (BlackScholes
[p_, k_, sd_, r_, t_]), where
p = current price of the stock, set between 40 and 60.
k = exercise price of the option, 50 is the default.
sd = volatility of the stock (standard deviation of annual rate of return), 0.45.
4
r = continuously compounded risk-free rate of return, e.g., the return on Europe U.S. Treasury bills, 0.04.
t = time (in years) until the expiration date, between 1 month and four years later. Two types of results are presented. The first type can model all computed analysis into 3D visualization. This is beneficial to the analysts and stakeholders since they can understand the percentage of profits and loss associated with changes in put price, time and volatility. The second type is to calculate the numerical values of percentage of profits or loss by providing key inputs to the Black Scholes.
The first type of result for Black Scholes:
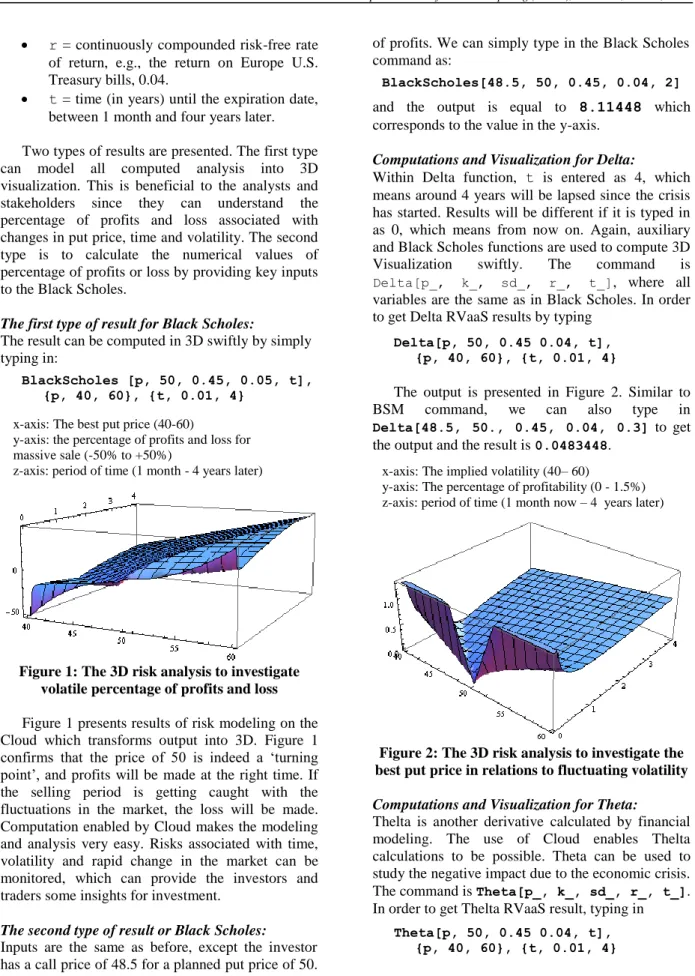
The result can be computed in 3D swiftly by simply typing in:
BlackScholes [p, 50, 0.45, 0.05, t], {p, 40, 60}, {t, 0.01, 4}
Figure 1: The 3D risk analysis to investigate volatile percentage of profits and loss Figure 1 presents results of risk modeling on the Cloud which transforms output into 3D. Figure 1 confirms that the price of 50 is indeed a ‘turning point’, and profits will be made at the right time. If the selling period is getting caught with the fluctuations in the market, the loss will be made. Computation enabled by Cloud makes the modeling and analysis very easy. Risks associated with time, volatility and rapid change in the market can be monitored, which can provide the investors and traders some insights for investment.
The second type of result or Black Scholes: Inputs are the same as before, except the investor has a call price of 48.5 for a planned put price of 50. After 2 years, he/she wishes to know the percentage
of profits. We can simply type in the Black Scholes command as:
BlackScholes[48.5, 50, 0.45, 0.04, 2]
and the output is equal to 8.11448 which corresponds to the value in the y-axis.
Computations and Visualization for Delta:
Within Delta function, t is entered as 4, which means around 4 years will be lapsed since the crisis has started. Results will be different if it is typed in as 0, which means from now on. Again, auxiliary and Black Scholes functions are used to compute 3D Visualization swiftly. The command is
Delta[p_, k_, sd_, r_, t_], where all
variables are the same as in Black Scholes. In order to get Delta RVaaS results by typing
Delta[p, 50, 0.45 0.04, t], {p, 40, 60}, {t, 0.01, 4}
The output is presented in Figure 2. Similar to BSM command, we can also type in
Delta[48.5, 50., 0.45, 0.04, 0.3] to get
the output and the result is 0.0483448.
Figure 2: The 3D risk analysis to investigate the best put price in relations to fluctuating volatility Computations and Visualization for Theta:
Thelta is another derivative calculated by financial modeling. The use of Cloud enables Thelta calculations to be possible. Theta can be used to study the negative impact due to the economic crisis. The command is Theta[p_, k_, sd_, r_, t_]. In order to get Thelta RVaaS result, typing in
Theta[p, 50, 0.45 0.04, t], {p, 40, 60}, {t, 0.01, 4} x-axis: The best put price (40-60)
y-axis: the percentage of profits and loss for massive sale (-50% to +50%)
z-axis: period of time (1 month - 4 years later) x-axis: The implied volatility (40– 60)
y-axis: The percentage of profitability (0 - 1.5%) z-axis: period of time (1 month now – 4 years later)
5 The output is presented in Figure 3. Similar to BSM command, we can also type in
Theta[48.5, 50., 0.45, 0.04, 0.3] to get
the output and the result is -8.33054.
Figure 3: The 3D risk analysis to explore the percentage of loss and the put price The use of command-lines can ensure that users know the input variables before they use. The level of complexity of using this service is also low to ensure that the majority of users can use this service with ease. Users can also understand the definitions and results from the computations of
BlackScholes, Delta and Theta.
4 E
XPERIMENTSThis section describes the hardware set up and the results of experiments. The purpose is to ensure that first, the RAaaS can offer a large-scaled simulations simultaneously. Second, all simulations can be completed in a relatively short period of times to ensure all users can obtain their simulated results of their investment scenarios. In the use of RVaaS, time step is a key input variable to determine the frequency of calculations. This is similar to the concept of iterations. The more the number of times the calculations have been performed, the more accurate the results will get close to [5], [14]. However, those approaches do not work for Cloud Computing. Our innovative method can make use of time steps for both accuracy and performance improvement. In the event of performing RVaaS, time step is equal to 10 by default. This aim is to allow computation to be completed quickly. The time step can be adjusted between the values of 10 and 50. The higher the values, the more accurate of the results (0.1% more accurate) as demonstrated in our previous work. The setup involved is described
as follows. Various simulations and experiments for RVaaS have been performed using a high specification desktop environment, private and public clouds.
The desktop machine has 2.67 GHz Intel Xeon Quad Core and 4 GB of memory (800 MHz). The private cloud is used and it involves four sites in total; two in London and two in Southampton. The University of Southampton resources are used for all 3D Visualization, and are also used to connect the lead author’s home cluster, Greenwich and London Data Centre. There are reliable computational connections between internal networks.
The London Data Centre has advanced Cloud and parallel computing infrastructure and network attached storage (NAS) service. In total it has CPUs totaling 30 GHz, 60 GB of RAM and 12 TB of disk space in place. Experiments performed in this environment get the best benefit of advanced optical fiber networking. There are two servers at London Greenwich, with a total of 9 GHz CPU and 20 GB RAM. The two servers at University of Southampton both have 6.0 GHz and 16 GB RAM. For the home cluster, the total hardware capability is 24.2 GHz CPU and 32 GB RAM. Simulations and experiments on a desktop and two private clouds (one in Southampton and one in London) get the same results, and thus execution time to complete all simulation is the benchmark to differentiate their performance on different platforms.
Code written for BSM has been used for experimenting and benchmarking with some experimental Modeling of Assets (MoA) code. For example, our previous work [3] describes and explains code written for BSM which has been used for experimenting and benchmarking in the Clouds. Based on the core code algorithm, the objective is to calculate the best prices and risks, in regard to the use of American and European options. Execution time (based on the average of five results) is used as the performance benchmark. All results suggest standard deviations are kept within 0.1% to ensure a high level of accuracy. Five different sets of experiments were designed, and each set of experiments records, execution time from 50,000 to 500,000 simulations.
Using MATLAB the code can achieve up to 500,000 simulations in one go. Different values of time steps of between 10 and 50 were used as the key input. Five experiments were performed for each increased of instance of simulations. The average value is the average execution time. All simulations were taken from 50,000 to 500,000, with regards to the different time step values of x-axis: The best put price (40 – 60)
y-axis: The percentage of loss (-2 and -11%) z-axis: the period of time (1 week – 4 years later)
6 Figure 4: experiments of large-scale simulations (1 unit = 50,000 simulations)
between 10 and 50. Figure 4 shows the simulation results for the default time step is equal to 10.
Results for each set of experiments are recorded and shown in Figure 4, which shows that 500,000 simulations can be completed within 22 seconds on all different platforms. The use of smaller time steps such as 10 and 20 is to enhance optimization but may reduce the extent of high accuracy required by some financial computation [3]. This section describes other experimental results for time steps equal to 20, 30, 40 and 50 respectively. Results are presented between Figure 5 and Figure 8.
Figure 5: experiments of large-scale simulations for time step = 20 (1 unit = 50,000 simulations)
Figure 6: experiments of large-scale simulations for time step = 30 (1 unit = 50,000 simulations)
Results show that with the increased time step, the additional execution time is less than 1 second for every increased 10 time steps. This means that the quality and performance of RVaaS is not affected by the increased time steps used in the calculations. All 500,000 simulations can be completed within 24 seconds for all platforms for time steps up to 50.
Figure 7: experiments of large-scale simulations for time step = 40 (1 unit = 50,000 simulations)
Results support that RVaaS can meet the two requirements described in Section 1 as follows. First, the computed values have been verified by the computing and finance analysts for accuracy. Second, the results in this section conform that large-scaled simulations can be completed within 24 seconds.
Experimental results (default) for time step = 10
4 6 8 10 12 14 16 18 20 22 1 2 3 4 5 6 7 8 9 10 No of sim ulations (1 unit = 50,000 sim ulations)
A v e ra g e e x e c u ti o n ti m e (s e c ) Private cloud (Southampto n clusters) Private cloud (Southampto n and London clusters) Public cloud (Ubuntu 8.0.4)
Experimental results for time step = 20
4 6 8 10 12 14 16 18 20 22 1 2 3 4 5 6 7 8 9 10
No of sim ulations (1 unit = 50,000 sim ulations)
A v e ra g e e x e c u ti o n t im e ( s e c ) Private cloud (Southampto n clusters) Private cloud (Southampto n and London clusters) Public cloud (Ubuntu 8.0.4)
Experim ental results for tim e step = 30
4 6 8 10 12 14 16 18 20 22 1 2 3 4 5 6 7 8 9 10
No of sim ulations (1 unit = 50,000 sim ulations)
A v e ra g e e x e c u ti o n t im e ( s e c ) Private cloud (Southampton clusters) Private cloud (Southampton and London clusters) Public cloud (Ubuntu 8.0.4)
Experim ental result for tim e step = 40
5 7 9 11 13 15 17 19 21 23 1 2 3 4 5 6 7 8 9 10
No of sim ulations (1 unit = 50,000 sim ulaitons)
A v e ra ge e x e c ut ion t im e ( s e c ) Private cloud (Southampton clusters) Private cloud (Southampton and London clusters) Public cloud (Ubuntu 8.0.4)
7 Figure 8: experiments of large-scale simulations
for time step = 50 (1 unit = 50,000 simulations)
5 O
THERS
ERVICES INRV
AAS
This section describes other services offered by RVaaS for risk computation. There are demands in the market and stakeholders to keep track of risks and prices of the selected stock. In regard to this requirement, RVaaS provides financial analytics to compute prices and keep track of the market volatility. This allows the investors to see changes in the market and make the appropriate decisions of their investment. Our previous work describes our implementation of “Business Intelligence as a Service (BIaaS)” [4], which can fully blend and integrate with RVaaS. The benefit is to allow investors to keep track of pricing and risk in real-time.
The product from BIaaS is the financial stock market analysis (FSMA), which aims to analyze the stock market analysis and provide the interfaces for the investors. The use of the public cloud data and private cloud SaaS computation are the core technologies behind FSMA. The public data is obtained from Google Finance. Two APIs are specifically written to obtain and analyze the data and present in the form of visualization. Their functionalities are as follows.
FinancialData – this command can capture financial data from Google Finance and make data to be understood by the private cloud to be ready for data computation and analysis. It follows the command-line approach which allows users to provide one sentence of line of code to obtain the data.
TradingChart – this command can compute the data obtained from “FinancialData” command and present them in a way similar to software
provided for London Stock Exchange (LSE). Investors can see business analytics of their selected stock.
Our previous work demonstrates the design, implementation and experiments of these APIs [4]. The focus for this paper is not to discuss what makes these two APIs but how they can be used to maximize the benefits of adopting RVaaS.
Figure 9 shows FSMA to present SP500 index values. The upper section is the index movement between January and April 2014. The red and green bar charts show the movement on that instance and the overall movement. The other three lines are to keep track the stock index with the upper, median and lower limits. The lower section of Figure 9 shows the trading volume of the instance. The higher the bar stands, the more trading volume that the SP500 has attracted.
Figure 9: Financial stock market analysis (FSMA) to present SP500 in RVaaS Here is another example to illustrate how FSMA can work. The Dow Chemical Company (Dow) is an active company that has been on profitable sides from the stock investment this year. Their data is obtained from Google Finance and use our private cloud SaaS to analyze the data. Figure 10 shows the overall movement of the Dow indexes between January and April 2014, where the upper, median and lower limits of the analytical graphs can help monitor its movements.
The trading volume at the bottom of Figure 10 suggests that there were more trading activities earlier in the year. Results in Figure 10 show that if an investor purchased the stock earlier in the year and then sold it in April 2014, he/she would make a profit. The use of FSMA can simplify the complexity of stock market exchange and help investors to understand the up-to-data market
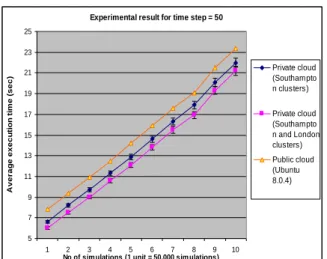
Experimental result for time step = 50
5 7 9 11 13 15 17 19 21 23 25 1 2 3 4 5 6 7 8 9 10
No of sim ulations (1 unit = 50,000 sim ulations)
A v e ra g e e x e c u ti o n ti m e (s e c ) Private cloud (Southampto n clusters) Private cloud (Southampto n and London clusters) Public cloud (Ubuntu 8.0.4) 1750 1800 1850 1900 410 9 610 9
8 situations, so that they can make better judgment in their decision.
Figure 10: Financial stock market analysis (FSMA) to present Dow in RVaaS
Our previous work also demonstrates the use of FSMA to predict the stock index movements [4]. This needs good quality of input data from the S&P 500 index for volatility and a set of pre-defined input data, and the use of Heston Model and its APIs to predict the stock index movements. The data from the S&P 500 can be used as the input to predict the stock index movements in the following 10 minutes. This help investors to predict any forthcoming risk or possibility for the market to respond too positively or too negatively, so that investors can make better plans for their investment – whether to sell some or all, or buy some/all depending on the market reaction, predictive analysis and the advise they receive. We will demonstrate our new prototypes to demonstrate the consolidation of RVaaS services for investors and users.
6 C
ONCLUSIONIn reply to the problems caused by the financial crisis, we propose Risk Visualization Service (RVaaS). The lack of visualization to track down the risks associated with the best put price, implied volatility, percentage of profits/loss and movement in the market mean their model is not real-time and ignoring some assumptions which are critical to reliable analysis. Using RVaaS in the Cloud permits organizations to break the constraints of the Gaussian copula and use the power of Cloud Computing to adopt more complex models and improve accuracy in risk analysis and prediction.
RVS operates in two phases:
Calculating key derivatives such as Delta and Theta for financial modeling.
Risk modeling in BSM, creating 3D Visualization and Analysis.
We use one real-case scenario to demonstrate our RVaaS. Results show that numerical results can be computed by typing the key variables obtained from different public sources and the targets set by the stakeholders. Risks presented in visualization form allow the potential investors and stakeholders to keep track of the status of risk with regard to time, prices and volatility. We explain the purpose of the experiments and the time step. Results in experiments show that RVaaS can perform up to 500,000 simulations and complete all simulations within 24 seconds for time steps of up to 50. Results support the requirement of providing accurate results and fast services to complete.
RVaaS provides a structured way to deploy low cost, high quality risk assessment which avoids generating the unduly optimistic results which can arise from an implicit assumption in other techniques that favorable trading conditions will continue. We also demonstrate another service that blends well with RVaaS, the financial stock market analysis (FSMA). We use two examples, SP500 and Dow, to demonstrate that pricing and market volatility can be tracked and monitored. All the results provide investors and users with added values. For example, the trading volume in Dow suggests more investors purchased the stock and they planned to sell at different time scale while making profits. We are certain that the RVaaS can provide greater benefits to wider groups of users so that they can manage their pricing and risks with ease.
R
EFERENCES[1] F., Black F., M., Scholes, “The Pricing of Options and Corporate Liabilities”, Journal of Political Economy, 81 (3), 637-654, 1973. [2] R. E., Caflisch, R.E., “Monte Carlo and
quasi-Monte Carlo methods”, Acta Numerica, 7, 1-49, 1998.
[3] V., Chang, C. S., Li, D., De Roure, G., Wills, R. J., Walters, C., Chee, “The Financial Clouds Review”, International Journal of Cloud Applications and Computing, 1 (2), 46-63, 2011.
[4] V. Chang, “Business Intelligence as a Service in the Cloud”, Future Generation Computer Systems, DOI: http://www.sciencedirect.com/
42 44 46 48 50 210 7 410 7
9 science/article/pii/S0167739X13002926,
accessed on April 14, 2014.
[5] M. J., Duncan, H. F., Levison, M. H., Lee, “A
multiple time step symplectic algorithm for
integrating close encounters”. The Astronomical
Journal, 116(4), 2067, 1998.
[6] Financial Times: “Lehman Brothers files for bankruptcy”, 2008.
[7] Financial Times: “Interview with Lord Turner, Chair of Financial Services Authority”, in: Financial Times, London, 2009.
[8] C., Hamnett, “The Madness of Mortgage Lenders: Housing finance and the financial crisis”, technical paper, King’s College, London, London, UK, 2009.
[9] J. C., Hull, “Options, Futures, and Other Derivatives”, Seventh Edition. Pearson, Prentice Hall, London, 2009.
[10] M., Hutchinson, “A Finer Formula for Assessing Risk”, in: New York Times, New York, 2010.
[11] D., MacKenzie, and T., Spears, “The Formula That Killed Wall Street”: The Gaussian Copula and the Material Cultures of Modelling, Working paper, School of Social and Political Science, the University of Edinburgh, June 2012.
[12] Miller, R. M.: “Option Valuation”, Miller Risk Advisors, Technical paper, 2010.
[13] J., Villasante, Approaching the Cloud: Better Business using Grid Solutions: Twenty-five successful case studies from BEINGrid, 2010.
[14] C., Yavuzturk, J. D., Spitler, “A short time step
response factor model for vertical ground loop
heat exchangers”. Ashrae Transactions, 105(2),
pp. 475-485, 1999.
A
UTHORB
IOGRAPHIESDr. Victor Chang has been a technical lead in web applications, web services, database, grid, cloud, storage, bioinformatics, financial modeling and research. He has also successfully delivered many IT projects in Taiwan, Singapore, Australia, and the UK since 1998. He is experienced in a number of different IT subjects and has 27 certifications with 97% on average. He completed PGCert (Higher education) and PhD within four years part-time while working full-time, whereby the distance between his work and research is hundreds of miles away.
Victor is a winner in 2011 European Identity Award in On Premise to Cloud Migration. He was selected to present his research in the House of Commons, UK, in 2011. He demonstrated numerous Cloud services in both of his practitioner and academic experience. He has 27 publications in the last four years as the first author.


![Figure 10: Financial stock market analysis (FSMA) to present Dow in RVaaS Our previous work also demonstrates the use of FSMA to predict the stock index movements [4]](https://thumb-us.123doks.com/thumbv2/123dok_us/1064751.2641534/8.892.108.486.177.452/figure-financial-analysis-present-previous-demonstrates-predict-movements.webp)
