Available Online atwww.ijmbs.info PubMed (National Library of Medicine ID: 101738825)
Index Copernicus Value 2018: 75.71 Original Research Article
Volume 4, Issue 3; March: 2020; Page No. 146-152
146 |
P a g e
AN INVITRO EVALUATION OF THE DISSOLUTION POTENTIAL OF VARIOUS BEVERAGES ON ENAMEL THROUGH
ANALYSIS OF pH AND CALCIUM IONS RELEASED.
Dr. Sagurti. Anitha Rao
1, Dr. Deepthi Angalakuditi
2, Dr. Soonu
3 1,2,3Department of Conservative Dentistry and Endodontics, Mamata Dental College, Khammam
Article Info: Received 20 February 2020; Accepted 22 March 2020DOI:https://doi.org/10.32553/ijmbs.v4i3.1065 Corresponding author: Dr. Deepthi Angalakuditi Conflict of interest: No conflict of interest.
Background: Beverage consumption is considered as one of the important risk factors for dental erosion.The purpose of the present study is to evaluate the enamel dissolution potentials of commercially available beverages through pH analysis and quantification of calcium ions released.
Materials and Methods:- Four commercially available beverages, Green tea (TETLEY LTD), Red bull energy drink (RAUCH FRUCHTSAFTE, GMBH&CO OG, UAE), Real mixed fruit juice (real fruit power ltd, DABUR), Appy fizz (PARLE AGRO) were used to analyse pH and calcium ions released through two independent phases. 24 enamel specimens were prepared from 12 healthy human molars. pH analysis was done with pH meter and calcium analysis was measured by using colorimetry and spectrophotometry. Statistical analysis was carried out by using tests of descriptive statistics, paired t test for intra group comparisons and One way ANOVA with Post Hoc tukey test for intergroup comparisons.
Results: Mixed fruit juice had shown highest acidic potential while Green tea had shown lowest acidic potential. Red Bull had shown highest dissolution potential while green tea had shown lowest dissolution potential.
Conclusion: Dental erosion is influenced by the pH of the beverages and calcium dissolution of the tooth. Red bull has shown highest erosion potential. Even though green tea with an high acidic pH did not show any considerable erosion potential..
Key words: Dental erosion, pH of beverages, dissolution potential of beverages Introduction
Beverage consumption is considered as one of the important risk factors for dental erosion. According to many in vitro and in situ studies, acids in beverages have the potential to demineralise enamel and dentin and their excessive consumption may result in noncarious lesions such as erosions.1 Enamel, the hardest tissue in the body is very much under the influence of pH and minerals in the saliva.2
Dental erosion is defined as loss of tooth structure by chemical action in the continued presence of demineralising agents (acids). It is a multi-factorial condition with extrinsic and intrinsic causative factors.3 In recent decades, beverages such as fruit juices have become less expensive, more varied and more palatable, leading to increased intake.1-3 Sports drinks are designed to deliver a balanced amount of carbohydrate and fluid to allow an athlete to rehydrate and refuel during exercise.4 Epigallocatechin is a catechin that can be found in high concentrations in green tea and proved to be the key contributive element for the possible health effects in green tea consumers.5
It is known that the ingestion of acidic food promotes the release of hydrogen ions and dissolution of calcium and phosphate minerals which may make medium to
become subsaturated.1,5 The critical pH value is calculated from the calcium and phosphate concentrations in the erosive solution itself.6 Studies have shown that erosive potential of a beverage is not only dependent on pH of the beverage but also on chemical factors that may be of significant influence such as calcium content release. Hence, the aim of present in vitro study is to evaluate the dissolution potentials of commercially available beverages on tooth enamel through pH analysis and quantification of calcium ions released.
Materials and Methods: Sample selection:
In this study,four commercially available beverages, Green tea (GT, Tetley), Red bull energy drink (RB, RAUCH FRUCHTSAFTE GMBH &CO OG, UAE), Real mixed fruit juice (MFJ, DABUR), Appy fizz (AF, PARLE AGRO PVT LTD) were analysed in two independent phases for determining dissolution potential of enamel in extracted human teeth (FIGURE I). 1% citric acid is used as the positive control and distilled water, as negative control. 12 healthy human molars were used in this study to obtain 24 enamel specimens (FIGURE II).
147 |
P a g e
The study included healthy non carious human molarsextracted for periodontal or orthodontic reasons, without attrition, abrasion or erosion of enamel. There should be no crown fractures.
Exclusion criteria:-
The exclusion criteria included carious teeth, attrided, abraded or eroded teeth, restored and fractured teeth etc. Preparation of
beverages:-Green tea (GT) was prepared by mixing 2gms of beverages:-Green Tea powder in 180 ml warm water and filtered (FIGURE III). Red bull energy drink and Appy fizz were opened before 60 minutes of experiment to remove all carbonation (FIGURE IV). All the beverages were used at room temperature. The experiment was conducted in two phases.
Phase 1:
60 ml samples of beverages and controls were taken and pH analysis was done by using a pH meter in triplicates (FIGURE V).
Phase 2:
24 healthy human molars were used in this study to obtain 48 enamel specimens. Decoronation was done at CEJ. Crown was mesiodistally cut in to two halves by using disc and mandrel and two 4×4×2 mm fragments are obtained from the halves. Each enamel specimen was embedded on acrylic resin cylinder block with the experimental surface exposed to outside (FIGURE VI). A central window of 5×5mm was created covering the rest of the fragment with nail varnish. All the specimens were subjected to erosive challenge.
Erosive challenge:-
Before immersion of enamel specimens in to beverages, one sample of each solution was used as ‘standard’, to determine initial calcium concentration (FIGURE VII).48 enamel specimens were randomly distributed to 6 groups(n=8)(FIGURE VIII). The specimens were immersed in solutions for 24hrs. Calcium analysis was done at 2hrs and 24hrs interval, by using colorimeter and spectrophotometer (FIGURE IX,X). Difference of initial and final calcium values was calculated.
Technical Information:-
Statistical analysis was carried out by using SPSS version 23. Tests performed are descriptive statistics, Paired t test for intra group comparisons and one way ANOVA with post Hoc Tukey test for intergroup comparisons. A Null Hypothesis, with H0 indicating that there is no difference in the leaching of calcium ions using the various solutions and an alternate Hypothesis,H1 indicating that there is difference in the leaching of calcium ions using the various solutions was formulated. P value < 0.05 is considered as statistically significant. If P value < 0.05, reject the null hypothesis and consider the alternate hypothesis.
Results:
Phase 1 (pH OF BEVERAGES):-
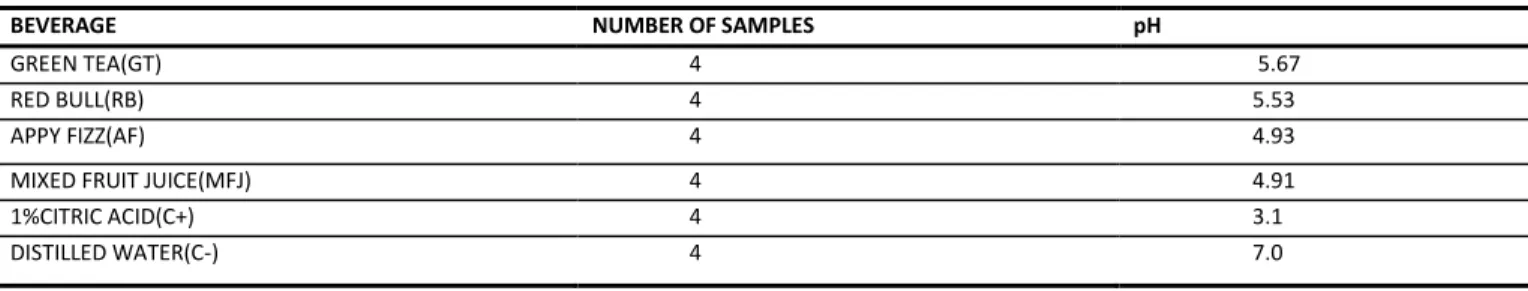
Mixed fruit juice had shown highest acidic potential (pH of 4.91) while Green tea has shown lowest acidic potential (pH of 5.67). Mixed fruit juice and Appy fizz had shown nearly equal acidic potentials.1% citric acid has shown an acidic pH of 3.1 and distilled water has shown neutral pH (TABLE 1).
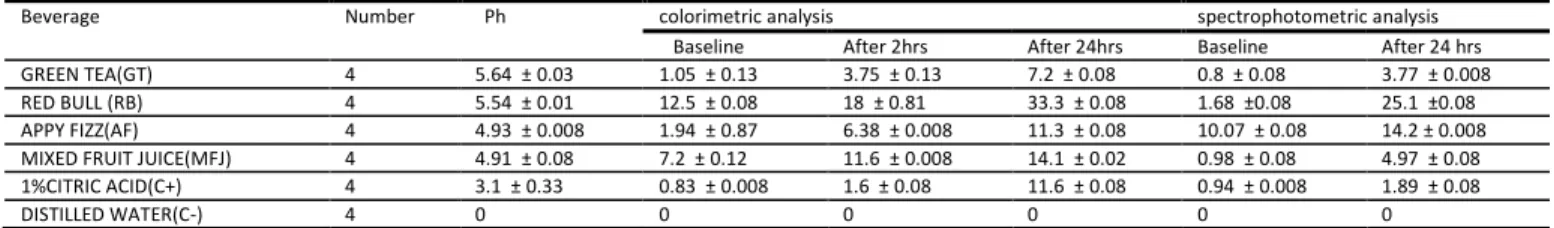
Phase 2 (Erosive
challenge):-Mean values of calcium at baseline before immersion, at 2hrs and 24 hrs after immersion are calculated. Highest calcium dissolution was recorded for Red bull (RB) energy drink and lowest was recorded for Green tea (GT). Mixed fruit juice and Appy fizz had intermediate dissolution potentials. (TABLE II, GRAPH I) .The leaching ability of various solutions from high to low is Redbull> Mixed fruit juice > Citric acid >Appy fizz > Green tea > Distilled water. All of the parameters showed statistically significant differences between the groups compared. There is statistically significant difference present between the intra group comparisons at various time periods with the highest leaching at 24 hours in both colorimetry and spectrophotometry among the samples (TABLE III). Intergroup comparison was done with One Way ANOVA (TABLE IV). To know the importance of best material, Post Hoc tukey test was done which showed Red bull with highest calcium dissolution.(TABLE V,VI,VII).
Table I: pH of all beverages
BEVERAGE NUMBER OF SAMPLES pH
GREEN TEA(GT) 4 5.67
RED BULL(RB) 4 5.53
APPY FIZZ(AF) 4 4.93
MIXED FRUIT JUICE(MFJ) 4 4.91
1%CITRIC ACID(C+) 4 3.1
148 |
P a g e
Inference:-Green Tea>Red bull>Appy Fizz>Mixed fruit juice>1% citric acid>Distilled waterTable II: Mean and Standard Deviation of the various parameters in various groups
Beverage Number Ph colorimetric analysis spectrophotometric analysis
Baseline After 2hrs After 24hrs Baseline After 24 hrs GREEN TEA(GT) 4 5.64 ± 0.03 1.05 ± 0.13 3.75 ± 0.13 7.2 ± 0.08 0.8 ± 0.08 3.77 ± 0.008 RED BULL (RB) 4 5.54 ± 0.01 12.5 ± 0.08 18 ± 0.81 33.3 ± 0.08 1.68 ±0.08 25.1 ±0.08 APPY FIZZ(AF) 4 4.93 ± 0.008 1.94 ± 0.87 6.38 ± 0.008 11.3 ± 0.08 10.07 ± 0.08 14.2 ± 0.008 MIXED FRUIT JUICE(MFJ) 4 4.91 ± 0.08 7.2 ± 0.12 11.6 ± 0.008 14.1 ± 0.02 0.98 ± 0.08 4.97 ± 0.08 1%CITRIC ACID(C+) 4 3.1 ± 0.33 0.83 ± 0.008 1.6 ± 0.08 11.6 ± 0.08 0.94 ± 0.008 1.89 ± 0.08
DISTILLED WATER(C-) 4 0 0 0 0 0 0
Inference: Red bull shows highest calcium dissolution followed by mixed fruit juice,Appy fizz,Green Tea. Table III: Intra group comparisons of colorimetric analysis
Group Comparison mean difference t value df sig
1 c base line - c 2 hours -2.70000 -22.045 3 <0.001**
c base line - c 24 hours -6.15000 -64.235 3 <0.001**
c 2 hours - c 24 hours -3.45000 -53.447 3 <0.001**
s baseline - s 24 hours -2.97000 -66.136 3 <0.001**
2 c base line - c 2 hours -5.50000 -12.247 3 <0.001**
c base line - c 24 hours -20.80000 -254.747 3 <0.001**
c 2 hours - c 24 hours -15.30000 -41.641 3 <0.001**
s baseline - s 24 hours -23.42000 -637.412 3 <0.001**
3 c base line - c 2 hours -.07500 -.017 3 .987
c base line - c 24 hours -4.99500 -1.144 3 .336
c 2 hours - c 24 hours -4.92000 -109.559 3 <0.001**
s baseline - s 24 hours -4.13000 -91.967 3 <0.001**
4 c base line - c 2 hours -4.40000 -53.889 3 <0.001**
c base line - c 24 hours A
c 2 hours - c 24 hours -2.50000 -30.619 3 <0.001**
s baseline - s 24 hours A
5 c base line - c 2 hours -.77000 -17.146 3 <0.001**
c base line - c 24 hours -10.77000 -293.122 3 <0.001**
c 2 hours - c 24 hours -10.00000 -122.474 3 <0.001**
s baseline - s 24 hours A
6 c base line - c 2 hours A
c base line - c 24 hours A
c 2 hours - c 24 hours A
s baseline - s 24 hours A
a. The correlation and t cannot be computed because the standard error of the difference is 0. Inference:
The following inferences can be drawn from the table
There is statistically significant differences present between the intra group comparison at various time periods with the highest leaching at 24 hours in both calorimetry and spectrophotometry.
Table IV: Intergroup comparison with One Way ANOVA
Sum of Squares Df Mean Square F Sig.
pH Between Groups 88.284 5 17.657 33991.694 <0.001**
Within Groups .009 18 .001
Total 88.293 23
c base line Between Groups 480.156 5 96.031 7.557 <0.001**
Within Groups 228.729 18 12.707
Total 708.885 23
c 2 hours Between Groups 924.768 5 184.954 1592.750 <0.001**
Within Groups 2.090 18 .116
Total 926.859 23
c 24 hours Between Groups 2482.993 5 496.599 89387.760 <0.001**
Within Groups .100 18 .006
Total 2483.093 23
s baseline Between Groups 287.258 5 57.452 49717.719 <0.001**
Within Groups .021 18 .001
Total 287.279 23
s 24 hours Between Groups 1834.540 5 366.908 162668 <0.001**
Within Groups .041 18 .002
Total 1834.581 23
149 |
P a g e
Inference:There is statistically significant differences present in the leaching of calcium ions when placed in various solutions at different time periods and various methods used.To know the importance of the best material it should be re analyzed using Post Hoc Tukey test.
Table V: Post Hoc Tukey test for intergroup comparisons.
Dependent Variable Comparisons Mean Difference (I-J) Std. Error Sig.
pH GREEN TEA(GT) RED BULL (RB) .69250* .01612 <0.001**
APPY FIZZ(AF) .71250* .01612 <0.001**
MIXED FRUIT JUICE(MFJ) .73250* .01612 <0.001**
1%CITRIC ACID(C+) 2.54500* .01612 <0.001**
DISTILLED WATER(C-) 5.64250* .01612 <0.001**
RED BULL (RB) APPY FIZZ(AF) .02000 .01612 <0.001**
MIXED FRUIT JUICE(MFJ) .04000 .01612 <0.001**
1%CITRIC ACID(C+) 1.85250* .01612 <0.001**
DISTILLED WATER(C-) 4.95000* .01612 <0.001**
APPY FIZZ(AF) MIXED FRUIT JUICE(MFJ) .02000 .01612 <0.001**
1%CITRIC ACID(C+) 1.83250* .01612 <0.001**
DISTILLED WATER(C-) 4.93000* .01612 <0.001**
MIXED FRUIT JUICE(MFJ) 1%CITRIC ACID(C+) 1.81250* .01612 <0.001**
DISTILLED WATER(C-) 4.91000* .01612 <0.001**
1%CITRIC ACID(C+) DISTILLED WATER(C-) 3.09750* .01612 <0.001**
**-statistically highly significant (p<0.01) Inference:
There is statistically significant differences present between the various group compared with the order of pH of the solution from high to low as follows
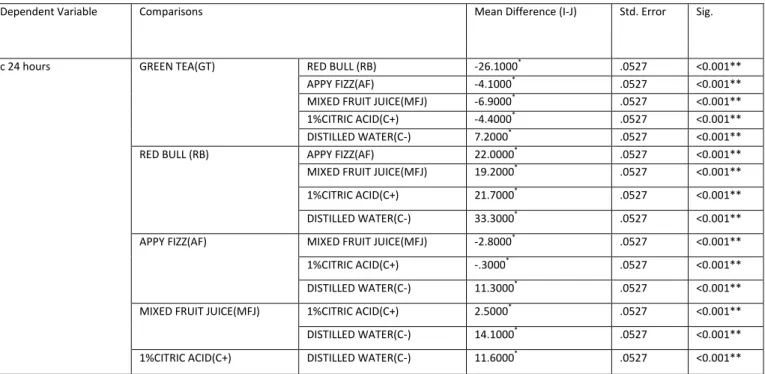
Green tea >Redbull>appy fizz > mixed fruit juice > citric acid > distilled water. Table VI: Post Hoc Tukey test for intergroup comparisons.
Dependent Variable Comparisons Mean Difference (I-J) Std. Error Sig.
c 24 hours GREEN TEA(GT) RED BULL (RB) -26.1000* .0527 <0.001**
APPY FIZZ(AF) -4.1000* .0527 <0.001**
MIXED FRUIT JUICE(MFJ) -6.9000* .0527 <0.001**
1%CITRIC ACID(C+) -4.4000* .0527 <0.001**
DISTILLED WATER(C-) 7.2000* .0527 <0.001**
RED BULL (RB) APPY FIZZ(AF) 22.0000* .0527 <0.001**
MIXED FRUIT JUICE(MFJ) 19.2000* .0527 <0.001**
1%CITRIC ACID(C+) 21.7000* .0527 <0.001**
DISTILLED WATER(C-) 33.3000* .0527 <0.001**
APPY FIZZ(AF) MIXED FRUIT JUICE(MFJ) -2.8000* .0527 <0.001**
1%CITRIC ACID(C+) -.3000* .0527 <0.001**
DISTILLED WATER(C-) 11.3000* .0527 <0.001**
MIXED FRUIT JUICE(MFJ) 1%CITRIC ACID(C+) 2.5000* .0527 <0.001**
DISTILLED WATER(C-) 14.1000* .0527 <0.001**
150 |
P a g e
TABLE VII: Post Hoc Tukey test for intergroup comparisons.Dependent Variable Comparisons Mean Difference (I-J) Std. Error Sig.
s 24 hours GREEN TEA(GT) RED BULL (RB) -21.33000* .03358 <0.001**
APPY FIZZ(AF) -10.43000* .03358 <0.001**
MIXED FRUIT JUICE(MFJ) -1.20000* .03358 <0.001**
1%CITRIC ACID(C+) 1.88000* .03358 <0.001**
DISTILLED WATER(C-) 3.77000* .03358 <0.001**
RED BULL (RB) APPY FIZZ(AF) 10.90000* .03358 <0.001**
MIXED FRUIT JUICE(MFJ) 20.13000* .03358 <0.001**
1%CITRIC ACID(C+) 23.21000* .03358 <0.001**
DISTILLED WATER(C-) 25.10000* .03358 <0.001**
APPY FIZZ(AF) MIXED FRUIT JUICE(MFJ) 9.23000* .03358 <0.001**
1%CITRIC ACID(C+) 12.31000* .03358 <0.001**
DISTILLED WATER(C-) 14.20000* .03358 <0.001**
MIXED FRUIT JUICE(MFJ) 1%CITRIC ACID(C+) 3.08000* .03358 <0.001**
DISTILLED WATER(C-) 4.97000* .03358 <0.001**
1%CITRIC ACID(C+) DISTILLED WATER(C-) 1.89000* .03358 <0.001**
Inference:
The leaching ability of various solutions from high to low as follows
Redbull> mixed fruit juice > citric acid >appy fizz > green tea > distilled water.
Graph 1: Mean values of various parameters in the groups compared showing Red bull with highest dissolution at both the intervals of time.
0 5 10 15 20 25 30 35
Baseline After 2hrs After 24hrs Baseline After 24 hrs
pH calorimetric analysis spectrophotometric analysis
GREEN TEA(GT) RED BULL (RB) APPY FIZZ(AF)
151 |
P a g e
Figure I: (GT,AF,RB,MFJ)Figure II: (Sectioned teeth fragments in saline)
Figure III: (Green Tea mixed with water)
Figure IV: (Opened Appy Fizz and Mixed friut juice)
Figure V: (pH meter)
Figure VI: (Teeth fragments embedded in acrylic with enamel towards outside)
Figure VII: (Standard)
Figure VIII: (Randomly distributed specimens in beverages)
Figure IX: (Colorimeter)
152 |
P a g e
Discussion:The erosive potential of a beverage is influenced not only by its pH value, but also by various factors such as the amount of calcium present,buffering capacity etc.1 Ferriera et al, stated that the solubility of hydroxyapatite, for both enamel and dentin, increases with the decrease in pH 1. Red bull contains glucose, glucose polymers, fructose, sucrose and small amounts of electrolytes which help prevent dehydration, replacing electrolytes lost due to perspiration, reinforce and revitalize energy.4,9 In this study, it has shown highest acidic pH of 4.91. According to this study, the calcium dissolution ability of various beverages from high to low is Red bull> Mixed fruit juice > Citric acid >Appy fizz > Green tea > Distilled water in order. Coombes et al stated that energy/sports drinks showed aggressive dissolution effect on dental enamel.4,8 Red Bull, in many previous studies had shown significantly higher levels of enamel mean percent weight loss than various other beverages.9 In this study, Red bull(RB) shows highest erosive potential with less acidic pH than Mixed fruit juice (MFJ) and anthetically, Green tea(GT) did not have considerable effect in enamel dissolution with an acidic pH of 5.67. Green tea(GT), in contrast, shown to have protective effect on enamel and dentin.10 One possible mechanism might be the inhibition of MMPs by Green tea(GT) during erosion process.10,11 Hence, only the pH of a beverage does not determine its dissolution potential, as not every beverage considered acid causes enamel dissolution.10,11
Evaluating the pH analysis and amount of calcium released in the solution, it may be observed that there is no correlation between the results found. Enamel under simulated intake of commercially available beverages , had a significant loss of calcium.10,11 Many in vitro, in situ and in vivo studies demonstrated the presence of citric acid and ascorbic acid in beverages.12-16 Lussi et al.studied the effect of different factors on enamel erosion and concluded that a better predictor of enamel demineralization was phosphorous than calcium.6,17 Carbonated beverages such as Appy fizz contain highly refined carbohydrates together with additives which may cause dissolution of enamel 17. Hara and Zero, found that the calcium concentration in beverages was a better predictor of erosion,than phosphorous.18
Conclusion:
Within limited conditions of this study, dental erosion is influenced by the pH of the beverages and other factors such as calcium dissolution. Calcium dissolution potential of a beverage is not dependent on pH of the beverage. A
rational protocol to encourage the sensible use of beverages is advised.
Limitations:
This study measures pH values and calcium dissolution effect of beverages on dental erosion. Many other factors such as phosphate and fluoride concentration, type of acid, buffering capacity and properties that influence clearance rate from mouth etc which act as significant factors in dental erosion are not included in this study. Further studies are advised since this study is limited to a small sample size and tests only pH and calcium dissolution among various other factors.
References:
1. Ferreira et al, The effect of powdered juice on human dental enamel dissolution, ,Clin Lab Res Den 2015; 21 (1): 58-64. 2. A.R. Fathilah , Z.H.A. Rahim et al ,The effect of beverages on the
release of calcium from the enamel surface. Annal Dent Univ Malaya 2008;15(1):1-4
3. Sturdvents art and science of operative dentistry, 5th edition. 4. Coombes et al ,Sports drinks and dental erosion, American Journal
of Dentistry, Vol. 18, No. 2, April, 2005
5. Magalhaesa et al, Chlorhexidine and green tea extract reduce dentin erosion and abrasion in situ, journal of dentistry 37 (2009) 994–998.
6. Lussi A et al, Erosive Tooth Wear: A Multifactorial Condition of Growing Concern and Increasing Knowledge,Monogr Oral Sci. Basel, Karger, 2014, vol 25, pp 1–15.
7. Gravelle et al ,Soft drinks and in vitro dental erosion, July/August 2015 General Dentistry
8. Barbour et al. Enamel dissolution in citric acid as a function of calcium and phosphate concentrations and degree of saturation with respect to hydroxyapatite, Eur J Oral Sci 2003; 111: 428–433. 9. Owens et al ,Effects of Carbonated Cola Beverages, Sports and
Energy Drinks and Orange Juice on Primary and Permanent Enamel Dissolution, , Austin J Dent - Volume 1 Issue 1 – 2014.
10. Kato et al Protective effect of green tea on dentin erosion and abrasion, J Appl Oral Sci. 2009;17(6):560-4.
11. Barbosa et al, Effect of supplementation of soft drinks with green tea extract on their erosive potential against dentine, Australian Dental Journal 2011; 56: 317–321.
12. Edwards et al, Buffering capacities of soft drinks: the potential influence on dental erosion, Journal of Oral Rehabilitation 1999 26; 923–927.
13. Lussi et al, The Role of Diet in the Aetiology of Dental Erosion, Caries Res 2004;38 (suppl 1):34–44.
14. Ehlen et al, Acidic beverages increase the risk of in vitro tooth erosion, Nutrition Research 28 (2008) 299–303.
15. Seow et al, Erosive effects of common beverages on extracted premolar teeth, Australian Dental Journal 2005;50:(3):173-178. 16. Benjakul et al, Association of dental enamel loss with the pH and
titratable acidity of beverages, Journal of Dental Sciences (2011) 6, 129e133.
17. Kitchens et al, Effect of Carbonated Beverages, Coffee, Sports and High Energy Drinks, and Bottled Water on the in vitro Erosion Characteristics of Dental Enamel, The Journal of Pediatric Dentistry Volume 31, Number 3/2007.
18. Larsen et al, Enamel Erosion by Some Soft Drinks and Orange Juices Relative to Their pH, Buffering Effect and Contents of Calcium Phosphate,. Caries Res 1999;33: