Improving Railway Safety Risk
Assessment Study
by
Mr YAO CHEN
A thesis submitted to
The University of Birmingham
for the degree of
DOCTOR OF PHILOSOPHY
School of Civil Engineering
The University of Birmingham
University of Birmingham Research Archive
e-theses repository
This unpublished thesis/dissertation is copyright of the author and/or third parties. The intellectual property rights of the author or third parties in respect of this work are as defined by The Copyright Designs and Patents Act 1988 or as modified by any successor legislation.
Any use made of information contained in this thesis/dissertation must be in accordance with that legislation and must be properly acknowledged. Further distribution or reproduction in any format is prohibited without the permission of the copyright holder.
ABSTRACT
ABSTRACT
Railway safety is very important, as it concerns human lives. Therefore identifying risks from possible failures is vital to maintain the safety of railways. Currently, many mature tools, such as fault tree analysis and event tree analysis, are applied to investigate possible risks to railway safety. However, in many circumstances, the applications of these tools are unable to provide satisfactory results when the risk data is incomplete or there is a high level of uncertainty involved in the risk dataThus it is essential to develop new methods to overcome the weakness of current assessment tools. This thesis introduces an improved intelligent system for risk analysis usingfuzzy reasoning approach (FRA) and improved fuzzy analytical hierarchy decision making process (Fuzzy-AHP), which is specially designed and developed for the railways, and able to deal with the uncertainty in risk assessment. The system builds upon work carried out by Dr Huang Shen who developed a safety risk model using FRA and Fuzzy-AHP. In his model, the risk level (RL) is assessed in terms of failure frequency (FF) and consequence severity (CS). This research introduced consequence probability (CP), which allows risk to be assessed correctly. In this system, FRA is employed to estimate the risk level (RL) in terms of FF, CS and CP. This allows imprecise or approximate information to be used in the risk analysis process. Improved Fuzzy-AHP technique is then integrated to determine the relative importance of risk contributors, so that the risk assessment can be progressed from hazardous event level to hazard group levels and finally to railway system level. Additionally, in order to select cost-effective measures to minimise the risk, a risk-based maintenance decision making model is developed by using the technique for preference by similarity to the ideal solution (TOPSIS) method which synthesises the proposed risk and cost models to produce the preference degree of each maintenance option. Both the risks associated with a railway asset and the costs incurred in each maintenance option are mapped onto a utility space and assessed in accordance with the respective constraints. The proposed decision
ABSTRACT
making model could be an effective tool to get a better understanding of risks associated with railway assets and make better maintenance decisions at the right time for managing the risks under various conditions. Two case studies are conducted to demonstrate the potential benefits of the methodology.
ACKNOWLEDGEMENTS
A
CKNOWLEDGEMENTS
First and foremost, I would like to express my sincerest gratitude to Dr Min An for his continuous support, guidance, discussion and comments throughout the course of my research. I am very fortunate to have him as my supervisor in my studies.
I would like to thank the University of Birmingham and London Underground for their support and provision of cases and data. Without their help, this research would never have been completed. I also thank all the experts who have contributed to the case studies for their valuable time and comments. Thanks also to my former colleague, Dr Shen Huang, in the research group for sharing his knowledge, opinions and experiences.
I would also like to express my affection for my parents for their endless love, encouragement and support during my time away.
The push for doing this PhD came from my wife Ling Lu, without whose incredible encouragement, patience, understanding and support, it would have been very difficult to be away from home.
Last but not the least, I would like to thank my numerous friends and colleagues who were there in my times of need.
TABLE OF CONTENTS
TABLE OF CONTENTS
ABSTRACT………I ACKNOWLEDGEMENTS ... III TABLE OF CONTENTS ... IV LIST OF FIGURES ... VIII LIST OF TABLES ... X ABBREVIATIONS ... XII CHAPTER 1: INTRODUCTION ... 1 1.1 Background ... 1 1.2 Aims ... 4 1.3 Objectives ... 5 1.4 Research Methodology ... 6 1.5 Research outcomes ... 9
1.6 Structure of the Thesis ... 10
CHAPTER 2: LITERATURE REVIEW ... 12
2.1 Introduction ... 12
2.2 Railway Safety ... 12
2.2.1 Potential safety problems ... 12
2.2.2 Major types of railway accidents ... 14
TABLE OF CONTENTS
2.3.3 Top-down and bottom-up risk assessment approaches ... 19
2.3.4 Quantitative and qualitative railway safety risk assessments ... 24
2.3.5 Discussions ... 34
2.4 Summary ... 35
CHAPTER 3: FUNDAMENTALS OF FRA AND MODIFIED FUZZY-AHP .... 36
3.1 Introduction ... 36 3.2 Fuzzy Expression ... 36 3.2.1 Fuzzy set ... 36 3.2.2 Fuzzy number... 38 3.3 Fundamental of FRA ... 39 3.3.1 Linguistic variables ... 40 3.3.2 Fuzzy rulebase ... 41
3.3.3 Fuzzy inference process ... 42
3.4 Fundamental of Fuzzy-AHP... 47
3.4.1 Fuzzy-AHP process ... 48
3.4.2 Modified Fuzzy-AHP process ... 51
3.5 Summary ... 59
CHAPTER 4: DEVELOPMENT OF RAILWAY SAFETY RISK MODEL ... 61
4.1 Introduction ... 61
4.2 Improvement of Railway Safety Risk Model ... 61
4.2.1 Preliminary phase... 65
4.2.2 Design phase ... 66
4.2.3 FRA analysis ... 68
TABLE OF CONTENTS
4.2.5 Risk response phase ... 79
4.3 Introduction to Third Parameter CP ... 79
4.4 Summary ... 84
CHAPTER 5: SOFTWARE DEVELOPMENT BASED ON PROPOSED RAILWAY SAFETY RISK MODEL ... 85
5.1 Introduction ... 85
5.2 Development of the Software ... 85
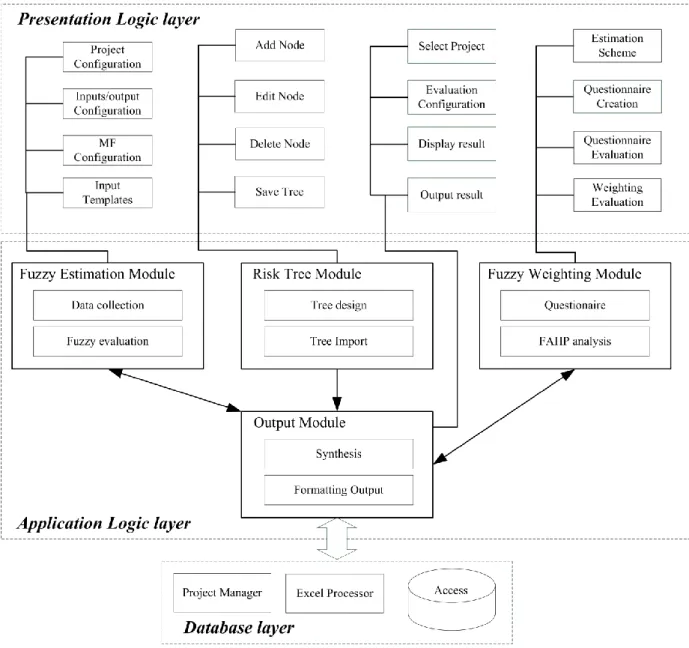
5.2.1 Presentation logic layer ... 87
5.2.2 Application logic layer ... 88
5.2.3 Database layer ... 89
5.3 Application of the Software to Railway Safety Risk Assessment ... 90
5.3.1 Risk identification ... 90
5.3.2 Risk estimation... 91
5.3.3 Risk response ... 95
5.4 Summary ... 97
CHAPTER 6: RISK-BASED DECISION MAKING APPROACH ... 98
6.1 Introduction ... 98
6.2 A Risk Based Asset Maintenance Management Framework ... 100
6.3 Safety Risk Model ... 103
6.4 Cost Model ... 105
6.5 TOPSIS Methodology ... 107
6.6 Risk-Cost Model ... 109
TABLE OF CONTENTS
7.1 Introduction ... 116
7.2 Hazard Risk Identification at Hammersmith Depot ... 116
7.3 FRA Risk Estimation ... 124
7.4 Fuzzy-AHP Risk Estimation ... 128
7.5 Risk Response Phase ... 134
7.6 Summary ... 140
CHAPTER 8: APPLICATION OF RISK BASED MAINTENANCE DECISION MAKING MODEL TO A RAILWAY TRACK SYSTEM ... 142
8.1 Introduction ... 142
8.2 Risk Assessment of a Track System ... 142
8.2.1 Risk assessment at component level ... 144
8.2.2 Risk assessment at overall system level... 152
8.3 Maintenance Option Decision Making ... 159
8.4 Results and Discussions ... 164
8.4.1 Sensitive Analysis ... 164
8.5 Summary ... 166
CHAPTER 9: CONCLUSIONS AND RECOMMENDATIONS... 168
9.1 Conclusions ... 168
9.2 Recommendations for Future Work ... 171
LIST OF FIGURES
LIST OF FIGURES
Figure 1-1 Research model ... 8
Figure 2-1 Risk management (Rausand et al., 2004). ... 17
Figure 2-2 A top-down safety risk assessment process ... 21
Figure 2-3 A bottom-up assessment approach ... 23
Figure 2-4 An example of a fault tree (Muttram, 2002) ... 25
Figure 2-5 An example of an event tree (Muttram, 2002) ... 26
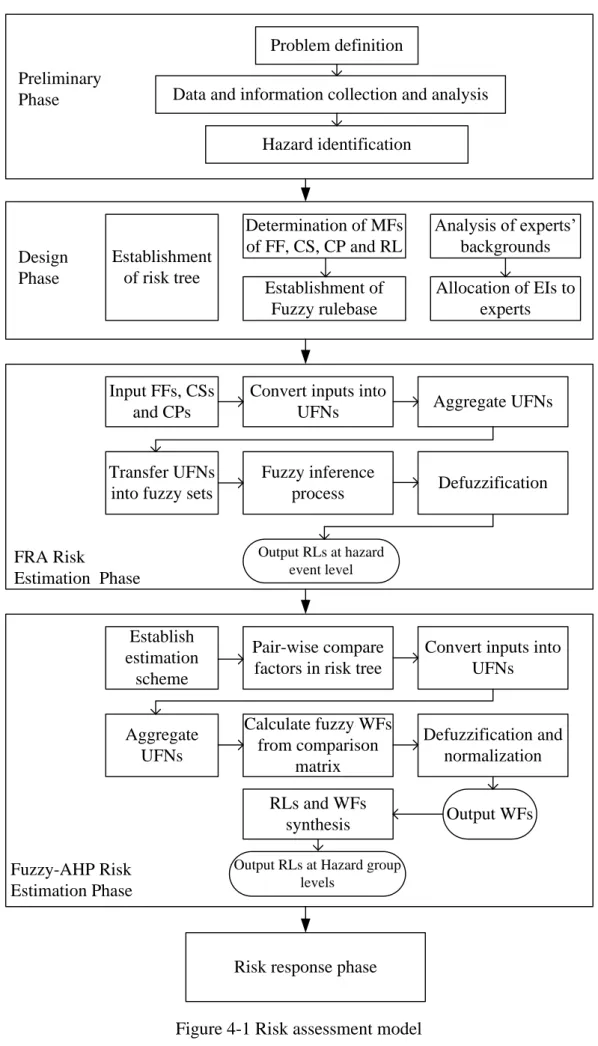
Figure 4-1 Risk assessment model ... 64
Figure 4-2 An example of a risk tree ... 66
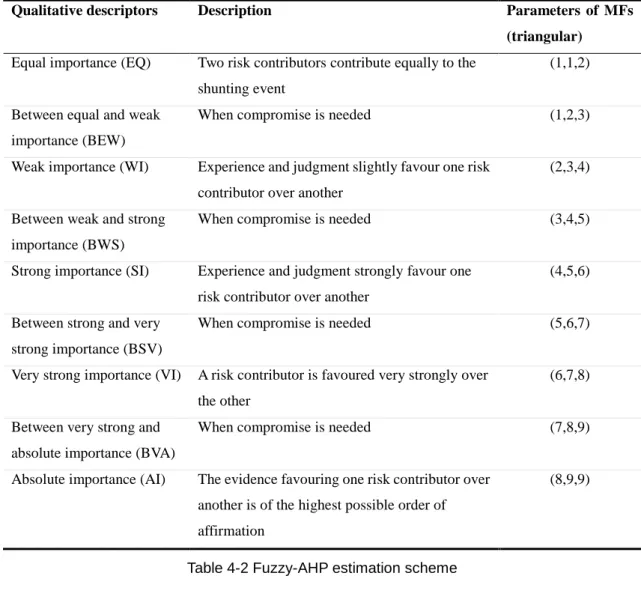
Figure 4-3 MFs of qualitative descriptors in fuzzy AHP estimation scheme ... 75
Figure 4-4 Failure frequency ... 82
Figure 4-5 Consequence severity ... 83
Figure 4-6 Consequence probability ... 84
Figure 5-1 System architecture ... 86
Figure 5-2 An example risk tree in RISRAS ... 91
Figure 5-3 User interface for design of FF, CS, CP and rulebase ... 92
Figure 5-4 Input template Excel file ... 93
Figure 5-5 User interface for Fuzzy-AHP evaluation ... 94
Figure 5-6 User interface for estimation scheme ... 95
Figure 5-7 An example of RISRAS Excel based questionnaire ... 95
Figure 5-8 User interface for risk estimation ... 96
Figure 5-9 RISRAS output results in Excel file... 96
Figure 6-1 Railway asset maintenance management framework ... 101
Figure 6-2 Risk vs Cost... 111
LIST OF FIGURES
Figure 7-3 Using RISRAS in the assessment ... 134
Figure 8-1 The risk tree for track system risk analysis ... 144
Figure 8-2 Fuzzy rule base matrices ... 147
LIST OF TABLES
LIST OF TABLES
Table 2-1 FL categories for qualitative risk ranking matrix ... 29
Table 2-2 CS categories for qualitative risk ranking matrix ... 29
Table 2-3 Qualitative ranking matrix of FL and CS ... 29
Table 2-4 FL categories for semi-quantitative risk assessment ... 31
Table 2-5 CS categories for semi-quantitative risk assessment ... 31
Table 2-6 Numerical risk matrix ... 31
Table 2-7 Risk score matrix ... 31
Table 2-8 Lists of commercial risk assessment software ... 32
Table 3-1 Comparison scheme ... 49
Table 4-1 Experts‟ judgements and corresponding UFNs ... 70
Table 4-2 Fuzzy-AHP estimation scheme ... 75
Table 4-3 Failure frequency ... 82
Table 4-4 Consequence severity ... 83
Table 4-5 Consequence probability ... 84
Table 7-1 Definitions of qualitative descriptors of FF ... 120
Table 7-2 Definitions of qualitative descriptors of CS ... 121
Table 7-3 Definitions of qualitative descriptors of CP ... 121
Table 7-4 Definitions of qualitative descriptors of RL ... 122
Table 7-5 EIs for five experts ... 123
Table 7-6 Expert judgements ... 132
Table 7-7 Pairwise comparison matrixMestablished for Hammersmith depot ... 133
Table 7-8 Final Pairwise comparison matrixM established for Hammersmith depot ... 133
LIST OF TABLES
Table 7-12 Hazard groups‟ risk contribution ranking for Hammersmith depot ... 139
Table 8-1 Definitions of qualitative descriptors of FF for track system ... 145
Table 8-2 Definitions of qualitative descriptors of CS for track system ... 146
Table 8-3 Definitions of qualitative descriptors of CP for track system ... 146
Table 8-4 Definitions of qualitative descriptors of RL for track system ... 147
Table 8-5 RLs of failure modes ... 152
Table 8-6 Expert judgements for components of “Track Component” subsystem .... 158
Table 8-7 Pairwise comparison matrixMestablished for track components ... 158
Table 8-8 Pairwise comparison matrixMestablished for track components ... 159
Table 8-9 Foundation comparison matrix ... 159
Table 8-10 Subsystem comparison matrix ... 159
Table 8-11 Results of risk assessment of track system ... 160
Table 8-12 Maintenance costs ... 161
Table 8-13 Costs of maintenance options and corresponding overall RL of the system ... 162
Table 8-14 Results of preference evolution at each step ... 164
Table 8-15 Maintenance cost increased by 10% and 20% for each component. ... 165
Table 8-16 Costs of maintenance options and corresponding overall RL of the system according to component cost variances by 10% and 20% ... 165
ABBREVIATIONS
ABBREVIATIONS
AHP Analytical Hierarchy Process
AI Absolute importance
ALARP As Low As Reasonably Practicable
BEW Between equal and weak importance
BSV Between strong and very strong importance BVA Between very strong and absolute importance
BWS Between weak and strong importance
CHG Collision hazard group
CS Consequence severity
CP Consequence probability
DHG Derailment hazard group
EFA Equivalent fatality analysis
EHG Electrocution hazard group
EI Expert index
EQ Equal importance
ETA Event tree analysis
FEM Fuzzy Estimation Module
FF Failure frequency
FHG Falls from height hazard group
FL Failure likelihood
FMEA Failure mode and effect analysis
FRA Fuzzy reasoning approach
FTA Fault tree analysis
ABBREVIATIONS
HG Hazard group
HSE Health & Safety Executive
ISO International Organisation for Standardisation
LUL London Underground Ltd
MF Membership function
MCDM Multi-criteria decision making
ODBC Open Database Connectivity
OM Output Module
PHA Preliminary Hazard Analysis
PRA Probabilistic risk analysis
QRA Quantified risk assessment
RL Risk level
RISRAS Railway intelligent safety risk assessment system
RTM Risk Tree Module
RSSB Rail Safety and Standard Board
SHG Slips/trips hazard group
SI Strong importance
SMART Simple Multi-attribute Rating Technique
SRM Safety Risk Model
TfHG Train fire hazard group
TOPSIS Technique for preference by similarity to the ideal solution
TsHG Train strikes person hazard group
UFN Uniform Format Number
VI Very strong importance
WF Weight factor
WI Weak importance
WPM Weighted Product Model
CHAPTER 1: INTRODUCTION
CHAPTER 1:
INTRODUCTION
1.1 Background
Risk, in the railway sector, can be defined in relation to accidents and incidents leading to fatalities or injuries of passengers and employees (Profillidis, 2006). Recent structured hazard identification work within the industry has confirmed high-risk scenarios of the types of accidents such as collision, derailment and fire (Peter et al., 2006). The statistics of accidents and incidents include not only workers, but also a significant number of people not employed in the industry, including children and members of the public. In the UK railway industry, many people have been injured and there even have been fatalities in past years (LUL, 2001). This shows the dangerous nature of the railway industry and demonstrates the need for increased awareness and better safety management (Muttram, 2002). To achieve how that can be assessed effectively, knowledge of the nature and causes of these accidents are fundamental. Therefore, risk analysis plays a central role in the railway safety management framework. The most common hazards in railway system identified by the railway industry over the years (LUL, 2001; Railway Safety, 2002; Metronet, 2005) provide very useful information for risk analysis, for example, derailment hazards, collision hazards, fire hazards, electrocution hazards, fall hazards, train strike hazards, slip/trip hazards, and platform/train interface hazards. The requirement of risk analysis is to demonstrate that: if risks associated with a railway system are high, risk reduction measures must be applied or operation and maintenance have to be reconsidered to reduce the occurrence probabilities or control the possible consequences; if risks are negligible, no actions are required but the information produced needs to be recorded for audit purposes (An et al, 2008; HSE, 2000).
CHAPTER 1: INTRODUCTION
Many risk assessment techniques currently used in the railway industry are comparatively mature tools, which have been developed on the basis of probabilistic risk analysis (PRA), for example, fault tree analysis, event tree analysis, Monte–Carlo simulation, consequence analysis and equivalent fatality analysis (EFA) (LUL, 2001; Railway Safety, 2002; Metronet, 2005; An et al., 2011). The results of using these tools heavily rely on the availability and accuracy of the risk data (LUL, 2001; Railway Safety, 2002; Metronet, 2005). However, in many circumstances, these methods often do not cope well with uncertainty of information. Furthermore, the statistic data does not exist and it must be estimated on the basis of expert knowledge and experience or engineering judgement. Therefore railway risk analysts often face circumstances where the risk data are incomplete or there is a high level of uncertainty involved in the risk data (An et al., 2011). Additionally, railways are a traditional industry, whose history extends for at least two centuries. Much of the safety record of the railways depends upon the concepts developed many years ago and established practices over the whole of its history. The existing databases contain a lot of data and information, however, the information may be both an excess of other information that cannot be used in risk analysis or a shortage of key information of major failure events. There are numerous variables interacting in a complex manner which cannot be explicitly described by an algorithm, a set of equations or a set of rules. In many circumstances, it may be extremely difficult to conduct PRA to assess the failure frequency of hazards, the probability and the magnitude of their possible consequences, because of the uncertainty in the risk data. Although some work has been conducted in this field, no formal risk analysis tools have been developed and applied to a stable environment in the railway industry (Chen et al., 2007). Therefore it is essential to develop new risk analysis methods to identify major hazards and assess the associated risks in an acceptable way in various environments where those mature tools cannot be effectively or efficiently applied. The railway safety problem is appropriate for examination by FRA and fuzzy-AHP.
CHAPTER 1: INTRODUCTION
Usually, the magnitude of a risk can be assessed by considering two fundamental risk parameters: failure frequency (FF) and consequence severity (CS) (An et al, 2006). The FF defines the number of times that an event occurs over a specified period, e.g. number events/year. The CS represents the number of fatalities, major injuries and minor injuries resulting from the occurrence of a particular hazardous event. However, it should be noted that the magnitude of a particular risk also highly depends on the probability that the effects will happen given by the occurrence of the failure. Therefore the probability of a current consequence caused by a particular failure should be taken into consideration in the risk assessment process to obtain a reliable result. In order to assess the risks associated with a railway depot efficiently and effectively, a new risk parameter, consequence probability (CP) is introduced in the proposed risk analysis model to determine the risk level (RL) of a hazardous event. The use of FRA allows imprecision or approximate information involved in the risk assessment process (Bojadziev et al., 1997; An et al., 2006). In this method, a membership function (MF) is regarded as a possibility distribution based on a proposed theory; an apparent possibility distribution expressed by fuzzy set theory is transferred into a possibility measure distribution. The FRA method provides a useful tool for modelling risks and other risk parameters for risk analysis involving risks with incomplete or redundant safety information. Because the contribution of each hazardous event to the safety of a railway system is different, the weight of the contribution of each hazardous event should be taken into consideration in order to represent its relative contribution to the RL of the railway system. Therefore the weight factor (WF) is introduced, which indicates the magnitude of the relevant importance of a hazardous event or hazard group to its belongings in a risk tree. Modified fuzzy-AHP has been developed and then employed to calculate the WFs (Chen et al, 2011). This has been proved to facilitate the use of fuzzy-AHP and provide relevant reliable results. This thesis presents a development of a railway risk
CHAPTER 1: INTRODUCTION
engineers and decision makers with useful information to improve safety management and set safety standards.
As stated earlier in this Chapter, if risks are high, risk reduction measures must be applied or maintenance work must be considered to reduce the occurrence probabilities or control the possible consequences. If risks are negligible, no actions are required, but the information produced needs to be recorded for audit purposes. However, the acceptable and unacceptable regions are usually divided by a transition region. Risks that fall in this transition region need to be reduced to as low as reasonably practicable (ALARP). In other words, “cost-effective” measures should be applied. In this case, selecting the optimal maintenance strategy among many alternatives based on cost and safety analysis is a multi-criteria decision making (MCDM) problem, which can usually be solved by optimisation techniques. The literature search indicates that traditional cost-benefit analysis based on simple comparisons cannot be applied to this process. This study also presents a risk-based maintenance decision making model by using the TOPSIS technique which synthesises the risk and cost models to produce the preference degree of each maintenance option. Once preference degrees of all maintenance options in hand are produced, the best option can be chosen. In this model, both the risk associated with a railway asset system and the costs incurred in each maintenance option are mapped onto a utility space and assessed in accordance with the respective constraints. The proposed decision making model could be an effective tool to get a better understanding of risks associated with railway asset systems and make better maintenance decisions at the right time for managing the risks under various conditions.
1.2 Aims
The primary aim of this study is to develop and improve railway safety risk models further in order to meet the needs of industry and to apply the safety risk prediction
CHAPTER 1: INTRODUCTION
system in a real environment with industry partners. In particular, this system could be applied to define risks and the numerical levels of expectation. This will support the industry‟s efforts to run the rail network with normal service while keeping risks ALARP. This project also sets out to facilitate effective maintenance planning for railway vehicle and infrastructure operators, engineers and health & safety advisors. The secondary aim is to investigate how intelligent safety analysis techniques can provide insights into the ways that risks contribute to accidents, for example, collisions, derailments and fires, via case studies and the determination of the most appropriate maintenance for various conditions. Therefore, The study is
To: enable improved safety through design, diagnosis and maintenance of railway systems.
For: rail vehicles, infrastructure operators, track & civil engineering designers and maintainers, as well as health & safety advisors.
By: developing safety risk models and tools using FRA and AHP techniques to railway safety risk assessment and decision making processes.
1.3 Objectives
The specific objectives of this research project are:
1 To investigate further railway safety risk assessment tools as used in practice and in research literature worldwide.
2 To develop further railway safety risk models and tools to facilitate railway safety risk analysis. Safety risk models based on FRA combined with AHP techniques will be established for processing safety risk assessment efficiently and effectively. 3 To validate the proposed railway safety risk system via case studies with industrial
partners.
CHAPTER 1: INTRODUCTION
1.4 Research Methodology
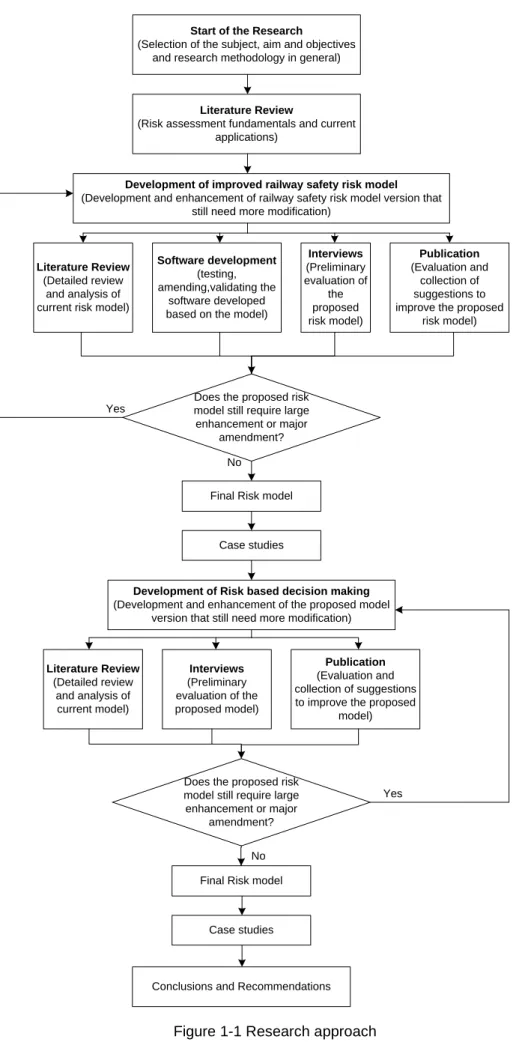
The metrologies during the research life-cycle are presented in Figure 1-1. The research will start with the selection of the subject, aim, objectives and research methodologies in general. And then a comprehensive literature review will be carried out on risk assessment methods, decision-making approaches and current applications in practice. After that, an improved railway safety risk model and risk-based decision making will be developed, reviewed and improved through literature review, interviews and publications. In the meantime, a prototype of software tool will be developed as well. Finally, the application of above approaches will be placed at the end of each developing cycle. The following stages are summarized as the followings:
1 Review of relevant literature on railway safety risk assessment techniques and decision-making approaches. The major parameters (rail & vehicles) that influence the decisions concerning which maintenance option is selected will be studied in detail. The techniques used to select a maintenance option based on cost and safety risk analysis will be reviewed. All the selection processes will be studied in detail, together with the level of confidence associated with decision making.
2 Development of safety risk assessment approaches for facilitating railway safety risk analysis. The safety risk assessment model will be developed based on FRA Fuzzy-AHP techniques to facilitate risk analysis where there is a high level of uncertainty or data incomplete.
3 Prototype software tool. A prototype software tool will be developed which will be compatible with a PC platform in C++. Case study materials will be obtained from industrial partners to test the developed system in order to enable the system can be used in practice efficiently and effectively; which can also be developed further by a partner into commercial software.
4 Development of advanced maintenance procedures to minimise risks. Multi-objective decision-making techniques will be investigated in order to select the best solution for railway maintenance decision making.
CHAPTER 1: INTRODUCTION
5 Application of the above approaches to a railway safety case. The developed safety risk analysis models and software system will be applied to a railway operation and maintenance study.
CHAPTER 1: INTRODUCTION
Figure 1-1 Research approach
Final Risk model
Development of Risk based decision making (Development and enhancement of the proposed model
version that still need more modification)
Conclusions and Recommendations Case studies Start of the Research
(Selection of the subject, aim and objectives and research methodology in general)
Literature Review
(Risk assessment fundamentals and current applications)
Development of improved railway safety risk model (Development and enhancement of railway safety risk model version that
still need more modification)
Literature Review (Detailed review
and analysis of current risk model)
Software development (testing, amending,validating the
software developed based on the model)
Interviews (Preliminary evaluation of the proposed model) Publication (Evaluation and collection of suggestions to improve the proposed
risk model) Literature Review (Detailed review and analysis of current model) Publication (Evaluation and collection of suggestions to improve the proposed
model) Interviews (Preliminary evaluation of the proposed risk model)
Does the proposed risk model still require large enhancement or major
amendment?
Final Risk model
Case studies Does the proposed risk model still require large enhancement or major amendment? Yes Yes No No
CHAPTER 1: INTRODUCTION
1.5 Research outcomes
The research outcomes are:
Literature survey and benchmark reports of current best practice for safety risk assessment in the railway industry. Flow charts showing comparative safety risk assessment processes for railway by conventional (statistical and probabilistic) techniques, fuzzy reasoning techniques and expert inputs.
Safety risk assessment models for the issues where prediction is currently weakened by inadequate or inconsistent data.
A robust safety risk analysis framework that will provide a platform where risks associated with the railway system can be assessed effectively and efficiently, so that railway maintenance decisions can be made.
A supporting prototype software to facilitate the application of the anticipated approaches.
A risk based decision making system that will provide decision makers very useful information for their decisions on maintenance options or strategies.
In addition, five research papers have been published at international conferences and in academic journals. They are:
1. M. An, Y. Chen and C. J. Baker, 2011. A fuzzy reasoning and fuzzy-analytical hierarchy process based approach to the process of railway risk information: A railway risk management system. Information Sciences, 181(18), 3946-3966. (Please see Appendix)
2. Y. Chen, M. An, 2011. Application of a modified Fuzzy-AHP methodology to railway risk decision making process. Proceedings of the International Railway Engineering Conference (REC 2011), CD format, London, UK, ISBN 0-947644-69-5.
CHAPTER 1: INTRODUCTION
Safety, ISBN 0-479622-23-13, pp.1-6.
4. S. Huang, M. An, Y. Chen, C. J. Baker, 2007. Railway safety risk assessment using FRA and fuzzy AHP approaches – a case study on risk analysis of shunting at Waterloo depot. Proceedings of the 2nd IET International Conference on System Safety, London, UK., pp. 35-38
5. Y. Chen, M. An, S. Huang, C. J. Baker, 2007. Application of FRA and FAHP approaches to railway maintenance safety risk assessment process. Proceedings of the 9th International Railway Engineering, CD format, ISBN 0-947644-61–10.
1.6 Structure of the Thesis
The thesis is organised into nine chapters. Chapter 1 is the introduction to this study including aim and objectives of the research project and research methodologies adopted in the study.
Chapter 2 then reviews railway safety issues, top-down and bottom-up risk assessment approaches, and current railway safety risk assessment methods including qualitative, semi-qualitative and quantitative approaches.
Chapter 3 discusses the concept of fuzzy expression covering fuzzy set and fuzzy number. The fundamentals of FRA and Fuzzy-AHP in terms of fuzzy expression are outlined. Finally, a modified Fuzzy AHP is introduced in this chapter.
Chapter 4 presents the development of an improved railway safety risk model by using the modified Fuzzy-AHP approach. The process of such a railway safety risk assessment model at each phase is described and a third parameter, CP, is introduced.
Chapter 5 describes the software development based on the proposed railway safety risk model including detailed design of logic layers, features and application of this
CHAPTER 1: INTRODUCTION
software in railway safety risk assessment.
Chapter 6 presents the development of a new risk-based decision making approach. It involves a safety risk model, a cost model and a risk-cost model. The TOPSIS approach is applied to optimise the selection of maintenance options in terms of risk and cost.
Chapters 7 and 8 present two case studies collected from railway industry: risk assessment of shunting at Hammersmith depot and risk assessment of a track system, by applying the proposed safety risk model and risk based decision making approach. The results indicate that the railway safety risk can be assessed more efficiently and effectively by using the proposed methodologies.
Finally, Chapter 9 concludes the main benefits of using the developed railway safety risk model. Many interesting findings lead to some recommendations for further works which are suggested at the end.
CHAPTER 2: LITERATURE REVIEW
CHAPTER 2:
LITERATURE REVIEW
2.1 Introduction
This chapter reviews and discusses potential problems related to railway safety and major types of railway accidents. The definitions of risk and risk assessment are also discussed. And top-down and bottom-up risk assessment approaches are described. The qualitative, semi-quantitative and quantitative risk assessments are discussed as well, which will form the basis of the development of new risk assessment techniques.
2.2 Railway Safety
While the safety level of rail transport is far higher than other transport modes, there exist possibilities to further enhance railway safety. According to the International Organisation for Standardisation (ISO), safety can be defined as the release from unacceptable risks, a risk being a combination of probability and of gravity of harm. In the railway sector, the risk can be defined in relation to the events that damage safety (fatalities or injuries of passengers or employees) or transportation stability (delay) (Profillidis,2006).
2.2.1
Potential safety problems
In order to avoid accidents, appropriate railway maintenance and safety measures should be put in place after suitable investigations to provide safe and economical train transportation (Rasaiah, 2002). However, railway science is a complicated subject, which is interdisciplinary and requires competences of civil engineers, economists, electrical and mechanical engineers and managers. Thus, following railway network reorganisation, it has become customary to distinguish railway science into three topic areas (Profillidis,2006):
CHAPTER 2: LITERATURE REVIEW
ensure the safe operation of the rolling stock at the scheduled speed. The superstructure (e.g. rails, sleepers, fastenings, ballast or concrete slab) and the subgrade are central subjects of track topics. Track topics also include layout, stations, switches and crossing, maintenance and safety issues.
(2) Traction topics: subjects concerning rolling stock are elaborated on. Traction topics also include electric traction, telecommunications and signaling; however, a certain railway includes these in the area of track topics, since they are parts of the permanent railway infrastructure.
(3) Operation topics: including commercial operations in which commercial and pricing policies are analysed and technical operations where issues concerning schedule organisation and optimum use of rolling stock and traffic safety are examined.
To the above should be added the topic of metropolitan railways (metros and tramways), which constitute a specific railway class of their own great importance to mass transit in large urban centres. However, after separation from operation, track topics, electrification, telecommunication, signalling, and technical operations belong to the responsibilities of infrastructure controllers, whereas rolling stock operation and maintenance and commercial operation belong to the responsibilities of railway operators. Railway stations may be studied either in infrastructure or operation, depending on where the station best belongs.
Railway science is, therefore, a complicated subject which is interdisciplinary and requires competences from the sectors of civil engineering, economics, electrical and mechanical engineering and management. The hazard checklist for railways could list the potential hazards in such areas. It has to include mechanical hazards, electrical hazards, thermal hazards, thermodynamic hazards, hazards generated by noise, hazards
CHAPTER 2: LITERATURE REVIEW
faulty conditions (indirect contact), approaching live parts under high voltage, and thermal radiation or other phenomena such as the projection of molden particles and chemical effects from short circuits, overloads, etc. Thermal hazards include burns, scalds and other injuries by a possible contact between a person and objects or materials with an extremely high or low temperature, by flames or explosions and also by radiation of heat sources, and damage to health from a hot or cold working environment etc.
2.2.2
Major types of railway accidents
Accidents are the results of complicated combinations of various factors such as the number of trains, the number of passengers and freight, safety equipment (signalling and speed control), the surrounding environment and human factors. Usual forms of rail accidents are: collision, derailment, fire, accidents during maintenance works, with pedestrians at platforms, and etc. There are five major types of structurally significant accidents in the United Kingdom (Rasaiah, 2002) which are end-on collisions, side-on collisions, buffer stop collisions, level crossing collisions and derailments (including those caused by obstacle strikes, broken rails and running gear).
For example, in a topical railway depot, accidents and incidents can be categorised into ten groups as(Metronet, 2005):
(1) The derailment hazard group, which consists of a number of hazardous events such as: track related faults including mechanical failure of track, e.g. broken rail and fishplates; signalling related faults including mechanical failure of signals and points; rolling stock faults including mechanical failure of rolling stock, e.g. brakes, axles and bogies; structure failure including collapsed drain or civil structure beneath track leading to derailment; object from a train including object falling from a train (e.g. motor) leading to derailment (such as the Chancery Lane incident); human error including human error causing derailment, e.g. speeding, incorrect routing, etc. (2) The collision hazard group, which includes collision between trains and collision
CHAPTER 2: LITERATURE REVIEW
hazards. Collision hazards include events such as: a collision with an object on a track; collision with a terminal, e.g. overrunning at the end of any of the depot roads; collision with platforms involving both the track and/or the train being out of gauge without anybody noticing it; collision with other civil structures involving track/train being out of gauge and nobody noticing.
(3) The train fire hazard group includes events of arcing from the conductor rail causing train fire, and electrical, oil or hydraulic failure leading to train fire.
(4) The electrocution hazard group covers a number of hazardous events, for example: contact with the conductor rail while entering/leaving cab; contact with the conductor rail while walking to the train; plugging in gap jumper leads if the train is stalled/gapped; flooding, e.g. sumps or pumps leading to surface water; and conducting electricity from conductor rails, etc.
(5) The slips/trips hazard group includes, for example, instances when the shunter is required to leave train and risks to other persons involved in the move and instances when a person is required to approach the train when it is stalled/gapped.
(6) The falls from height hazard group covers falls from a height, such as when a shunter leaves the train cab.
(7) The train strikes person hazard group covers events where a train strikes an authorized person including other depot workers (e.g. ground shunter) or track side staff and where the train strikes an unauthorized person, e.g. trespassers, etc.
(8) The platform train interface hazard group, which covers the train hitting a person on the platform. For example, train moves will not take place with passengers present (either outside of passenger hours or when the platform is closed for a move). Persons are considered at risk including station staff and contractors.
(9) The structural failure hazard group, in which the hazardous events cover scenarios of partial or catastrophic collapse of structures the hitting train, e.g. wall collapse, train wash collapse, ceiling collapse and cables/pipes becoming loose, etc.
CHAPTER 2: LITERATURE REVIEW
In order to minimise risk, railway safety risk assessments need to be carried out. If a risk event falls into a high risk band, risk reduction measures must be applied or maintenance work has to be considered to reduce the occurrence probabilities of the risk event, or to control its possible consequences. If a risk event falls into a negligible risk band, no actions are required but the information produced from risk assessment needs to be recorded for audit purposes (An et al., 2006 & 2007).
2.3 Overview of Railway Safety Risk Assessment
2.3.1
Definitions
Risk is defined as:
“Risk is the combination of the probability of an event and its consequences,” (ISO, 1999);
“Risk is the likelihood that a hazard will actually cause its adverse effects, together with a measure of the effect,” (HSE, 2005).
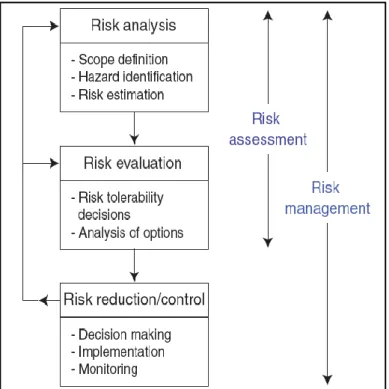
It can be seen that a risk is a certain hazard occurring and its adverse consequences. Risk management is defined as the culture, process and structures that are directed towards the effective management of potential opportunities and adverse effects (Rausand et al., 2004). Figure 2-1 shows a risk management system. The risk management process is the systematic application of management policies, procedures and practices to the tasks of establishing the context, identifying, analysing, evaluating, treating, monitoring and communicating the risk.
Risk assessment is an essential part within risk management system. It includes an overall process of risk analysis and risk evaluation. Risk analysis is the systematic use of available information to identify hazards and to estimate the risks of a railway system. Risk evaluation is a process to determine risk management priorities by comparing the level of a risk against predetermined standards, target risk levels or other
CHAPTER 2: LITERATURE REVIEW
criteria, e.g. HSE safety risk regulations.
With railways, especially for railway safety management and railway safety case preparation, risk is assessed in the context of safety. Railway safety risk assessment is based on an assessment of the risk resulting from hazardous events which can occur as a result of the duty holder‟s operations which have the potential to lead to fatalities, major or minor injuries to passengers, staff or members of the public. It is an important tool to aid decision-making, thus it is an important part of successful railway safety risk management.
Figure 2-1 Risk management (Rausand et al., 2004)
2.3.2
Current risk assessment
The Management of Health and Safety at Work Regulations 1974 require employers to assess the health and safety risks involved in all work activities. Nowadays, risk
CHAPTER 2: LITERATURE REVIEW
is usually divided into three phases: hazard identification, risk estimation and risk response.
The hazard identification phase seeks to identify the risks to be managed. Comprehensive identification using a well-structured systematic process is critical because a risk that has not been identified cannot be managed risk is assessed in the context of safety. The aim of hazard identification is to generate a comprehensive list of sources of risks and events that might have an impact on the achievement of each objective identified in the context. The most popular techniques used to identify hazards include checklists, expert and engineering judgements, brainstorming approach, system analysis, scenario analysis etc. (AS/NZS, 1999). The application of these techniques will depend on the nature of the activities under review, types of risks, the organisational context and the purpose of the risk management (Rausand et al., 2004).
In the risk estimation phase, risk is estimated and evaluated on the basis of likelihoods and consequences of hazardous events identified in the hazard identification phase. A qualitative, or semi-quantitative, or quantitative risk assessment or a combination of these three may be applied to evaluate risk level of each hazard event depending on the circumstances. Various risk analysis techniques might be used, such as fault tree analysis (FTA) (Vesely et al., 1981), event tree analysis (ETA) (Crawley and Tyler, 2003), FMEA (Stamats, 1995), HAZOP (Crawley and Tyler, 2000), fuzzy reasoning approach (FRA) and fuzzy analytical hierarchy process (AHP) (An et al., 2006 & 2007). The application of these techniques will also depend on the availability of information required during risk analysis. For example, if there is a great uncertainty involved in the risk data, FTA and ETA may not be suitable to use, whereas FRA and fuzzy AHP will be appropriate, which will be discussed later in this thesis.
The purpose of the risk response phase is to make decisions, based on the outcomes of the risk estimation, about which risks need a treatment and treatment priorities. The risk response phase involves comparing the level of risk found during the analysis process
CHAPTER 2: LITERATURE REVIEW
with risk criteria established when the context was considered. The objectives of the organisation and the extent of opportunity that could result should be considered. Where a choice is to be made between options, higher potential losses may be associated with higher potential gains and the appropriate choice will depend on an organisation‟s context. If risks are high, risk reduction measures must be applied or maintenance work has to be considered to reduce the occurrence probabilities or to control the possible consequences. If risks are negligible, no actions are required but the information produced needs to be recorded for audit purposes. These two circumstances are categorised respectively into the unacceptable region and the acceptable region. There is usually a transition region between these two regions. A risk that falls within this transition region needs to be reduced to ALARP. All railway duty holders are required to manage and reduce risks to ALARP to ensure the safety of staff, passengers and the publics.
2.3.3
Top-down and bottom-up risk assessment approaches
Railway safety risk analysis is a complex subject. Efficient use of risk analysis methods in the risk assessment process involves the study of the characteristics of each risk analysis method and assessment process in terms of the way in which risk analysis is carried out. A safety risk assessment method may be classified as either a top-down approach or a bottom-up approach by studying the way in which risks associated with a railway system are identified (An et al, 2000, 2006 and 2007; Wang et al, 1998).
Railway safety risk analysis may be summarised to answer the following four questions (An et al., 2000a; Hashemi et al., 1995; Wang, 1998):
1. What can go wrong?
CHAPTER 2: LITERATURE REVIEW
To answer the above questions, an actual railway system must be examined to identify and assess potential hazardous situations and associated risks in order to provide a rational basis for determining where risk reduction measures are required.
Either a top-down or a bottom-up safety risk analysis approach can be used to identify accident scenarios. The decision as to which kind of analysis is more appropriate is dependent on the availability of the safety risk data and information of the railway system being studied, the indenture level of analysis required, the degree of complexity of the inter-relationships of the components and sub-systems, and the level of innovation.
2.3.3.1. Top-down risk assessment approach
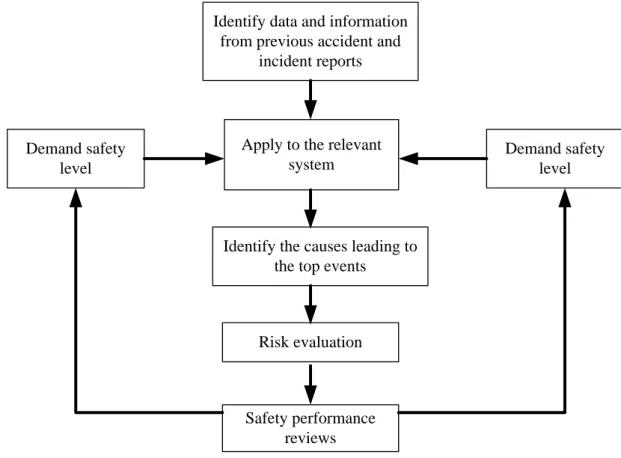
A top-down safety risk assessment process, as shown in Figure 2-2, starts with the study of previous accident and incident reports. After the top events which must be studied further have been determined, the causes leading to them are then identified deductively in increasing detail until all of the causes are identified at the required level of resolution. In a top-down safety risk assessment approach, both qualitative analysis and quantitative analysis can be carried out to estimate and evaluate risks regarding the demand for safety. A risk response can then be undertaken by making use of the information produced from the safety risk assessment, to close the loop of the risk assessment process.
CHAPTER 2: LITERATURE REVIEW
Figure 2-2 A top-down safety risk assessment process (An et al, 2000a and b)
For simple systems, a top-down risk assessment approach may prove convenience and time-saving, because it only deals with failure paths leading to particularly serious system failure events by studying the relationships of the subsystems and components, and the risk data from previous accidents and incident reports of similar systems. Obviously, experience, good judgement and understanding of the system are very important for an efficient and effective use of this approach.
However, for large systems such as a railway system, there will often be a lack of knowledge or experience regarding the determined system solutions and their possible effects on safety. In such a case, the top-down approach may have the following problems (Wang, 1997; An et al., 2000a and b):
data and information may not be available from previous accident and incident reports of similar systems;
Identify data and information from previous accident and
incident reports
Apply to the relevant system
Demand safety level
Identify the causes leading to the top events
Risk evaluation
Safety performance reviews Demand safety
CHAPTER 2: LITERATURE REVIEW
deductive characteristics in a top-down safety risk assessment process may not address the complex interactions present in a complex system in a rigorous way.
Therefore, a bottom-up risk assessment approach is required.
2.3.3.2. Bottom-up risk assessment approach
In a bottom-up safety risk assessment process, a system to be analysed can be broken down into subsystems which can be further broken down to components in order to identify all possible hazards. The hazard identification can be initially carried out at the component level, and then progressed firstly up to the subsystem level and finally to the system level. All combinations of possible failure events at both of the component and the subsystem levels may be studied to identify all the possible system failure events. The analysis at subsystem level may make use of the information produced at the component level. Finally, risk evaluation and review can be conducted.
A bottom-up risk assessment process is shown in Figure 2-3. In this approach, risk assessment can be initially carried out at the component level, and then progressed up to the subsystem level and finally to the system level. Risk estimation can also be conducted in a similar manner. The information produced from the risk estimation phase can be evaluated together with a risk review.
CHAPTER 2: LITERATURE REVIEW
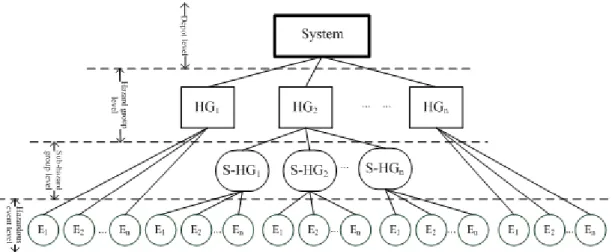
Figure 2-3 A bottom-up assessment approach (An et al, 2000a and b)
The use of a bottom-up risk assessment process yields a higher level of confidence that all of the failure events of a railway system and their respective causes are identified. Therefore, compared with the top-down approach, the bottom-up approach has the following characteristics (Wang 1997, An et al. 2000a and b):
omission of system failure events and their respective causes are less likely; it may be more convenient to incorporate into a computer package;
it may be more suitable to apply to safety risk analysis of a large railway system with a high level of uncertainty.
In railway safety risk analysis, the risk assessment of a railway system is often a hierarchical process where risk assessments at higher levels (i.e. system) are determined by the safety risk assessment at lower levels (i.e. component/subsystem).
Problem definition
Hazard identification from component level to system level
Risk estimation from component level to system level
Analytical results
CHAPTER 2: LITERATURE REVIEW
the development of a safety risk assessment model. The use of a bottom-up safety risk assessment approach can obtain a higher level of confidence that all of the failure events of a railway system and their respective causes are identified. Therefore, the development of a railway safety risk model adopts a bottom-up safety risk assessment process. Details of the developed railway safety risk model are described in Chapter 4.
2.3.4
Quantitative and qualitative railway safety risk assessments
Risk assessment may be undertaken to varying degrees of detail depending upon the risk, the purpose of the analysis, and the information, data and resources available (AS/NZS, 1999). Thus, assessment may be quantitative, qualitative, or semi- quantitative. Literature review indicates that such types of risk assessment approaches are widely used in the railway safety risk management (Railway Safety, 2002; Muttram, 2002; MR 2005).
2.3.4.1. Quantitative risk assessments
Quantitative risk assessment uses numerical values for both consequences and likelihood by reviewing risk data and information from a variety of sources, such as past accidental records, statistics and databases. The quality of the analysis depends on the accuracy and completeness of the numerical values and the validity of the models used. The aim of quantitative risk assessment is to provide design engineers and safety managers with the quantified occurrence probability of each serious failure condition and the possible consequences, so that potential risks associated with a railway system can be understood (AS/NZS, 1999).
FTA and ETA are two commonly used quantitative assessment techniques to study risks associated with a railway system. A SRM (Muttram, 2002) was developed on the basis of these two techniques by Railway Safety and is used to assess the risk of major hazards in railways. It can provide a structured representation of the causes and consequences of potential accidents arising from railway operations and maintenance
CHAPTER 2: LITERATURE REVIEW
on the mainline railway.
FTAis a top-down approach to failure analysis, starting with a potential undesirable event (accident) called as a TOP event, and then determining all the ways in which it can happen. The analysis proceeds by determining how the TOP event can be caused by individual or combined lower level failures or events. The causes of the TOP event are “connected” through logic gates, i.e. AND-gates and OR-gates. An example of a fault tree is shown in Figure 2-4. (Muttram, 2002)
Figure 2-4 An example of a fault tree (Muttram, 2002)
The top event of the fault tree in Figure 2-4 is identified as “Passenger train derailment”. It is linked by an OR gate with four basic events at level 1 i.e. “Derailment due to rolling stock faults”, “Derailment due to track faults”, “Derailment due to running into obstructions” and “Derailment due to over-speeding”. This means that the top event happens if any one of these basic occurs at level 1. Another three events at level 2 can also be identified as “Broken rail leading to derailment”, “Buckled rail leading to
Passenger train derailment/train mile
travelled
Derailment due to rolling stock faults
Derailment due to track faults Derailment due to running into obstruction Derailment due to overspeed
Broken rail leading to derailment
Buckled rail leading to derailment
Track twist leading to derailment
Top event
Level 1
Level 2 4.3E-08
8E-09 1.3E-08 7E-09 1.5E-08
CHAPTER 2: LITERATURE REVIEW
failure likelihood of the top event is the sum of the four events at level 1.
FTA can identify all the possible causes of a specified undesired event (TOP event), and lead to improve understanding of system characteristics. Design flaws and insufficient operational and maintenance procedures may be revealed and corrected during the fault tree construction. However, FTA is not suitable for modelling when the available data are of poor quality (AS/NZS 4360, 2004).
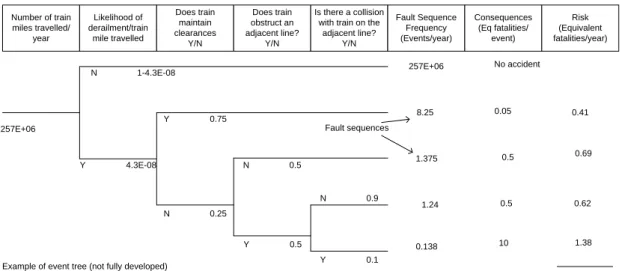
ETA is often the partner of fault tree analysis. It is an inductive procedure that shows all possible outcomes resulting from an accidental (initiating) event, taking into account whether installed safety barriers are functioning or not, and additional events and factors (AS/NZS, 1999). By studying all relevant accidental events, the ETA can be used to identify all potential accident scenarios and sequences in a complex system. Design and procedural weaknesses can be identified, and probabilities of the various outcomes from an accidental event can be determined. An example of an event tree is shown Figure 2-5:
Figure 2-5 An example of event tree (Muttram, 2002)
The example demonstrates how an event tree is used to evaluate the consequences of train derailment. Suppose that train miles travelled are 257E+06 miles per year. There are two branches (i.e. “Yes (Y), derailment” and “No (N), non-derailment”) for each
Number of train miles travelled/ year Likelihood of derailment/train mile travelled Does train maintain clearances Y/N Does train obstruct an adjacent line? Y/N Is there a collision with train on the
adjacent line? Y/N Fault Sequence Frequency (Events/year) Consequences (Eq fatalities/ event) Risk (Equivalent fatalities/year) 257E+06 No accident 8.25 0.05 0.41 1.375 0.5 0.69 1.24 0.5 0.62 0.138 10 1.38 Collective Risk=3 257E+06 N 1-4.3E-08 Y 4.3E-08 N 0.25 Y 0.75 N 0.5 Y 0.5 Y 0.1 N 0.9 Precursors (Consquence)
Example of event tree (not fully developed)
CHAPTER 2: LITERATURE REVIEW
decision junction for the probability of derailment. FTA is often applied to estimate the likelihood of the initiating event. In this case, 4.3E-08 is the likelihood of a derailment. Thus, the likelihood of non-derailment is “1-4.3E-08” and no accident train miles travelled is nearly 257E+06 miles per year. Then, according to probability of each branch, the fault sequence frequency through each branch can be calculated. For example, if a derailment occurs and there are no effects on other lines or trains, the fault sequence frequency is 8.25 events per year, which is the product of the number of train miles i.e. 257E+06, the likelihood of derailment i.e. 4.3E-08 and the probability of the branch i.e. 0.75. The consequence of this scenario is 0.5 equivalent fatalities per event, so that the risk of this scenario is 0.69 equivalent fatalities per year, which is the product of frequency and consequences. Then, risk of derailment is calculated as the sum of risk under each scenario, which is 3 equivalent fatalities per year in this case example.
As ETA can visualise event chains following an accidental event, barriers and sequences of activation, it is a good basis for evaluating the need for new/improved procedures and safety functions. However, there is no standard for the graphical representation of the event tree, and only one initiating event can be studied in each analysis. In addition, the analyst must be well trained and experienced to ensure an effective study of a railway system. Furthermore, requirement of data quality is relatively high (HSE 2001).
By using quantitative risk assessment, the potential causes and consequences of a hazard event and characteristics of a system can be identified, assessed and understood. But the quality and validity of the assessment highly rely on the availability, accuracy and completeness of risk data. A full quantitative risk assessment would be extremely time consuming and expensive. (AS/NZS, 1999; AS/NZS 4360, 2004).
CHAPTER 2: LITERATURE REVIEW
knowledge and judgement of the person who carries out the assessment. Safety risk analysts can use words to describe the magnitude of potential consequences and the likelihood that those consequences will occur. These scales can be adapted or adjusted to suit the circumstances. For example, failure likelihood is usually expressed in a linguistic manner such as “Rare”, “Occasional”, and “Regular”; consequence severity is identified as “Negligible”, “Moderate”, and “Severe”; and risk can be expressed as “Low”, “Medium”, and “High”. Qualitative risk assessment can be fulfilled by various techniques such as interviews, checklists and brainstorming techniques (Thompson and Perry eds., 1992). On the basis of risk assessment results, measures can be taken to eliminate or control hazards.
In practice, Preliminary Hazard Analysis (PHA) (MIL-STD-882D, 1983) and Hazard & Operability (HAZOP) (Kyriakdis, 2003) studies are typical qualitative risk assessment techniques. The HSE has identified a “5-step approach to Risk Assessment” (HSE, 1998) based on PHA to easily conduct qualitative assessment. The five steps are summarised as follows:
1. Identify the hazard.
2. Decide who might be harmed and how. 3. Evaluate the risks and decide on precautions. 4. Record findings and implement them.
5. Review risk assessment and update if necessary.
A risk ranking matrix is normally adopted to evaluate the risks in the assessment, which is also one of the most important qualitative methods and has been widely used in railways, where the failure likelihood (FL) and consequence severity (CS) can be combined in a two-dimensional matrix for risk level allocation based on expert judgements. For example, FL is described as “Rare”, “Occasional” and “Frequent” as shown in Table 2-1. CS is described as “Negligible”, “Moderate”, and “Frequent” as shown in Table 2-2. By combining FL and CS, a risk ranking matrix can be developed as shown in Table 2-3, in which a risk level is described as “Low”, “Medium”, and “High”. Based on Table 2-1 and Table 2-2, the magnitude of the risk of a hazard event
CHAPTER 2: LITERATURE REVIEW
can be determined by using the risk ranking matrix. For example, when a hazard event has “Frequent” of FL and “Severe” of CS, the risk level of this event is “High” which can be determined according to the risk ranking matrix.
Index FL Meaning
1 Rare Occurrence is unlikely 2 Occasional Few occurrences 3 Frequent Repeated occurrence
Table 2-1 FL categories for qualitative risk ranking matrix
Index CS Meaning
1 Negligible Slight injury no absence from work
2 Moderate An injury with the potential of absence from work for few days 3 Severe Serious injury, even single/ multiple fatality
Table 2-2 CS categories for qualitative risk ranking matrix
CS
Negligible Moderate Severe
FL
Rare Low Low Medium
Occasional Low Medium High
Frequent Medium High High
Table 2-3 Qualitative ranking matrix of FL and CS
Qualitative risk assessment may be used where the numerical data or resources are inadequate for a quantitative analysis. It relies on subjective judgements to assess the risk level of a hazard event, which therefore cannot provide precise results. A semi-quantitative assessment may provide a better understanding of the risks associated with a railway system which is described in the next section.
CHAPTER 2: LITERATURE REVIEW
section 2.3.4.2 are given. The objective is to produce a more expanded ranking scale than is usually achieved in qualitative assessment, not to suggest realistic values for risk such as is attempted in quantitative assessment (AS/NZS, 1999). The value allocated to each description may not be an accurate relationship to the actual magnitude of consequences or likelihood, and those numbers can only be combined using a formula that recognises the limitations of the kinds of scales used (AS/NZS 4360:2004).
Failure modes and effects analysis (FMEA) (SEMATECH, 1992) is a typical semi-quantitative risk assessment technique. The application of this technique aims to identify and analyse all potential failure modes of various parts of a system as well as the effects that these failures may have on the system. The guidance from Railway Safety (2002) describes a method based on FMEA to conduct a semi-quantitative risk assessment within the railway safety case. As described earlier in this thesis, FL and CS are assigned numerical values in accordance with the corresponding categories based on professional judgement as shown in Table 2-4 and Table 2-5. For example, a hazard event with an occurrence of around 31.25 per year is defined as a frequent event. If the hazard event causes around 3.125 equivalent fatalities, the consequence is defined as a severe consequence.
On the basis of the newly defined FL and CS categories, either a numerical risk or risk score of a hazard event can be obtained from the product of its FL and CS numerical values or the summation of its FL and CS ranking indices:
Numerical risk= FL numerical value
CS numerical value Risk score= FL ranking index + CS ranking indexFor example, a hazard event has a FL of “Frequent”, which is assigned 31.25 failures per year and CS is “Severe” with 3.125 equivalent fatalities with every failure. The numerical risk is 97.66 equivalent fatalities per year, and the risk score is 6. By comparing with the values in the numerical risk matrix of Table 2-6 and risk score
CHAPTER 2: LITERATURE REVIEW
matrix of Table 2-7, it can be concluded that the risk level of such a hazard event has a “high” risk level.
Ranking index
FL Meaning Approximate numerical value (events/year)
1 Rare Occurrence is unlikely 0.05 2 Occasional Few occurrences 1.25 3 Frequent Repeated occurrence 31.25
Table 2-4 FL categories for semi-quantitative risk assessment
Ranking index
CS Meaning Approximate numerical value (equivalent fatalities/event) 1 Negligible Slight injury no absence from work 0.005
2 Moderate An injury with the potential of absence from work for few days
0.125 3 Severe Serious injury, even single/ multiple
fatality
3.125
Table 2-5 CS categories for semi-quantitative risk assessment
CS 0.005 0.125 3.125 FL 0.05 2.5E-4 6.25E-3 0.16 1.25 6.25E-2 0.16 3.91 31.25 0.16 3.91 97.66
Table 2-6 Numerical risk matrix
CS
1 2 3
FL
1 2 3 4
CHAPTER 2: LITERATURE REVIEW
A semi-quantitative assessment can produce more accurate results of risk rankings than those produced by a qualitative assessment. This approach is widely used in railway risk assessment. Metronet Rail has developed a risk model based on this approach to assess train operations and staff risks (Metronet Rail, 2005). However, care must be taken with the use of semi-quantitative assessment, because the numbers chosen may not properly reflect relativities and this can lead to inconsistent, anomalous or inappropriate outcomes ((AS/NZS 4360:2004).
2.3.4.4. Software developments for railway safety risk assessments
On the basis of risk assessment techniques as described in the above sections, many commercial software have been developed which are summarised in Table 2-8. However, most of software has been developed mainly based on FTA and ETA, also including FMEA and Monte Carlo simulation.
Software Applied area Techniques Website
AgenaRisk
Aerospace, Banking, Defence, Energy, Technology, Telecoms, Transportation
FTA www.agenarisk.com/
RiskSpectrum Nuclear power plants FTA&ETA, FMEA www.riskspectrum.com/
QRAS Aerospace, Defence, Health
Care, and other industries FMEA, FTA&ETA www.itemsoft.com/ SAFETI-PHAST Onshore, Finance HAZOP, What if, checklist,
PHA, FMEA www.dnv.com NEPTUNE Offshore ETA , what-if analysis www.dnv.com
SAFETI-Frequen
cy Offshore
FTA, ETA, Monte Carlo
simulation www.dnv.com ASAP leaks, fires and explosions on oil
and gas installations QRA www.lilleaker.com/ASAP.asp LEAK Calculate leak frequency QRA www.dnv.com
FaultTree+ Raliways FTA, ETA www.isograph-software.com
LOGAN No specific area FTA, ETA, Monte Carlo
simulation www.rmclogan.co.uk PHA-Pro 6 No specific area HAZOP, what-if analysis,
checklist, PHA, FMEA www.dyadem.com
Table 2-8 Lists of commercial risk assessment software
The SRM (Safety Risk Model) mentioned in Section 2.3.4.1 is developed on the basis of the FaultTree+ software by Isograph Ltd. It provides improved analysis of the results