DELIVERING
ON
BUDGET
FY2009
‐
10:
A
SET
OF
IMPLEMENTATION
ISSUES
Occasional
Paper:
83
Debapriya
Bhattacharya
Distinguished Fellow, CPD
Md
Ashiq
Iqbal
Senior Research Associate, CPD
Towfiqul
Islam
Khan
Senior Research Associate, CPD
Centre for Policy Dialogue (CPD)
House No 40/C, Road No 11 (new),
Dhanmondi R/A, Dhaka‐1209
Bangladesh Tel: (880 2) 8124770, 9141703, 9141734 Fax: (880 2) 8130951 E‐mail: [email protected] Website: www.cpd.org.bd
First Published September 2009
© Centre for Policy Dialogue
Disclaimer: The views expressed in this paper are those of the authors alone and do not necessarily reflect the views of CPD.
Tk. 80
ISSN 1818‐1570 (Print), ISSN 1818‐1597 (Online)
implementing process. The dialogues are designed to address important policy issues and to seek constructive solutions to these problems. The Centre has already organised a series of such dialogues at local, regional and national levels. The CPD has also organized a number of
South Asian bilateral and regional dialogues as well as some international dialogues. These
dialogues have brought together ministers, opposition frontbenchers, MPs, business
leaders, NGOs, donors, professionals and other functional group in civil society within a non‐
confrontational environment to promote focused discussions. The CPD seeks to create a
national policy consciousness where members of civil society will be made aware of critical
policy issues affecting their lives and will come together in support of particular policy
agendas which they feel are conducive to the well being of the country.
In support of the dialogue process the Centre is engaged in research programmes which are both serviced by and are intended to serve as inputs for particular dialogues organized by
the Centre throughout the year. Some of the major research programmes of the CPD
include the Independent Review of Bangladesh's Development (IRBD), Trade Related
Research and Policy Development (TRRPD), Governance and Policy Reforms, Regional
Cooperation and Integration, Investment Promotion and Enterprise Development,
Agriculture and Rural Development, Environment and Natural Resources Management,
and Social Sectors. The CPD also conducts periodic public perception surveys on policy
issues and issues of developmental concerns. With a view to promote vision and policy
awareness amongst the young people of the country, CPD is implementing a Youth
Leadership Programme.
Dissemination of information and knowledge on critical developmental issues continues to
remain an important component of CPD’s activities. Pursuant to this CPD maintains an
active publication programme, both in Bangla and in English. As part of its dissemination
programme, CPD has been bringing out CPD Occasional Paper Series on a regular basis.
Dialogue background papers, investigative reports and results of perception surveys which
relate to issues of high public interest are published under this series. The Occasional Paper
Series also include draft research papers and reports, which may be subsequently published
by the CPD.
The present paper titled Delivering on Budget FY2009‐10: A Set of Implementation Issues
has been prepared under the CPD‐IRBD programme. The paper was presented at the CPD
dialogue on Implementation Challenges of the Budget FY2009‐10 on 12 August 2009, at
CIRDAP Auditorium, Dhaka by Dr Debapriya Bhattacharya, Distinguished Fellow, CPD.
This paper has been prepared by Dr Debapriya Bhattacharya, Distinguished Fellow, Mr Md
Ashiq Iqbal, Senior Research Associate, and Mr Towfiqul Islam Khan, Senior Research
Associate, CPD.
Assistant Editor: Anisatul Fatema Yousuf, Director (Dialogue & Communication), CPD. Series Editor: Mustafizur Rahman, Executive Director, CPD.
The paper is prepared under Centre for Policy Dialogue’s (CPD’s) programme titled
Independent Review of Bangladesh’s Development (IRBD).
The authors would like to acknowledge the valuable research support provided by Mr Tapas
Kumar Paul, Research Associate and Mr Shouro Dasgupta, Research Intern, CPD.
The paper has drawn on an earlier contribution by Mr Kazi Mahmudur Rahman, Senior
Research Associate, CPD, on “A Note on Public Private Partnership (PPP) Budget” in CPD’s “A Set of Proposals for the National Budget FY2009‐10.”
Contribution of Mr Md Tariqur Rahman, Research Associate, CPD, was instrumental in
building econometric model to analyse the determinants of revenue mobilisation in
Bangladesh.
The authors are thankful for the support of Mr AHM Ashrafuzzaman, Senior System Analyst,
CPD, who has helped in giving this document a final look.
Comments and feedback on the paper may be sent to <[email protected]>.
Acronyms vii
1. Introduction... ...1
2. Growth Prospect and Budget Implementation... ... ..1
3. Domestic Resource Mobilisation ... ... ..6
4. Foreign Resource Inflow ... 15
5. Selected Expenditure Issues ... 18
6. Implementation of Annual Development Programme ... 23
7. Introduction of Public‐Private Partnership within the Budgetary Framework ... 30
8. Financing of Budget Deficit ... 34
9. Concluding Observations... ... 36 References... ... 38
Table 1: Projection of Sectoral Growth Targets ...2
Table 2: Growth‐Investment Framework for FY2009‐10 ...3
Table 3: Determinants of Resource Mobilisation in Bangladesh ...4
Table 4: Revenue Growth Trend over the Last Two Decades ...6
Table 5: Growth Trends in Income Tax Collection over the Last Decade ...9
Table 6: Growth Trends in VAT Collection: FY1992‐93 – FY2009‐10... 10
Table 7: Growth Trends in Import Duty Collection: FY1992‐93 – FY2009‐10 ... 11
Table 8: Current and Proposed Pay Structures (Basic) for the Government Employees ... 19
Table 9: Share of Interest Payment in Total Revenue Expenditure: FY1996‐97 – FY2009‐10 ... 21
Table 10: Trends in Foreign Debt Servicing Liability: FY1999‐00 ‐ FY2007‐08 ... 22
Table 11: Ranking of Problems Related to ADP Implementation by Various Ministries ... 26
Table 12: Trends in Financing of Budget Deficit: FY1991‐92 – FY2009‐10 ... 34
Table 13: Outcome Scenarios for Budget FY2009‐10 ... 36
Figure 1: Investment‐Growth‐Public Finance Cycle ...5
Figure 2: Incremental Contribution of Sources in Revenue Growth by Sources: FY2008‐09 and FY2009‐10 ...7
Figure 3: Tax‐GDP and Revenue‐GDP Ratio in South Asian Countries: FY2008‐09 ...7
Figure 4: Slowdown in Import Duty Collection: July‐June, FY2008‐09 ... 12
Figure 5: Share of Project Aid in Total Foreign Financing: FY1999‐00 ‐ FY2008‐09 ... 16
Figure 6: Trend in Inflow of Grants as a Share of Foreign Financing: FY1997‐98 – FY2007‐08 ... 17
Figure 7: Outstanding Debt as Share of GDP: FY1999‐00 ‐ FY2008‐09 ... 21
Figure 8: Original and Actual ADP as Percentage of GDP: FY1999‐00 ‐ FY2008‐09 ... 24
Figure 9: Trend of Change in Actual ADP and Revenue Collection: FY2000‐01‐ FY2008‐09 ... 25
Figure 10: Share of Domestic Sources in Deficit Financing ... 35
Box 1: Some Recent Commitments by Multilateral and Bilateral Donors ... 17
ADB Asian Development Bank ADP Annual Development Plan
BIIF Bangladesh Infrastructure Investment Fund BOGMC Bangladesh Oil, Gas and Mineral Corporation BOO Build‐Own‐Operate
BOOT Build‐Own‐Operate‐Transfer BOP Balance of Payment
BOT Build‐Operate‐Transfer
BPC Bangladesh Petroleum Corporation BPDB Bangladesh Power Development Board
CD Customs Duty
CPD Centre for Policy Dialogue CPM Critical Path Method CTG Caretaker Government
DFID Department for International Development DPP Development Project Proposal
DSL Debt Servicing Liability
ECNEC Executive Committee on National Economic Council ECR Electronic Cash Register
FDI Foreign Direct Investment GDP Gross Domestic Product GoB Government of Bangladesh G‐20 Group of 20
IIFC Infrastructure Investment Facilitation Centre IMED Implementation Monitoring and Evaluation Division IMF International Monetary Fund
IPFF Investment Promotion and Financing Facility IPP Independent Power Producer
IT Information Technology LTU Large Taxpayers Unit MPS Monetary Policy Statement
MTBF Medium Term Budgetary Framework MTMF Medium Term Macroeconomic Framework MoF Ministry of Finance
NBR National Board of Revenue PAU Policy Analysis Unit
PICKO Private Infrastructure Investment Center of Korea PPA Public Procurement Act
PPP Public‐Private Partnership PPR Public Procurement Rules
PRSP Poverty Reduction Strategy Paper RBM Result‐based Monitoring
SME Small and Medium Enterprise SoE State‐owned Enterprise TIN Tax Identification Number T&T Telegraph & Telephone VAT Value Added Tax VGF Viability Gap Funding
The newly elected government proposed its first budget on 11 June 2009 with a view to
support a trajectory of moderate growth, reduced poverty through employment generation
and expansion of safety nets, low price level and tackle the impact of the global financial
crisis. The Centre for Policy Dialogue (CPD) in its budget reaction pointed out that
addressing these objectives will entail designing of a set of appropriate budgetary measures,
but will depend much more on the efficacy of their delivery (CPD 2009a). Furthermore, such
delivery will need a coherent, coordinated, consistent and committed participation of the
total government machinery and all other development actors and stakeholders. It was
encouraging to see that the Finance Minister publicly agreed with the analysts that
implementation of the budget would be the most important challenge. In his post‐budget
press briefing on 12 June 2009, the Finance Minister stated: “While drawing up the budget,
we knew its execution was going to pose a huge challenge” (The Daily Star 2009).
In this context the present study seeks to facilitate an early kick‐off of budget
implementation in FY2009‐10 and to complement the continuing monitoring process by the
government. The study is based on analysis of secondary data, government policy
documents and media reports. Interviews with the knowledgeable people were also carried
out to generate insights. Along with selective econometric exercise, academic literature was
reviewed to strengthen the analysis.
Promoting economic growth is the primary objective of the budget implementation;
conversely growth itself is a key determinant of successful implementation of budget. In this
context, the paper sets off by exploring the growth prospect for FY2009‐10 and its linkages
with implementation of the budget. Resource mobilisation is one of the two pillars of a
budgetary framework; subsequent two sections, thus, highlight the issues related to
revenue mobilisation from domestic source and foreign assistance inflow. On the
expenditure side, a select set of expenditure issues relating to the revenue expenditures
have been examined, besides reviewing the challenges of annual development plan (ADP)
delivery. As mainstreaming of the public‐private partnership (PPP) has been one of the
distinguishing features of the budget, a separate section has been devoted to the theme.
The penultimate section of the paper brings the resource and expenditure sides together
and discusses the issues relating to budget deficit and it’s financing. The paper then rounds
up with a set of possible scenarios along with a few concluding observations.
2. GROWTH PROSPECT AND BUDGET IMPLEMENTATION
2.1 Growth Prospect
In a year of democratic transition, uncertainties both in terms of policy making and policy
continuity, volatility in domestic economy and global financial meltdown, a growth rate of 5.9
per cent was recorded during FY2008‐09. This has been considered to be respectable. A
robust performance in the agricultural sector (growth rates of agricultural sector and crop‐
sector were 4.7 per cent and 5.2 per cent respectively) and high export growth were the
highlights of the preceding fiscal year (FY2008‐09). With the apprehension of late entry and
target for FY2009‐10 was initially set at 5.5 per cent. Compared to the almost 6.0 per cent
growth in the volatile year of FY2008‐09 and considering the emergence of “silver lining” in
the global economy and proposed counter‐cyclical expansionary fiscal stance, the target was
termed “rather conservative” by CPD in its reactions to the national budget for FY2009‐10.
Such a characterisation was also informed by the high level ambition espoused by the election
manifesto of the ruling coalition. The Finance Minister, however, in his post‐budget press
briefing on 12 June 2009 mentioned that the GDP growth rate in FY2009‐10 will be between
5.5‐6.0 per cent.1 Later, the Monetary Policy Statement (MPS) of the Bangladesh Bank pitched
the GDP growth in FY2009‐10 “in the range of 5.5 to 6.0 per cent” as “projected
conservatively” and expected that it may “outperform” given some positive developments at
home and abroad (Bangladesh Bank 2009). Such a reassessment of the growth outlook for
FY2009‐10 is well appreciated.
2.2 Sectoral Composition
Given the structural composition of the GDP, achieving a growth target of 5.5 per cent usually
does not require an exceptional performance (CPD 2009a). However, to attain a 6 per cent
growth and beyond, the sectors of the economy are required to demonstrate comparatively
an above‐average performance. Unfortunately the government’s projections on sectoral GDP
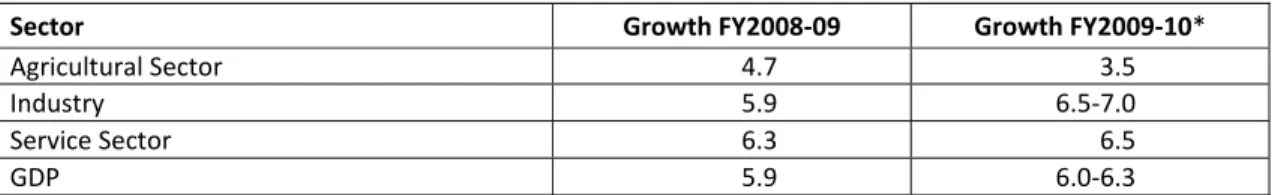
growth targets for FY2009‐10 are not available. In Table 1, projection of the sectoral GDP
growth target was attempted in view of the aggregate target of around 6 per cent.
The central bank in its recent MPS has mentioned that it aim to pursue monetary policy to
attain 4 per cent growth in agriculture sector. In the backdrop of high benchmark of
agricultural production (4.7 per cent in FY2008‐09), attaining such a target will be pretty
challenging. It is rather expected that, in the event of continuation of policy support and
given absence of any natural disaster affecting the crop sector other than the impact of
drought during ongoing Aman, a near 3.5 per cent growth in this sector may be realistic.
Table 1: Projection of Sectoral Growth Targets
(in Per cent)
Sector Growth FY2008‐09 Growth FY2009‐10*
Agricultural Sector 4.7 3.5
Industry 5.9 6.5‐7.0
Service Sector 6.3 6.5
GDP 5.9 6.0‐6.3
Source: Authors’ projection and MoF (2009a).
Note: *Sectoral growth rates are projected in view of GDP growth target.
The average growth rate of industrial sector2 during this decade (FY2000‐01‐FY2008‐09) has
been around 7.5 per cent. It can be expected that below par performance by industrial
sector in FY2008‐09 (at 5.9 per cent) will continue during the first half of this fiscal year.
Following global economic recovery, it may revert to its trend growth in the second half of
FY2009‐10. However, in view of the rather discouraging investment scenario in the domestic
front, the industrial growth at the end of the year may very well stay below its trend, but is
1
ibid. 2
expected to beat last year's growth. Thus, the authors have estimated growth between 6.5
to 7.0 per cent for this sector in FY2009‐10. But manufacturing growth at the margin will
determine GDP growth beyond 5.5 per cent.
Historically, steady performance by the services sector has been underpinned by moderate
achievements in the real sectors. An average growth of the service sector during FY2000‐01‐
FY2008‐09 (6.5 per cent), given the expected performance by the other two, may be
secured and hence the targeted growth rate for GDP.
2.3 Growth‐Investment Nexus
One may recall that, CPD identified that energising investment would be the one of the
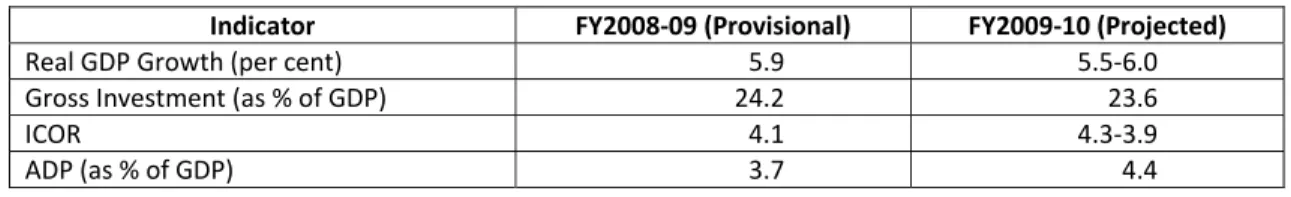
crucial challenges for Bangladesh economy during FY2009‐10 (CPD 2009b). Investment
target, as stated in the budget suggests that the government is expecting a decrease in the
investment rate (as a percentage of GDP) from 24.2 per cent in FY2008‐09 to 23.6 per cent
in FY2009‐10 (see Table 2). A significant enhancement in public investment (in terms of ADP)
would thus imply a rather depressing FY2009‐10 for private investment as it is going to
decline further as percentage of GDP (from 19.6 per cent in FY2008‐09). This would imply
either a complete contradiction to the expectation expressed in the budget about private
investment or apriori acceptance of less than full delivery of ADP.
Table 2: Growth‐Investment Framework for FY2009‐10
Indicator FY2008‐09 (Provisional) FY2009‐10 (Projected)
Real GDP Growth (per cent) 5.9 5.5‐6.0
Gross Investment (as % of GDP) 24.2 23.6
ICOR 4.1 4.3‐3.9
ADP (as % of GDP) 3.7 4.4
Source: Authors’ calculation based on Medium Term Macroeconomic Framework (MTMF), MoF (2009b).
The incremental capital output ratio (ICOR) is also projected to increase to 4.3 in FY2009‐10
given the growth target would remain at 5.5 per cent, hence a further deceleration of
capital productivity has been projected. To achieve a 6.0 per cent growth, with the same
level of investment, capital productivity in terms of ICOR requires an improvement to 3.9.
Thus, in order to achieve target growth rate, a significant upward movement would be
required to take place regarding investment flow – both public and private. In the absence
of adequate investment flow, capital productivity has to increase through better capacity
utilisation and/or technological upgradation. These, on their own, will also define the
revenue collection prospect.
2.4 Determinations of Domestic Resource Mobilisation
It is not only the expenditure side of a budget that influences aggregate economic outcome
such as GDP growth; GDP growth performance, from the other side, may also determine
potential for domestic resource mobilisation. The present study carried out a quantitative
analysis for understanding the determinants of total tax revenue in Bangladesh. A time
series regression is estimated considering (ln of) total tax revenue collection as the
determinants of resource mobilisation (e.g. per capita income) for any country, to capture
the effects of institutional measures initiated in revenue collection efforts, two dummy
variables for value added tax (VAT) and large taxpayers unit (LTU) were introduced.
Although, no serial correlation was found using Durbin‐Watson test, standard procedure
was followed for this study in time series analysis by running the Prais‐Winsten correction.
Prais‐Winsten uses the generalised least‐squares method to estimate the parameters in a
linear regression model in which the errors are serially correlated. However, there are no
significant changes in the results are found.
The time series regression results, as reported in Table 3, suggest the following:
a) Per capita income has the highest influence on the level of resource mobilisation in
Bangladesh. Accordingly, one per cent increase in per capita income would result
around 0.8 per cent increase in tax collection. Findings from several other studies –
both cross‐country and country‐specific – also confirm this result (Bahl 1971;
Chelliah 1971; and Rasheed 2006).
Table 3: Determinants of Resource Mobilisation in Bangladesh
Variables Model I Model II
OLS Prais‐Winsten
Per Capita Income (ln) 0.78***
(0.01)
0.76***
(0.19)
Public Investment as per cent of
GDP 0.17* (0.09) 0.18** (0.08) Import (log) 0.15* (0.08) 0.13* (0.07)
Share of Modern Sector in GDP 0.01
(0.02)
0.02
(0.02)
VAT Dummy (1= Introduction
of VAT and 0=otherwise)
0.24*** (0.04)
0.25***
(0.04)
LTU Dummy (1= Introduction of
LTU and 0=otherwise)
0.09** (0.04) 0.10*** (0.04) Constant ‐2.60*** (0.83) ‐2.64*** (0.78) R‐Squared 0.99 0.99
Durbin‐Watson Statistics 1.96 1.90
Number of Observations 28 28
Source: Authors’ estimation.
Note: 1. ***, ** and * denote significance level at 1 per cent, 5 per cent and 10 per cent respectively. 2. Figures within the parentheses are the standard errors
b) Investment in the private sector is largely related to import and destined to modern
sector of the economy. Thus excluding investment in private sector, we consider the
public investment only, as a determinant of tax revenue mobilisation. It is found that
public sector investment in Bangladesh, in turn, contributes to the tax revenue
generation.
c) Relationship between tax revenue collection and import is also found positively
significant. This corroborates the relatively high dependence of tax collection on
import‐related sources.
d) Influence of the share of modern sector, as a proxy of the economy’s structure, is
found correctly with positive sign, but insignificant.
e) Different institutional measures taken by the governments at different time have
also positive impact on revenue generation, although the introduction of VAT in
FY1990‐91 has much larger influence compared to the introduction of LTU in
FY2002‐03.
Thus, implementation of the budget, on one hand, has a critical role in attaining GDP growth
target for the economy; at the same time, the time series analysis confirms that the
performance of the economy will also determine, to a large extent, the implementation of
the proposed budget. In fact, from this result one can illustrate an interrelated
macroeconomic framework in the fiscal context. One may also recall, in Bangladesh, public
investment creates a “crowding in” effect for private investment (Majumder 2007), given
excess liquidity in the financial system – an incidence prevailing at present circumstances.
Thus, public investment along with the private counterpart can facilitate the economic
growth. Economic growth and also higher public investment, as is found, accordingly have a
positive effect on revenue mobilisation. Consequently, the incremental revenue will be
utilised for development financing. This “Investment‐Growth‐Public Finance Cycle” has an
important policy implication (Figure 1). This also reemphasises the need for energising
investment to foster economic growth; not only from the expenditure side, but also from
the revenue mobilisation perspective of budget implementation.
Figure 1: Investment‐Growth‐Public Finance Cycle
3. DOMESTIC RESOURCE MOBILISATION
3.1 Overall Revenue Targets
3.1.1 Total Revenue
Overall growth target in revenue earnings for FY2009‐10 has been set at 15.7 per cent and
achievement will depend on the performance of all the basic three revenue components,
viz. National Board of Revenue (NBR) tax3, non‐NBR tax4, and non‐tax5. As trend analysis
reveals (Table 4), barring FY2007‐08, such growth in total revenue was never achieved over
the last 17 years. It should be mentioned that FY2007‐08 was an exceptional year for
revenue mobilisation, as high growth rates for all the three revenue components were
observed. Against an average growth of 13.8 per cent during FY2001‐02 to FY2005‐06, a
24.9 per cent growth in total revenue collection was achieved in FY2007‐08.
Table 4: Revenue Growth Trend over the Last Two Decades
(in Per cent) Components FY1991‐92 ‐ FY1995‐96 FY1996‐97 ‐ FY2000‐01 FY2001‐02 – FY2005‐06 FY2006‐ 07 FY2007‐ 08 FY2008‐ 09* FY2009‐ 10 B** Total Revenue 14.1 8.5 13.8 8.6 24.9 14.8 15.7 Total Tax 13.2 10.4 12.5 10.0 27.3 ‐‐ 16.2 NBR Tax 13.2 10.8 12.7 9.5 27.4 10.7 16.1 Non‐NBR Tax 13.5 5.0 9.0 21.6 24.6 17.3 17.0 Non‐Tax 18.8 5.3 20.9 2.7 14.1 9.7 13.6
Source: Authors’ estimate based on MoF data.6
Note: * Growth rates of FY2008‐09 are for July‐March period (July‐June for NBR tax) over the same period of FY2007‐08. ** B denotes Budget.
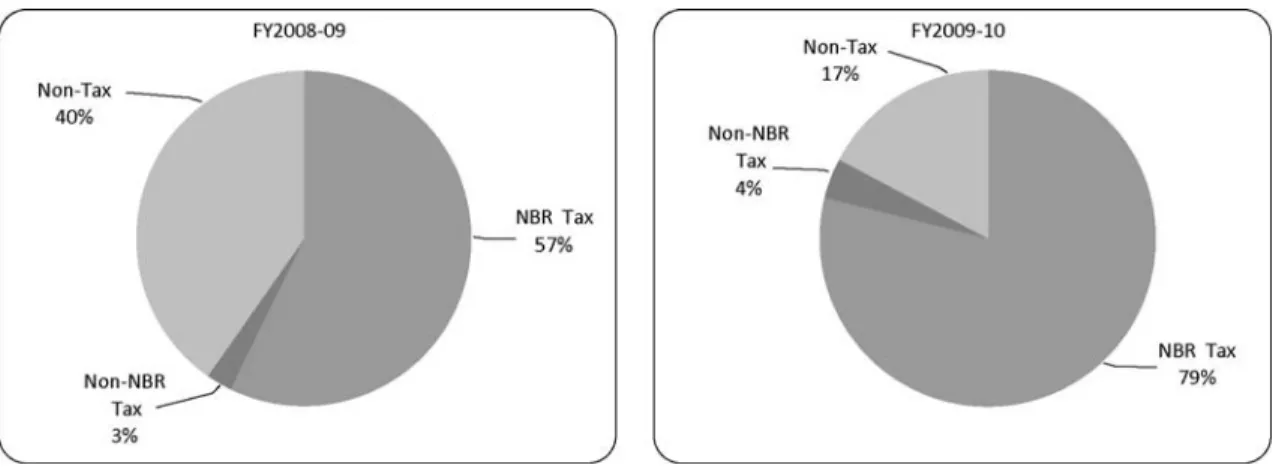
Therefore, compared to the historical trend, total revenue growth target for FY2009‐10
remains to be on the high side, but in comparison to FY2007‐08 – it is on the low side. To
achieve this aggregate target, an overwhelming responsibility has been put on the NBR as it
has to provide about 78.8 per cent of the total incremental revenue. The rest is to come
from non‐NBR tax (4.0 per cent) and non‐tax (17.2 per cent) components. In FY2008‐09 the
relative contributions were more balanced (Figure 2).
3
Includes income tax, VAT, import duty, supplementary duty, electricity and others. 4
Includes narcotics & liquor, vehicles, land, stamp. 5
Includes dividend & profit, post office & railway, interest/fees/tolls and other receipts. 6
Figure 2: Incremental Contribution of Sources in Revenue Growth by Sources: FY2008‐09 and FY2009‐10
Source: MoF and NBR.7
3.1.2 Tax Revenue
Total tax revenue (NBR tax and non‐NBR tax) is targeted to increase by 16.2 per cent in
FY2009‐10, which will be higher than its trend growth over the last several years (excluding
FY2007‐08). This high growth target for total tax revenue is largely based on the high
expectations from the NBR in FY2009‐10, particularly on account of income tax. However,
even if the total tax revenue target is achieved, tax‐GDP ratio of Bangladesh will reach at
11.6 per cent, remaining unfavourable compared to most of its neighbours (Figure 3).
Figure 3: Tax‐GDP and Revenue‐GDP Ratio in South Asian Countries: FY2008‐09
Source: Budget Documents and Economic Reviews of the respective countries. Note: 1Revised budget estimates for FY2008‐09. Actual FY2008‐09 figure for India.
2
India's ratio low because it is only for federal taxes. The state taxes are included, the ratio goes up significantly.
7
3.1.3 NBR Tax
Average growth of NBR tax, for the period between FY2001‐02 and FY2005‐06 has been 12.7
per cent. FY2006‐07 posted a small growth of only 9.5 per cent. After a robust performance
in the following year (posting 27.4 per cent growth) a small growth of 10.7 per cent was
recorded in FY2008‐09. It needs to be borne in mind that one of the important factors
behind the higher revenue growth achieved in FY2007‐08 was due to import growth (in
value terms) and high commodity prices in the international markets at that time. Vigorous
administrative drive to increase revenue coverage and strict monitoring to avoid evasion by
the then caretaker government (CTG) were other contributing factors. In the backdrop of
much lower level of international prices of commodities and associated slowdown in import,
duty collection in recent months along with return to business‐as‐usual situation in
administrative proceedings, it appears that attaining the 16.1 per cent growth target for the
NBR in FY2009‐10 could be quite uphill.
3.1.4 Non‐NBR Tax
For the non‐NBR tax component, a growth target of 17.0 per cent has been set for FY2009‐
10. Notwithstanding the fact that average growth during FY2001‐02 to FY2005‐06 was
rather low at 9.0 per cent, high growth was achieved in two consecutive years – FY2006‐07
(21.6 per cent) and FY2007‐08 (24.8 per cent) and was sustained, to an extent, during the
first three quarters of FY2008‐09 (17.3 per cent during July‐March period). Therefore, the
target of non‐NBR tax collection for FY2009‐10 appears to be an achievable one.
3.1.5 Non‐Tax Revenue
As Table 4 indicates, growth trend of non‐tax revenue was volatile over the years compared to
other revenue components. Against high average growth of 20.9 per cent for the period
FY2001‐02 to FY2005‐06, only 2.7 per cent growth was achieved in FY2006‐07. However,
FY2007‐08 posted a growth of 14.1 per cent8, and even after the corporatisation of the
Telegraph & Telephone (T&T) Board, during the July‐March period of FY2008‐09 a respectable
9.7 per cent growth was recorded. From this perspective, growth target for non‐tax revenue
(13.6 per cent) in FY2009‐10 appears to be conservative and thus should be overachieved.
The fact remains that overall revenue growth target (15.7 per cent) for FY2009‐10 is well
above the average growth achieved in the past years (barring FY2007‐08, which was an
extraordinary year in terms of revenue mobilisation in all aspects). Achievement of this
target will hinge on strengthened administrative efforts in avoiding leakages and bringing in
more eligible people within the tax net, and energising the revenue‐sensitive sectors of the
domestic economy. According to media reports, as of March 2009 Tk. 6,542 crore revenue
was stuck‐up in judicial process due to litigations. Special efforts should be initiated to
expedite these cases not only to collect dues, but also to send a signal to the litigants.
Apparently, based on household income and expenditure data, there is enough scope to
expand the tax base of Bangladesh with only around 7.5 lakh tax payers as against over 70
8
FY2006‐07 figures for non‐tax revenue were later revised upwards in December 2008 (FY2008‐09), putting the growth
lakh potential tax payers. A drive to penetrate the newly emerging activities in the urban areas
to bring them under the tax net would be critical in this regard. While there are provisions for
tax collection from agricultural income, this sector is yet to contribute much since tax
administration has not effectively reached the rural economy. Activities in the peri‐urban
areas also largely remain outside the tax net. Tax offices at the upazila level need to be set up
to explore untapped revenue that could be earned from the peri‐urban and rural economy.
3.2 Growth Target for Income Tax
Of the total Tk. 10,281 crore incremental revenue to be generated in FY2009‐10 over
FY2008‐09, 29.4 per cent is targeted to come from higher income tax collection. Thus,
success in achieving revenue target will largely depend on expanding the base of personal
income tax, since the rates have been kept at the previous levels (other than corporate tax,
which has been reduced by 2.5 per cent for the financial institutes).
As can be seen from the trends of the last ten years as depicted in Table 5, commendable
success has been achieved by the NBR in mobilising income tax with growth rates averaging
18.3 per cent during FY1996‐97 to FY2000‐01 and 15.6 per cent during FY2001‐02 to
FY2005‐06. As a result of the NBR drive to tap tax dodgers coupled with the government’s
anticorruption drive, income tax growth achieved in FY2007‐08 was as high as 34.7 per cent.
Table 5: Growth Trends in Income Tax Collection over the Last Decade
(in Per cent) Tax FY1991‐92 – FY1995‐96 FY1996‐97 – FY2000‐01 FY2001‐02 – FY2005‐06
FY2006‐07 FY2007‐08 FY2008‐09 FY2009‐10
B
Income Tax
Growth 7.1 18.3 15.6 21.8 34.7 18.3 19.2
Source: NBR (2009) and Budget Documents FY2009‐10.9
Attaining the growth target for income tax set for FY2009‐10 (19.2 per cent) will still be a
major task and needs to be based on multitude of efforts. The government has announced
its plan to conduct a new tax survey to bring in at least 4 lakh new tax payers under the tax
net within the current fiscal year (FY2009‐10). This effort needs to be supplemented with
strict surveillance to prevent tax evasion. It is worthwhile to remember that the
government’s ability to provide public goods and services, such as law and order, also
affects people’s inclination to voluntary compliance with tax provisions.
It may be noted here that around 1.5 lakh government employees are within the total
income tax coverage (i.e. about 20 per cent), who gets the amount refunded at the end of
the year, making effective number of taxpayers to be around 6 lakhs. The government is
currently considering discontinuing the refunding provision for its employees from the
current fiscal year, which may contribute towards attaining the income tax collection target,
9
partly offsetting the potential loss from lower profitability of the companies in this era of
economic depression (and also reduce the burden of implementing the higher pay scale).
3.3 Lower Corporate Tax Rate
As has been mentioned earlier, the targeted growth in revenue collection is largely based on
growth in income tax collection, including corporate tax. Corporate tax is the largest
contributor within total income tax accounting for about 60 per cent. During adoption of the
budget in the parliament, corporate tax rate for financial institutions has been reduced to
42.5 per cent from the previous rate of 45 per cent. Positive relationship between lower tax
rate and sectoral growth being a medium to long‐term phenomenon, revenue collection
may suffer in the short‐term (in FY2009‐10) due to this discount. The new rate is estimated
to result in about Tk. 550 crore less revenue for the current fiscal year.
Expansion of the LTU should be given due priority in minimising any potential revenue loss
occurring from the lower rate. LTU contributes over 37 per cent of the total income tax
collection and includes 981 taxpayers, 281 of which are companies. The government has
targeted Tk. 6,000 crore to be mobilised from them, Tk. 1,100 core more than what was
achieved of it in the last year, with majority of the additional revenue to come from the
companies. However, many of these companies have already registered losses (55
companies) and nine of them are not functioning at all, while another nine are enjoying tax
holidays. Global developments will make its mark on the income and profitability of these
companies and the revenue earned from them. Thus, effectiveness of the government’s
effort to stimulate investments in the country will have great implications for revenue
prospects, particularly in FY2009‐10.
3.4 Growth Target for VAT
As Table 6 shows that a 13.2 per cent growth target has been set for VAT collection in
FY2009‐10, implying about a quarter of the incremental revenue of the current fiscal is set
to come from increased VAT collection. This growth target, however, appears achievable in
the background of 14.2 per cent average growth achieved during FY2001‐02 to FY2005‐06.
Although FY2006‐07 posted a lower growth of 11.5 per cent, as was the case for income tax,
FY2007‐08 was an exceptional year in terms growth in VAT collection (28.2 per cent), while
the rate subsequently slowed down to 13.9 per cent in the following year (FY2008‐09).
Table 6: Growth Trends in VAT Collection: FY1992‐93 – FY2009‐10
(in Per cent) Tax FY1992‐93 – FY1995‐96 FY1996‐97 – FY2000‐01 FY2001‐02 – FY2005‐06
FY2006‐07 FY2007‐08 FY2008‐09 FY2009‐10
B
Total VAT 23.1 10.8 14.2 11.5 28.2 13.9 13.2
VAT Import 20.0 7.8 10.0 7.2 34.5 8.2 NA
VAT Domestic 32.1 15.9 19.2 15.4 22.9 19.2 NA
Source: NBR (2009) and Budget Documents FY2009‐1010.
10
Given the uncertainties afflicting global economic situation in the coming year including
volatility of prices, VAT collection at the import stage may suffer in FY2009‐10. Since around
50 per cent of the total VAT collection in Bangladesh comes at the import stage, one needs
to be energetic in mobilising VAT at the domestic level so as to offset any fall in the former.
At the same time, challenge will be there to cover the loss arising from withdrawal of VAT
from a number of products and from professions (e.g. medical doctors).11 A time‐bound
approach in implementation of the decision to compulsory installation of electronic cash
register (ECR) by all sales units should also be prioritised. Efforts undertaken in the last two
years, such as legal action against VAT dodgers and mass drive to collect VAT from retail
stores should be continued to meet the VAT collection target. There is also a need to
reconcile the income tax and VAT figures of business establishments.
3.5 Revenue Implications of the Global Economic Crisis
Fall in commodity prices in international markets during FY2008‐09 resulted in a fall in
import duty collection in Bangladesh (Table 7). Month‐on‐month comparison as presented
in Figure 4, clearly bears it out as growth rate in import duty collection fell from 35.7 per
cent to (‐) 27.9 per cent between the month of July 2008 and June 2009. It is to be noted
that the annual growth target for import duty collection of 13.1 per cent for FY2008‐09 was
later revised at a negative (‐) 0.3 per cent in view of the monthly progress. Table 7 reveals
that at the end of the fiscal year even the targeted level of negative growth was not
achieved and settled with a negative (‐) 2.8 per cent growth. In‐take of total import related
duties was also lower than the targeted growth of 5.1 per cent (originally targeted at 13.5
per cent for FY2008‐09, later revised at 7.4 per cent).
Table 7: Growth Trends in Import Duty Collection: FY1992‐93 – FY2009‐10
(in Per cent) Duty FY1991‐92 ‐ FY1995‐96 FY1996‐97 ‐ FY2000‐01 FY2001‐02 ‐ FY2005‐06
FY2006‐07 FY2007‐08 FY2008‐09 FY2009‐10
B
Import Duty
Growth 10.0 6.7 9.2 4.2 17.7 ‐2.8 11.8
Source: NBR and MoF12.
11
At the manufacturing stage, electricity, cancer preventive drugs, hard board, electric generator, refrigerator, motor cycle,
solar panel and goods carrier trailer have been exempted from VAT in the budget for FY2009‐10. At the same time, internet
service provided to educational institutions, specialised doctors and maize (corn) seeds at the trade stage have been
exempted from VAT. 12
Figure 4: Slowdown in Import Duty Collection: July‐June, FY2008‐09 Source: NBR.13
Import duty and other import related duties together constitute over 40 per cent of the
total NBR revenue collection in Bangladesh (34 per cent of the total revenue). Thus,
developments in the global economic crisis may have significant implications for revenue
collection in FY2009‐10. However, as various projections indicate, the second half of
FY2009‐10 may experience some global economic healing and there are already signs of
upward movement of prices in the international market. Fuel prices recently reached
around USD 70, which was as low as USD 40 in December 2008. According to the recent
World Economic Outlook (April 2009) of the International Monetary Fund (IMF), fuel prices
may stand higher in the second half of FY2009‐10 compared to the current levels. IMF also
projects a higher Commodity Price Index for 2010 (120.6) compared to that of 2009 (107.9),
indicating a rise in average commodity prices in the coming year. Therefore, assuming that
the budget FY2009‐10 is based on May‐June (2009) prices (which was the case for Budget
FY2008‐09), duties collected at the import stage may increase and positively contribute to
realisation import duty collection target in FY2009‐10.
Having said that, it also needs to be mentioned that growth target for import duty collection
in FY2009‐10 is well above the recent trend (only exception being FY2007‐08). At the same
time, even if the free fall is over, global economic recovery could be a “U” shaped
phenomenon, rather than a “V” shaped one, according to apprehensions of many.
Therefore, achieving 11.8 per cent growth in import duty collection could be one of the
major challenges facing by the government in the effort to mobilise revenue in FY2009‐10.
13
3.6 The New Duty Structure
The proposed duty structure marks reduction in duties on import of industrial raw materials
from 7 per cent to 5 per cent. There is, however, an effort to balance the loss from the
reduction with increased duties on imports of finished/luxury goods (cars, air conditions
etc.). At the same time, 5 per cent regulatory duty has been imposed on milk powder and on
luxury items having customs duty (CD) of 25 per cent.
CPD estimates show that the current duty structure, if applied on FY2007‐08 imports, would
have resulted in 5.65 per cent additional revenue in FY2007‐08. This implies that the new
duty structure would achieve an import duty growth of 5.6 per cent even with a zero growth
in imports. Assuming a 13 per cent growth in imports for FY2009‐10, as has been projected
in the MTMF, it is estimated that earnings from imports in FY2009‐10 would be near about
11.2 per cent higher than FY2008‐09. While the favuorable duty structure should help in
increasing import related duties, this will also depend on the growth of imports and
movement of prices in the international market.
3.7 Provision for Legalising Undisclosed Income
The budget for FY2009‐10 maintains provision for legalising undisclosed income. Major
concerns emerges from three aspects of its design – i) no differentiation between legally
earned and illegally earned income, ii) tax to be paid at 10 per cent, lower than minimum
rate of regular income tax, and iii) no penalty rates are applicable. In fact, in cases where
undisclosed money is to be legalised through investments in flats or houses, the applicable
rate may even be lower than 1 per cent. These aspects of the provision may discourage
regular tax payers, with negative implications for revenue mobilisation.
In addition to the curious opportunity of purchasing flats/houses, the provision allows
investment of undisclosed money with a payment of 10 per cent tax in infrastructure
development and in 44 industrial sectors along with the capital market. It would have been
more logical to prioritise thrust sectors rather than an economy‐wide scope for investments.
At the same time, while the stock exchanges may attract increased capital flow, it is more
likely that most of the disclosers will take advantage of the low effective rates applicable for
purchasing flats/houses, which is also a highly profitable sector for investment. As a result,
the provision might not contribute much to attract investments in the thrust sectors, or to
higher revenue mobilisation.
It is to be noted that revenue earnings from undisclosed legal income gradually slowed
down, amounting to Tk. 105 crore in FY2008‐09, compared to Tk. 803 crore in FY2007‐08.
The number of people availing this facility also decreased in FY2008‐09 to 14,216 from
42,000 in the preceding year. This reflects that the nature of the provision is such that
continuation of it over the years tends to reduce its incremental benefits. With no penalty
rates and lower than minimum applied tax rate, outcomes of the provision in FY2009‐10
may not meet the expectations.
3.8 Administrative Capacity in Revenue Mobilisation
With a population of over 14 crore, Bangladesh has around 23 lakh registered income
taxpayers Tax Identification Number (TIN) holders, among whom only about 7.5 lakh pay
taxes on a regular basis. About 1.5 lakh government employees later get tax refund,
making the number of effective taxpayers to around 6 lakh only. The revenue‐GDP ratio
for FY2008‐09 (according to the revised targets) was only about 11.2 per cent. In light of
growing development spending needs and the expansionary measures planned by the
government in the budget for FY2009‐10, there is an urgent demand to strengthen the tax
administration, particularly the NBR. The major issues that need immediate attention have
been discussed below.
Manpower: Due to legal disputes, NBR has not been able to properly expand its manpower
capacity since the mid‐1980s. These disputes must be settled and an effective revenue
administration, staffed with a well trained and motivated workforce must be developed to
realise the revenue objectives. It is estimated that there are currently 8,000 vacancies at
different levels in NBR. Unless these vacancies are filled, it will be increasingly difficult to
achieve the revenue targets.
Expansion of NBR to reach the untapped potential: In the last two decades, income levels
in the municipality and upazila areas have increased substantially. However, due to the
lack of presence of tax officials at the peri‐urban levels, collection of taxes from these
areas has not increased.
Simplification and updating of income tax laws: In order to ensure clarity, transparency and
predictability, the tax law must be made taxpayer‐friendly and consider circumstances in
Bangladesh. Many of the laws were written in the British era; the language and references
have not been changed since. The last major amendment to the income tax laws were made
in 1984 (Income Tax Ordinance 1984), as a result many of these laws are outdated and does
not pertain to the horizontal economic expansion that has taken place in Bangladesh in the
last two decades. These laws also do not always cover the shift away from foreign aid
dependency towards a greater reliance on domestic resources which in theory should
generate higher taxes.
Cutting off intermediaries: Promoting the use of “self‐assessment system” may significantly
increase revenue of the government by bringing the taxpayers in personal contact with the
revenue administration without the help of intermediaries. Involvement of the
intermediaries in the tax payment procedure often makes the willing taxpayers to shy away,
leading to tax evasion. However, the system must be simple enough to be trusted by the
general public and for their rights to be legally ensured.
Audit and monitoring: Designing a fair, responsible, and effective enforcement mechanism
that directly responds to changes in the economic environment and technological
opportunities will minimise leakages from the system, e.g. under‐invoicing to evade taxes.
Monitoring the real estate sector is especially crucial in light of the “black money‐whitening”
scheme being allowed by the government. There are approximately five lakh credit card
properly assessed. End‐use data relating to money disclosed under the tax amnesty scheme
has to be properly maintained.
Modernisation: Developing a modern information technology (IT)‐based tax administration
will help to reduce corruption and improve transparency and efficiency of tax collection.
NBR should undertake a programme to popularise online submission of tax returns.
Ensuring the use of ECR and modernising customs facilities in the major ports and entrance
points will also help increase the government’s revenue. Using the National ID Card
database could be helpful in expanding the tax net.
Increasing the effectiveness of NBR’s organisational structure along functional lines,
developing legal and regulatory systems and fostering an ethos of taxpayer service are some
of the broader aspects that should be considered at the earliest.
4. FOREIGN RESOURCE INFLOW
In order to underwrite the overall fiscal deficit, the budget for FY2009‐10 envisaged a gross
foreign financing inflow of about USD 2.6 billion (Tk. 18,345 crore). This amount is
equivalent to around 40 per cent of the planned fiscal deficit for the current year (see
Section 8 for details).
If the targeted foreign financing is realised, then this will be the highest ever inflow of
foreign resources in a single year. Apart from its size, the nature and mode of this inflow will
be of critical importance. While aiming for higher amount in meeting budgetary demands,
crucial aspects of foreign financing in FY2009‐10, inter alia, will be the following: (i) share of
budgetary support (compared to project aid), (ii) share of grants (as against loans), iii) share
of concessional low interest loans (vis‐à‐vis commercial loans/suppliers’ credit), and iv) aid
conditionalities (including those relating to the Poverty Reduction Strategy Paper (PRSP)
which currently remains in an ambivalent state).
Out of the projected total of USD 2.6 billion of foreign financing, USD 1.82 billion (about 70
per cent) is supposed to come as project aid. This would imply that about 26 per cent more
project aid has to be disbursed in FY2009‐10 in comparison to that of in the FY2008‐09
(according to revised ADP). Therefore, the government needs to put in a vigorous effort to
access the accumulated foreign aid pipeline which is around USD 7 billion. The government
also needs to negotiate new projects to cater from the future foreign aid need. It may be
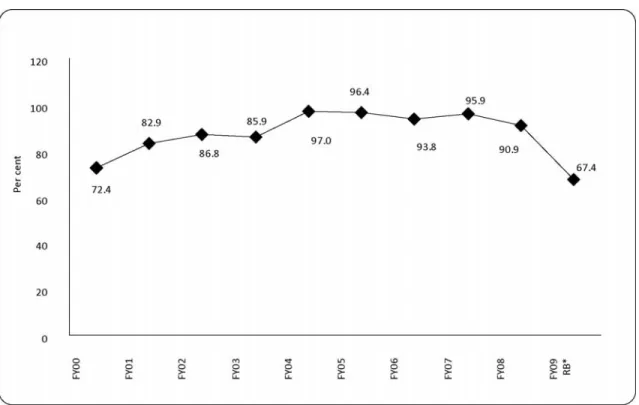
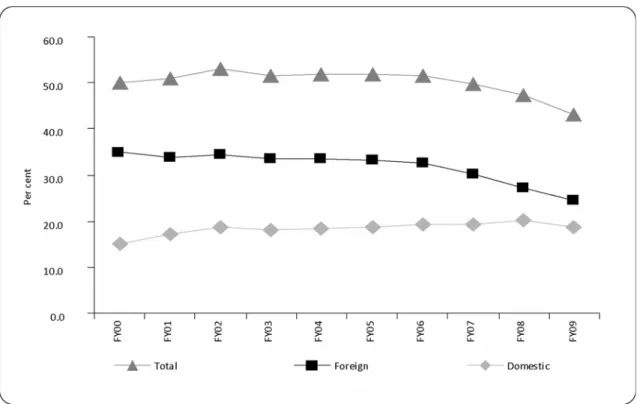
recalled here that while overall foreign financing declined over the last two fiscal years
(FY2007‐08 and FY2008‐09) due to low level of ADP implementation, the share of project aid
in total foreign financing declined as well (Figure 5). This happened because the CTG could
successfully negotiate a large volume of budgetary support from the donors, the World
Bank in particular. To maintain flexibility of fund use, the current government will also have
to continue its efforts to access budgetary support not only from the multilateral sources
(World Bank and Asian Development Bank (ADB)), but also from large bilateral donors (e.g.
Department for International Development (DFID)).
Figure 5: Share of Project Aid in Total Foreign Financing: FY1999‐00 ‐ FY2008‐09
Source: Bangladesh Bank and MoF.14
Note: RB denotes Revised Budget.
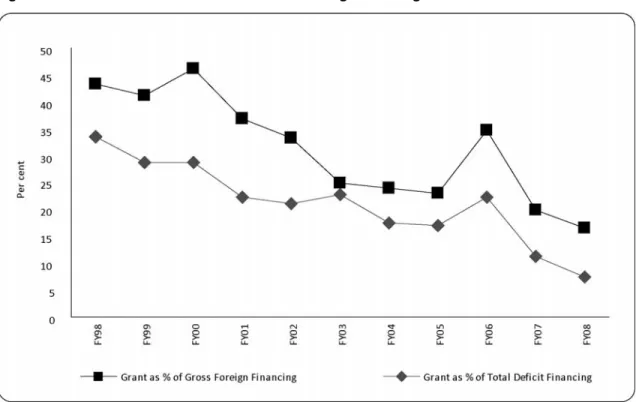
An overwhelming share (72.0 per cent) of the incremental foreign financing for FY2009‐10 is
supposed to come as loans, however only 28.0 per cent of it as grants. While the share of
grants in foreign financing had been on gradual decline in the recent past (Figure 6), efforts
to receive more foreign aid in the form of grants needs to be stepped up, particularly to
keep debt servicing liability (DSL) sustainable. Although foreign DSL accounted for about 2
per cent of the revenue budget in FY2008‐09, the share may go up in the coming years.
Indeed, in the context of various international assistance promises (particularly at the Group
of 20 (G‐20) meeting) in connection with mitigating adverse impact of global economic crisis
on low‐income economies, Bangladesh needs to initiate proper processes to tap in such
potential sources. 14
Figure 6: Trend in Inflow of Grants as a Share of Foreign Financing: FY1997‐98 – FY2007‐08
Source: MoF (2009a).
Governments thrust on receiving higher foreign aid in FY2009‐10 is already visible from its
requests sent to many multilateral and bilateral donors to fund different large‐scale projects
and support budgetary deficits. Some progress is also evident from the declarative
statements so far made by the development partners. These include the announcements by
the World Bank and the ADB to enhance assistance programme to Bangladesh by 20 per
cent and 33 per cent respectively.
Box 1: Some Recent Commitments by Multilateral and Bilateral Donors
Recently the ADB committed for USD 200 million, the Japan government and the World Bank have assured
of providing USD 100 million, USD 200 million respectively. ADB announced that it is going to increase the
annual assistance package to Bangladesh by 33 per cent to USD 800 million annually during 2009‐11. It is
also considering the government’s request for USD 500 million in aid from its special fund to tackle the
adverse impact of the global financial crisis. ADB may also provide further USD 76 million to help support
small and medium enterprises (SMEs) in Bangladesh.
World Bank also recently approved USD 130 million worth of credit for Bangladesh to increase the country's
access to electricity through installation of affordable solar home systems in rural areas and it has decided
to increase aid by 20 per cent to USD 1.0 billion per annum for the next three years.
The government is also negotiating USD 4.7 billion assistance in the form of project aid with the Chinese
government, expected to be realised over the next few years.
While commitments made by the donors in the current fiscal year looks promising in view of
particular concern relates to the government’s willing to receive foreign financing at high rate
of interest. Recently, Bangladesh has shown interest in receiving USD 500 million from the
ADB which the multilateral donor has offered as commercial lending at a “LIBOR plus” rate.
Furthermore, the USD 4.7 billion assistance requested from the Chinese government
consists of a number of projects and will possibly include “suppliers’ credit” components.
Indeed, Bangladesh has refrained from taking such loans during the last few years due to
high interest rate usually attached to them.
On the other hand, conditionalities of these assistances needs to be carefully scrutinised. It
has been reported in the media that the government has embarked on a discussion to access
IMF loans. It may be pointed out that IMF loans usually addresses balance of payment (BOP)
problems, which thankfully does not exist currently in Bangladesh. Loans offered by the IMF
are to have lower interest rate (of 0.25 per cent). In the post‐global crisis period IMF is also
supposed to have relaxed some of its stringent conditionalities. However, one will have to
carefully look at the core conditionalities of the IMF so that they do not ultimately disrupt the
implementation of the government’s economic programme and dissuade other donors.
5. SELECTED EXPENDITURE ISSUES
5.1 Implementation of the New Pay‐scale
The Pay Commission in its initial recommendations made in April 2009, proposed an average
increment of 79.7 per cent for the government employees (Table 8). Later in July 2009, the
Secretaries’ Committee revised the Pay Commission proposals and recommended an average
64.1 per cent rise. It will be pertinent to mention here that the last amendment in the
government pay structure was made in May 2005 and took its retrospective effect from
January 2005. Currently the proposed salary structure is awaiting approval of the cabinet. The
new pay‐scale is expected to be finalised after the Eid‐ul‐Fitr (but effective from July 2009).
Indications are that the government is going for an average 65 per cent increase in salaries
for the government employees, this would create an additional fiscal burden of about
Tk. 3,500 crore in FY2009‐10. Full implementation will take place over a period of two year,
as only the salary increase is planned to be implemented in the current year and increase in
bonuses and other allowances are to take effect from the next year. In the overall context of
resource context, the most important issue will relate to inflationary impact of the decision
and its management. Concern will also be there for the middle income salaried people
outside the government sector if such increases are not endorsed by the private sector.
How the final salary structure of the government balances the trade‐off between rewarding
high level positions and ensuring a sense of equity for the low paid ones15, will be the centre
of attention. The proposed structure has already raised some concerns regarding the
distribution of increments between the salary grades. According to the recommendations of
the Secretaries’ Committee, the top grade (grade 1) will receive an increase of 73.9 per cent
in their basic salaries. On the other hand, the bottom grade (grade 20) will have a 70.8 per
15
According to the current pay‐scale ratio between grades 20 and 1 is 1:9.6, whereas ratio in the proposed pay‐scale by