Introduction iii 1 Clouds in climatology and meteorology 1
1.1 Relevance of clouds . . . 2
1.1.1 Clouds in the earth radiative balance . . . 3
1.1.2 Clouds in climatology models . . . 5
1.1.3 Clouds in meteorological models . . . 6
1.2 Main resources for cloud studies . . . 9
1.2.1 Synoptic surface observation . . . 9
1.2.2 Ground-based radar . . . 11
1.2.3 Space-borne passive sensors . . . 14
1.2.4 Space-borne observation’s state of art . . . 16
1.3 International cloud projects . . . 19
1.3.1 ISCCP . . . 19
1.3.2 CloudSat . . . 22
1.3.3 Other missions and projects . . . 23
2 Cloud remote sensing at VIS,NIR,IR wavelenghts 27 2.1 Radiometric quantities . . . 28
2.2 Interactions between radiation and matter . . . 30
2.2.1 Concepts of scattering . . . 31
2.3 The Radiative Transfer Equation (RTE) . . . 39
2.3.1 RTE numerical resolution method . . . 43
2.4 Scattering geometry and bidirectional reflectance . . . 44
2.5 Cloud parameters retrieval . . . 48
2.5.1 Cloud optical thickness and effective radius . . . 48
2.5.2 Cloud particles phase and Cloud top height . . . 55
3 Cloud Mask using SEVIRI data 59 3.1 Cloud mask methods . . . 60
3.1.1 Cloud mask algorithms . . . 63
3.2 TESCM Cloud mask algorithm . . . 67
3.2.1 ∆T sensitivity at 3.9, 8.7, 10.8µm . . . 67
3.2.2 The algorithm . . . 70
3.3 Comparison with operational products . . . 75
3.3.1 MODIS cloud masks . . . 76
3.3.2 Results of comparison . . . 77
4 Retrieval of clouds parameters using SEVIRI 89 4.1 SBDART: simulation scheme and sensitivity analysis . . . 90
4.1.1 Sensitivity analysis of the model . . . 91
4.2 The retrieval scheme . . . 91
4.3 τ and Re temporal analysis of cloud convective systems . . . . 94
4.3.1 Temporal development of a convective event . . . 97
4.3.2 Convective cluster analysis . . . 99
4.3.3 Comparison to MW observations . . . 104
5 Cloud cover associated to cyclone in upper troposphere 107 5.1 The cut-off low systems . . . 108
5.1.1 Clouds studies associated to cyclonic systems . . . 110
5.2 Data and algorithm . . . 112
5.2.1 Assigning cloud cover to COL occurrences . . . 114
5.3 Data analysis and results . . . 116
5.3.1 Cloud cover size . . . 116
5.3.2 PV anomalies and cloudiness . . . 118
5.3.3 Cloud top temperature analysis . . . 120
5.3.4 Cloud optical thickness analysis . . . 124
5.3.5 NAO index and clouds associated to COLs . . . 126
Conclusions 130
Acronyms list 134
Bibliography 139
Clouds play a key role in determining the status of the atmosphere and the whole earth system over a wide range of spatial and temporal scales. The results of the Intergovernmental Panel on Climate Change (IPCC) fourth Assessment Report (2007) highlight the dominant role of water in several aspects of the Earth’s climate system. Understanding the full hydrological cycle, where clouds play a relevant role, is one of the highest scientific pri-orities to assess, monitor and predict climate change. Furthermore, clouds interact with radiation, acting as regulators of several cooling and warming mechanisms. The effects of this complex cloud role on climate change remains a dominant uncertainty, although now clouds are better understood than at the time of the third assessment report (2001) due to improved in-situ, satel-lite and ground-based measurements and more comprehensive modelling.
Moreover, the everyday human activities are affected by clouds which directly impact the weather conditions and are responsible for a large num-ber of locally significant phenomena such as precipitation (solid and liquid), lightning, strong winds, low visibility among others.
Although there has been a strong progress in physical contents of numer-ical models at all scales (from local area to climatolognumer-ical), the description of cloud processes remain a dominant source of uncertainty, because of the large variety of physical and chemical mechanisms involved in cloud formation and and interactions with radiation.
or-der to study the different cloud properties. Ground-based measurements of cloud cover have been traditionally made from visual observation for over hundred years, and a classification based on cloud height and shape has been introduced, while in the last decades instrumental measurements support or sometimes replace human observation.
Cloud structure and microphysical properties have been mainly studied by meteorological radar (ground-based or air-borne) since the early ’70s. Radar is able to probe the cloud structure with spatial and temporal resolution suitable for detailed observation of most relevant cloud processes.
The turning point in cloud studies has been reached after the launch of the meteorological satellites which sensors since the early ’60s have pro-vided a further observational tool for cloud studies from the space point of view. Passive sensor over broad wavelength spectrum (from visible to mi-crowave) are used to retrieve cloud characteristics from space, regardless if other instruments at the ground are available. Several climatology studies have taken advantages from satellites data since ’80s, and the International Satellite Cloud Climatology Project (ISSCP) is completely devoted to collect, filter, correct and disseminate data from the main worldwide available sensors since 1983, also producing useful cloud products at global scale. More re-cently, the improvements of sensor multispectral capabilities have been used to estimate different cloud microphysical properties from geostationary orbit, allowing the continuous monitoring of the temporal and spatial variability of the cloud system properties.
The aim of this work is analysing clouds characteristics using satellite data at different scales (from meteorological to climatological one) presenting new retrieval algorithms and methodologies of analysis to contribute to cloud studies in European and Mediterranean areas. In order to analyse cloud systems at different scale cloud parameters such as cloud cover, cloud optical thickness and cloud top temperature are considered at high and low temporal
and spatial resolution.
The high resolution (i.e. 3x3km2 and 15 minutes) cloud parameters
(in-cluding cloud particles effective radius) are estimated from Spinning En-hanced Visible and Infrared Imager (SEVIRI) data while clouds parameters at low resolution (i.e. 30x30km2 and 3 hours) are extracted from the ISCCP
database. Two retrieval algorithms are proposed to estimate high resolution parameter using SEVIRI data from visible to infrared spectral bands. One is a temporal statistical cloud mask algorithm that takes advantage from the high temporal resolution of the instrument. A dynamical statistical threshold applied on the brightness temperature difference (between two successive im-ages) at 10.8µmdiscriminates the cloudy from clear pixels. This cloud mask is tested comparing to the MODerate resolution Imaging Spectroradiometer (MODIS) operational product. The other algorithm uses a bispectral (visible and near infrared bands) retrieval scheme to estimate cloud optical thickness and cloud particles effective radius matching the SEVIRI reflectances with a series of look-up tables obtained by radiative transfer simulations. One application of these high resolution cloud parameters are the analysis of the temporal development of convective systems.
The cloud cover, cloud optical thickness and cloud top temperature at low resolution are analysed to describe the main characteristics of the cloud shields associated to Cut-off Low (COL) systems which play a crucial role in driving the meteorological conditions over the whole Mediterranean and European areas. Ten years of data from ISCCP and ERA-40 (by European Centre of Medium-range Weather Forecast re-analysis) databases are consid-ered respectively to detect COL events in Mediterranean and European areas and to analyse cloud products. Finally, the influence of the climatology in-dex North Atlantic Oscillation (NAO) on COL systems and their cloud cover associated to is shown.
rele-vance of clouds in climate and in meteorological forecasts, and presents the principal performances of the instruments available for clouds measurements. Chapter 2 deals with the signatures that atmospheric constituents leaves on radiation at visible and infrared wavelengths. Chapter 3 and 4 present the algorithms to retrieve high resolution parameters and some applications: the cloud mask (Chapter 3), the optical and effective radius (chapter 4). In chap-ter 5 the main characchap-teristics of the clouds patchap-tern associated to COLs are described using cloud parameters at low resolution. The conclusions and the perspectives of my work are drawn in last chapter.
Clouds in climatology and
meteorology
The aim of this chapter is to outline the role of clouds in the earth system, and to introduce the main operational tools available for cloud studies from both meteorological and climatological point of view. The climate is strongly influenced by cloud processes, in fact they are the most important regulator of the radiation budget of the earth-atmosphere systems. Clouds are im-portant in meteorology because of their link to precipitation and because of synoptic structure can be tracked observing clouds motion. Cloud studies are carried on at different scales in order to achieve different goals: at the climatological scale we are primarily interested in knowing the global cover-age and distribution of clouds, on the other hand at the meteorological scale the fine structure and the processes involved in cloud lifetime (formation, development and dissipation) are the principal topics.
Several kind of data are available in order to study clouds: ground-based observations by human observers and automatic systems, ground-based radar measurements, and satellite observations. These data give the chance of studying clouds from different point of view and retrieving several
character-istics at different level.
Several studies and project are devoted to cloud analysis, above all the International Satellite Cloud Climatology Project (ISCCP) and CloudSat the first satellite mission dedicated to clouds.
1.1
The role of clouds
One of the most stunning features of the images of earth from space are the clouds that move around our planet in quasi-organized large-scale sys-tems (Rossow and Cairns, 1995). The characteristic and movement of these coherent cloud features are primarily governed by the large-scale atmospheric circulation and, as such, are an essential manifestation of weather systems. Motions of synoptic-scale cloud masses, in turn, trace the circulation patterns of the atmosphere. By tracking movements of individual cloud elements we can also estimate the wind fields (Menzel, 2001).
These large cloud systems are not mere passive tracers of wide-scale move-ment of air. They exert an enormous influence on our weather and climate. Two main roles of clouds are:
• they are a fundamental stage of the cycle of water in the atmosphere: condensing water vapour and forming precipitation;
• they affect the radiative budget of the planet.
By modulating the distribution of heating within the atmosphere and on the surface, clouds influence the circulations of the atmosphere and oceans. The importance of clouds to the resultant redistribution of heating is high-light in the study of Gleckler and Coauthors (1995). They showed how poorly resolved clouds, through their effects on the surface radiation budget produce a discrepancy in the implied oceanic transport of heat poleward as simulated by a large number of climate models.
In this section the roles of clouds in the radiative budget are described and quantified using the results of Earth Radiation Budget Experiment (ERBE). The description of clouds in meteorological and climatological models are also reported.
1.1.1
Clouds in the earth radiative balance
The concept of cloud radiative forcing has been used extensively to study the impact of clouds on climate (Hartmann, 1994). The net cloud radiative forcing (CRF) at the top of the atmosphere is the sum of two contributions: cloud radiative forcing at short wave (CRFSW) and cloud radiative forcing at long wave (CRFLW), and it is defined as the difference between the radiative fluxes with and without clouds, in formulas:
CRF =CRF SW +CRF LW;
where
CRF LW =CRF LWcloudy−CRF LWclear;
CRF SW =S(αclear−α);
where S is the monthly incoming solar flux at the top of the atmosphere and α is the total sky albedo of the earth-atmosphere system. Here αclear
is the clear-sky albedo of the earth atmosphere system. CRFSW is usually negative.
Two roles of clouds in radiative budget are identified:
• cooling effect : the radiation at short wave is reflected by clouds there-fore a part of it (depending on the cloud type) does not reach the atmosphere level below the cloud and the surface;
• heating effect : the long wave radiation emitted by earth is absorbed and re-emitted (a portion of the energy to outer space and a fraction
back toward the surface) by clouds, therefore clouds contribute to in-crease the greenhouse effect.
The observations from the ERBE provided the first accurate estimate of the modulation of longwave and shortwave radiative fluxes at the top of the atmosphere by clouds (Ramanathan et al., 1989). Using the ERBE data, Harrison et al. (1990) have examined the seasonal variation of cloud radiative forcing: clouds significantly reduce the seasonal changes in the net radiative heating of the planet. This reduction is particularly strong over the mid- and high-latitude oceans, where they reduce the summer and spring solar heating by as much as 100−150W m−2. A number of studies (Ramanathan et al.,
1989; Harrison et al., 1990;Stephens and Greenwald, 1991; Hartmann and Doelling, 1991) have estimated that the global average SWCRF and LWCRF are approximately -50 W m−2 and 30 W m−2, respectively. The magnitude
of the net cloud radiative forcing, is generally larger in higher latitudes of the summer hemisphere. Hartmann and Doelling, 1991 examined the net radiative effectiveness of clouds in terms of a cloud factor angle defined in coordinates of reflected solar radiation versus outgoing longwave radiation (OLR). Their study suggested that ratio of the solar to the longwave effect of cloud is about 1.85 based on the regression method and 1.55 based on the comparison of clear sky and total sky fluxes.
The effect of cloud type on Earth’s Energy considering a global average is investigate in different works (Hartmann and Doelling, 1991; Chen et al., 1999). The main results are: low clouds make the largest contribution to the net energy balance of the earth, because they cover such a large area and because their albedo effect dominates their effect on emitted thermal radiation. High, optically thick clouds can also give a negative contribution to the energy balance, because their very high albedo overcome their low emission temperature.
Bony et al. (1997) examined the influence of sea surface temperature and large-scale circulation on cloud radiative forcing using National Cen-tres for Environmental Prediction-National Centre for Atmospheric Research (NCEP-NCAR) 40 yr reanalysis and ERBE datasets.
1.1.2
Clouds in climatology models
An accurate global cloud climatology is essential to develop physically based climate models: it can serve both as a source of input data and as mean of validation.
In the field of global climatology a cloudiness map covering all the globe is required to improve the understanding of the variations in the global radiative and hydrological budget. The spatial resolution in this case can be of the order of 100 km, with 10 vertical levels not equally spaced in height and pressure. In contrast, regional climatological studies need cloudiness maps with smaller spatial coverage, but with higher spatial resolution, say up to 25 km Hartmann (1994). At least three important effect in a climate model are
associated with the formation of clouds: (1) the condensation of water vapour and the associated release of latent heat and rain; (2) vertical transport of heat, moisture, and momentum by the motions associated with the cloud; (3) the interaction of the cloud particles with radiation (Arakawa, 1975). A cloud parametrization in a climate model should treat each of these effects consistently, but this has not been the case with every climate model. Most climate models include at least two types of clouds; convective clouds and large-scale supersaturation clouds. The main cloud processes that interact with the climate systems are summarized in figure 1.1.
Among convective clouds, cumulus convection are one of the most im-portant type of clouds considered in climatology model, because they play a central role in most of the interaction shown in figure 1.1, thus Arakawa (2004) dedicated a review to them. He made a review on the cumulus parametrization in which the major problems existing at present, and pos-sible approaches for future climate models are described. Cloud-resolving convective parametrization or superparameterization is a promising new ap-proach that can develop into a Multiscale Modelling Framework (MMF). It is emphasized that the use of such a framework can unify our currently di-versified modelling efforts and make verification of climate models against observations much more constructive than it is now. For instance the many individual cumulus clouds which occur in a large-scale atmospheric distur-bance have a time and space scales much smaller than the disturdistur-bance itself. Because of this scale separation, it may be possible to predict the time change of the large-scale disturbance by describing not each of the may individual clouds, but only their collective influence.
1.1.3
Clouds in meteorological models
The meteorological models need cloud information in order to improve cloud parametrization (through the knowledge of cloud processes) and to
provide good description of the initial state (collecting data from different resources).
The representation of clouds in numerical weather prediction models re-mains very difficult, because of the necessity of incorporating processes with different scales. For instance, if we considers mesoscale models with continen-tal coverage and horizoncontinen-tal spatial resolution of few kilometres, we have to solve complex problems of cloud microphysics. In general the parametriza-tion of cloud processes must be kept very simple, since the numerical in-tegrations must be carried out in a reasonable time. The parametrization of non convective clouds in weather prediction models has been applied in a much more straightforward manner, in particular two simple parametrization schemes are used in numerical models. In the first scheme, only condensa-tion of water vapour is considered while clouds are not parametrized. In the second scheme, the cloud water is predicted and the release of precipitation is parametrized in a simple way (Sundquist, 1977). These two schemes do not considers convective clouds, although convective processes are fundamen-tal at mesoscale resolution. In these classical method of parametrization of cloudiness the major limitation is the lack of a representation of the mesoscale organization of precipitation systems.
The increase in resolution of NWP has made even more complicate the problem of the parametrization of cloudiness (Straniforth and Mailhot, 1988). For instance, the current mesoscale models employed for routine regional forecasting use a combination of the convective and the stratiform conden-sation schemes (Straniforth and Mailhot, 1988). It is evident that the flow resolved on the mesh of these models does not represent the movement of air on scales important for generation of convective elements. Therefore the parametrization of convective cloudiness is still necessary in order to produce a realistic simulation. The most obvious improvement is the modification of the treatment of stratiform cloudiness by introducing a predictive equation
for cloud-water content (Sundquist and Schlesinger, 1988).
The importance of the predictive cloud-water field resides in the fact that the growth of small cloud particles to the size of precipitating particles could take for stratiform clouds several hours. Therefore, the introduction of a partition between precipitating water and cloud water should improve prediction of the onset of precipitation. Additionally, the cloud water could be advected by the horizontal wind and interact with the hydrological cycle of the model. The representation of this interaction in a weather prediction model is also essential to link different physical processes, including vertical turbulent mixing and radiative properties of the atmosphere (Pudykiewicz et al., 1991).
In various NWP models the Kain-Fritsch (KF) (Kain and Fritsch, 1993) convective parametrization scheme is used for predicting convective rain, which cannot be directly resolved by the model. It has been improved in specific convective environments using feedback from forecasters. Convec-tive updrafts in the KF scheme are represented using a steady-state one dimensional entraining/detraining plume model, where equivalent potential temperature and water vapour are both entrained and detrained. Most of the condensate produced in the updraft is converted to precipitation and a portion of this precipitation drives the downdraft through evaporative cool-ing effects. The remaincool-ing precipitation arrives at the surface. A cumulus parametrization scheme was proposed by Emanuel (1991). The heart of the scheme is the representation of moist convective transport within clouds (subcloud-scale drafts) using a buoyancy sorting technique, which determines the level of ascending or descending air parcels by finding the level where the liquid water potential temperature of the parcels equals that of the environ-ment. In order to improve cloud parametrization in NWP models different research models are analysed. The microphysical cloud structure has been studied using a research time-independent three-dimensional non-hydrostatic
model by Wang (2007). 5 classes of hydrometeors have been considered in thunderstorm structure: cloud water, cloud ice, rain snow, graupel/hail.
1.2
Main resources for cloud studies
Observations of cloud amount and type are an important tool in weather forecasting and climatology studies. Before the age of satellite, cloud amounts and cloud types were observed and recorded routinely at ground-based ob-servatories. With the coming of operational satellites, clouds may now be observed from both ground and satellite platform.
In this section the principal sources available to build a climatology of cloud cover are introduced. The data, obtained from ground-based or satel-lite, have different spatial and temporal resolution,and also cloud properties inferred by ground-based or satellite data have different characteristics.
The ground-based measurements of cloud cover are traditionally made from visual observation, and the classification is based on height and shape of clouds. In the last decades also instrumental measurements (i.e. ceilometers, visible and infrared sky cameras, meteorological radar) are placed side by side to human observation: they integrate cloud cover measurements giving more information about height, temperature, hydrometeors of cloud lower levels. Moreover by using satellite besides cloud cover other cloud parameters, linked to radiative proprieties, can be inferred: cloud optical thickness, effective cloud radius of cloud particles, cloud top temperature and pressure.
1.2.1
Synoptic surface observation
Synoptic observations are a set of different meteorological parameters measured from ground stations. Each national or regional meteorological service is in charge of the station net into its territory.
Measurements and observations are made at fixed hours (typically ev-ery 3 hours). The cloud cover and other cloud parameters as height and type of clouds are obtained by visual observation: cloud cover is recorded as sky eighth of cloudiness (okta code). Although the Word Meteorologi-cal Organization (WMO) has defined standard methodologies to offer high quality and homogeneous data, the visual observation datasets are influenced by subjective interpretation and personal experience. The synoptic observa-tions have problems to obtain high quality data in daily cycle due to low resolution measurements during nighttime. The availability of data is also a problem, for example getting a continuous dataset at sea surface. In spite of these, synoptic observations are the unique tool available to build a clima-tology over 50 years. The focus of cloudiness climaclima-tology studies is to get an accurate long time set of data for regional area rather than having time dis-continuous dataset for global coverage. Using synoptic observations several cloudiness climatology studies (Henderson-Sellers, 1992; Karl and Streurer, 1998; Sun and Groisman, 2000) are realised for long period, over hundred years. They showed a tendency toward an increase in cloudiness in most areas. Positive trends have been reported for Europe, the United States, the former U.S.S.R., Canada and Australia. There are some indications that the increase in cloudiness is the cause of the observed reduction in the diurnal range of surface temperature (Karl et al., 1993). Besides the areas with pos-itive trends in cloudiness, there are, however, others, such as China, that mainly have the opposite behaviour (Kaiser, 1998; Kaiser, 2000). Moreover Maugeri et Al. 2001 have shown that there is a highly significant negative trend in total cloud amount all over Italy. It is evident in all seasons and is particularly steep in winter where both in Northern and Southern Italy the decrease exceeds 1 okta in 50 years.
Recently many meteorological services are getting automatic observations in order to increase the accuracy of data and reduce costs. In the United
States ASOS (Automated Surface Observing System) systems have been used for over ten years. These systems provide, besides traditional meteorolog-ical parameters, cloud amount and height. The main instrument is laser beam celoimeter, it routinely sends laser pulse in vertical path and it mea-sures backscattered radiation. Although the cloud data are related only to the portion of sky above the instrument, the measurements are representa-tive because of their time sampling (every 30 seconds). In United Kingdom MetOffice has been using a net of automatic stations where the cloud cover has been measured by sky camera with fish-eyes lens. Sky camera images are provided at infrared and visible frequencies.
1.2.2
Ground-based radar
The radar ground-based at different wavelengths is able to probe the cloud structure with spatial and temporal resolution proper for detailed ob-servation of most cloud processes. Radar meteorology, during his halfcentury history, allowed the recognition of typical cloud structures and their classi-fication, especially for convective systems, and, given the great operational capabilities, is one of the pillars of any weather monitoring system (Atlas, 1990).
The radar is an active instrument that emits radiation at a known fre-quency and intensity, and measures the part of the same radiation that is backscattered by the target. The typical radar frequencies are Microwave: MW radiation is able to penetrate cloud envelop and rain layers. A wide range of e.m. wavelengths (λ) are used for meteorological application as is shown in table 1.1. In particular the S-band radar, long-range precipitation radar is broadly used in USA and in tropical regions where the precipitations are heavy. The C-band radar, largely used for precipitation in Europe is the best compromise between engineering problems and meteorological perfor-mance. The X-band radar with a smaller λ allows to reduce the validation
Frequency(GHz) Wavelength (cm) Band Meteorological application 2-4 15.00-7.50 S long-range precipitation (USA-tropical) 4-8 7.50-3.75 C precipitation (Europe-Mediterranean) 8-12 3.75-2.40 X precipitation (mountain regions) 27-40 1.13-0.75 Ka cloud droplet 40-75 0.75-0.40 V cloud droplet 75-110 0.40-0.27 W cloud droplet
Table 1.1: Frequency bands of radar.
errors due to non-meteorological phenomena, for instance it is used to detect precipitation in mountains regions where the relieves obstruct and damage the signal. Finally the cloud radar as the Ka, V and W band radar (with
λ less than 1 cm) allow the detection of cloud droplets, but are affected by strong attenuation phenomenon
The main goal of a weather radar is to retrieve information from the cloud precipitation layers. In most national meteorological services the radar net-work is the primary source of precipitation information. Although most of meteorological radar applications are dedicated to precipitation, cloud struc-ture and proprieties are also observed. Radar observation makes possible not only the detection of typical structures of convective clouds like vortices, hooks, mesoscale organization (see Atlas, 1990 and Doviak and Zrnic, 1993 among others), but also the classification of hydrometeor types. Ground-based cloud radars are used to estimate the vertical profile of cloud micro-physical characteristics, deriving cloud properties (as liquid water content or effective radius) from a single measurement of radar reflectivity (e. g. see
Fox and Illingworth, 1997 for stratocumulus and Brown et al., 1995 for cirrus clouds). A supercell storm was observed in Colorado by Marwitz (1972) using a radar in S-bands. These observations clarified and refined the descriptive model of super cell storms by Browing (1965). Clothiaux et al. (1995) have demonstrated that a ground based 94 GHz radar can be used to investigate parameters such as cloud layering, depth, and boundaries. Further radar data allowed to infer insights of tornado structures (e.g. Wurman and Gill, 2000, and Dowell et al., 2004).
Special features of convective storms using radar reflectivity and micro-physical analysis were studied also in Europe from 1970s. The presence in the Po Valley of hailstorms with peculiar characteristics was evidenced by Prodi (1974) using radar and conventional data: motion characteristics and hail pattern were classified and related to wind shear conditions, while mi-crophysical and chemical analysis were carried out on hail samples collected in different positions of the storm and at different life stages and compared with reflectivity by Prodi and Wirth (1973). P.F. et al. (1991) carried on a study on the meso- and micro-scale structure of the kinematics and precip-itation formation of a squall line which occurred in Southern Germany and initiated as part of the synoptic-scale frontal zone, using polarimetric and Doppler radar measurements. S-band doppler Radar observations of precip-itation cloud structure on the Mediterranean side of the Alps were made by Houze et al. (2001) during Mesoscale Alpine Programs (MAP).
Radar is also placed on board satellite. For the first time, in 1997, in order to detect precipitation, Precipitation Radar (PR) was launched on board TRMM (Tropical Rainfall Measuring Mission, staff, 2007) and in 2006 in order to detect clouds, Cloud Profiling Radar (CPR) was launched on board CloudSat (these mission will be more extensively described in section 1.3.2).
1.2.3
Space-borne passive sensors
The satellite history goes back to 1960 when the US polar-orbit satel-lite TIROS-1 was launched, this satelsatel-lite was the first to be fully dedicated to meteorology. The image-making instrument on TIROS-1 was a vidicon camera, then it has been replaced with multispectral radiometer. The most recent are geostationary satellite, GOES was launched by USA in 1975, and in 1977 METEOSAT by Europe. Thus over 30 years of data are available in order to join ground-based observations, and to integrate the ground based observing systems.
Cloud cover retrieval from satellites can help to deal with some deficiencies of the other observing systems, spatial coverage above all. However the price to pay is the degradation for spatial and temporal resolution and the lower reliability of the cloud parameter estimation. Most satellite sensors are passive instruments, as they merely collect radiation emitted from the Earth-atmosphere system. Nearly all present meteorological satellites are in one of two type orbits, sunsynchronous also called, Low Earth Orbit (LEO) and geosynchronous and also geostationary (GEO). In this section we will describe the main instruments on board satellite in GEO and LEO orbits.
A LEO satellite travels on a near-circular orbit around the globe. The or-bit can be located between 400 and 1500 km height from the Earth’s surface, and the most of them scan the same Earth portions two times per day. This orbit allows to scan also polar region. A GEO spacecraft orbits at 36.000 km, at the same angular velocity of the Earth rotation, thus remaining in a fixed nominal position with respect to the Earth’s surface, the sensor scans the disk every 15-30 minutes depending on the system. Until now only sen-sors in VISible (VIS) and InfraRed (IR) can operate on board geostationary satellite. The advantages of estimate cloudiness and clouds parameters by GEO data are the wide coverage and the good spatial (around 3x3 km2at
satellite has an higher spatial resolution than GEO allowing the detection of more details of clouds and their proprieties, to the detriment of low temporal resolution.
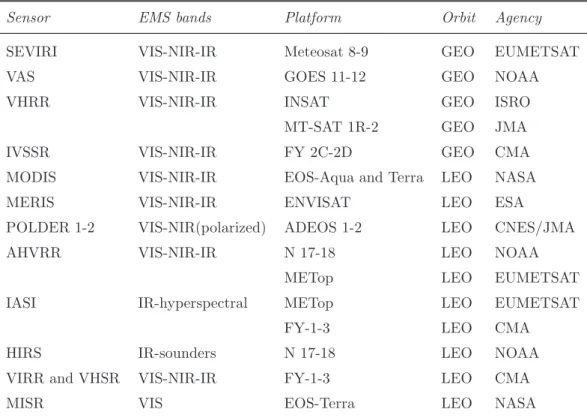
The characteristics of the satellites used for cloud studies are reported in table 1.2.
Sensor EMS bands Platform Orbit Agency
SEVIRI VIS-NIR-IR Meteosat 8-9 GEO EUMETSAT VAS VIS-NIR-IR GOES 11-12 GEO NOAA VHRR VIS-NIR-IR INSAT GEO ISRO
MT-SAT 1R-2 GEO JMA IVSSR VIS-NIR-IR FY 2C-2D GEO CMA MODIS VIS-NIR-IR EOS-Aqua and Terra LEO NASA MERIS VIS-NIR-IR ENVISAT LEO ESA
POLDER 1-2 VIS-NIR(polarized) ADEOS 1-2 LEO CNES/JMA AHVRR VIS-NIR-IR N 17-18 LEO NOAA
METop LEO EUMETSAT IASI IR-hyperspectral METop LEO EUMETSAT
FY-1-3 LEO CMA HIRS IR-sounders N 17-18 LEO NOAA VIRR and VHSR VIS-NIR-IR FY-1-3 LEO CMA
MISR VIS EOS-Terra LEO NASA
Table 1.2: Main satellites description (orbit, sensor and range frequencies of sen-sor) employed to study cloud. Acronyms are listed in Acronym section.
The International Commission on Illumination (CIE) defines visible and infrared part of electromagnetic spectrum into these regions:
• VIS: VISible, [0.38,0.75]µm;
• SWIR: Short wave InfraRed, [0.75,1.40]µm;
• LWIR: LongWave InfraRed, [8.00,15.00]µm;
• FIR: Far InfraRed, [15.00,1000.00]µm;
but most sensors have a bandwidth that covers wavelength in more CIE regions. Thus we re-arranged the classification to a more practical use within this range:
• VIS: VISible, [0.4,1] µm;
• NIR: Near InfraRed, [1,3]µm;
• IR: InfraRed, [3,15] µm;
• MW: MicroWave, [0.1,100] cm;
1.2.4
Space-borne observation’s state of art
Space-borne sensors collecting data in the VIS, IR and MW part of the spectrum allow analysis of cloud features and cloud structure. One of the early satellite-based cloud studies was probably the introduction of a classifi-cation of Mesoscale Convective Systems and Complexes, based on cloud area properties using IR data from geostationary sensors (Maddox, 1980): for this study the broad view provided by geostationary sensor made the observation of the mesoscale organisation of convection possible. Along this line, Morel and Senesi (2002) used similar approach to perform a climatological study on organized convection in the European area, taking advantage of long lasting time series of Meteosat observation. Other pioneering work, more oriented to operational use of satellite data. proposed techniques to use satellite data in a nowcasting environment (Purdom, 1982) and to better define conceptual models of meteorological systems (Browning and Hill, 1984). More detailed analysis of cloud top was made by Chang and Li (2002) that proposed a
cloud microphysics retrieval technique applied to the MODIS data to esti-mate the vertical profile of cloud particle effective radius (Re) for stratiform water clouds using multispectral near-infrared (NIR) measurements. Rosen-feld and Gutman (1994) using a multispectral (5 channels from VIS to IR) analysis retrieved the effective radius.
Using low orbit sensors, the thermal structure of convective cloud top has been analysed describing structures such as U- and V-shapes, and warm cores (Negri, 1982; Heymsfield and Blackmer, 1988). Different work reported the technique to construct the cloud structure using ground-based data com-bined to satellite. For example Celano (2007) analysed the vertical cloud structure combined ground-based meteorological radar in C-band to data from SEVIRI and MODIS in VIS and NIR bands. The classification and re-trieval algorithms are applied and the cloud volume is reconstructed in terms of hydrometeor type distribution, cloud top temperature, cloud particles ef-fective radius, cloud optical depth, cloud top particles phase and rainrate at the ground. Ackerman and Cox (1998) estimate the cloud cover from ground-based sky-camera and satellite data during GARP Atlantic Tropical Experiment (GATE). They presented a method which enables to construct a three-dimensional representation of cloud structure. The ground-based mea-surements are also employed to evaluate some cloud characteristics retrieved by satellite. Wolters et al. (2007) evaluate the cloud-phase retrieval method for SEVIRI, MODIS and ISCCP (International Satellite Cloud Climatology Project) using ground-based lidar and cloud radar data.
The Microwave spectrum is also investigated to analyse cloud feature and structure. As the case of visible and infrared techniques, microwave tech-niques can benefit by the use of a cloud model, Mugnai and Smith (1984) were the first to couple two-dimensional, time-dependent cloud model with a microwave radiative transfer model to produce estimates of microwave bright-ness temperature at satellite altitude from convective clouds. These studies
continued (Mugnai and Smith, 1988a, Mugnai and Smith, 1988b, Adler et al., 1991) and had revealed the importance of cloud water, ice, crystal, and verti-cal microphysiverti-cal structure of the cloud on the upwelling microwave radiation. Other works which employed MW radiation to detect cloud structure, are focused on Mesoscale Convective Systems (MCS). The analysis of type, size and intensity of convective systems estimated from 85 GHz gave a contribu-tion to tropical rainfall (Mohr et al., 1998). The cloud clusters were grouped into four classes of basic system types, based on size and minimum enclosed 85-GHz brightness temperature to indicate the presence or absence of large areas of active, deep convection.
Different techniques have also been proposed to classify cloud systems with multispectral imagery. Several cloud detection tests were used in the cloud mask algorithm, discriminating clear sky from clouds, which consid-ered 14 of the 36 MODIS bands from VIS to IR (Ackerman et al., 1998), and provided a near real time product. Five channels AVHRR images have been used by Saunders and Kriebel (1987), coupled with radiative transfer calcu-lation to infer cloud cover and cloud type, for climatological studies, while (Karlsson, 1989) developed an operational scheme for Scandinavian region, where the low orbit satellites ensures good coverage. Other approaches, based on clustering techniques (Desbois et al., 1982; Porc´u and Levizzani, 1992), neural networks Bankert (1994), apply on both low orbit or geostationary satellite data. Others techniques of cloud mask and cloud classification will be presented in section 3.1.1.
A particular emphasis has been devoted, since early days of satellite mete-orology, to the rainfall estimation from satellite, trying to relate precipitation at the ground with cloud top structures following statistical or physical ap-proaches. A comprehensive review of techniques and relevant issues can be found in Barrett and Martin (1981), while more recent developments are treated in Levizzani (2003).
The spectrally detailed VIS-NIR-IR cloud analysis, now available on geosynchronous platforms, makes rain delineation algorithms physically based on the retrieval of cloud particles effective radius (Re) possible (Rosenfeld and Lensky, 1998; Capacci et al., 2004).
1.3
International cloud projects
During last decades, since the satellite data era was born, several satel-lites (see table 1.2) which some sensor’s channels have been employed in cloud detection were launched. But only one mission has been dedicated to cloud (CLoudSat). In addition ISCCP project collects data to produce global cloud climatology. In this section CloudSat mission and ISCCP project are described.
Moreover there are many other mission not exclusively dedicated to clouds but that includes clouds studies and products. Some of these missions are sketched out in this section.
1.3.1
ISCCP
The International Satellite Climatology Project (ISCCP) is the first project of the World Climate Research Programmer (WCRP) (Schiffer and Rossow, 1983). Its goal is to collect and analyse satellite radiance measurements to infer the global distribution of clouds, their properties, and their diurnal, seasonal, and interannual variations (Rossow and Shiffer, 1999). Data col-lection began in July 1983 and is currently planned to continue through 30 June 2010. The resulting datasets and analysis products are used to im-prove the understanding and the modelling of the role of clouds in climate. Its primary focus is the elucidation of the effects of clouds on the radiation balance. These data can also used to support many other cloud studies, including understanding of the hydrological cycle.
DX D1 D2
(pixel level) (gridded) (Climatological)
spatial Res. 30km 280km 280km
mapped-pixels equal-area grid equal-area grid
temporal Res. 3 hr 3hr monthly
coverage individual satellites global global
contents Calibrated radiances, Spatial averages of Monthly average cloud and surface prop. DX quantities including of D1 quantities properties from including properties mean including radiative analysis. of cloud types. diurnal cycle.
Table 1.3: 3 levels of ISCCP cloud product.
Figure 1.2: The anomalies to the percentage of mean cloud amount from 1983 to 2008 by the D2-ISCCP product.
Figure 1.3: The Percentage of cloud cover by D2 product.
Data are collected from the suite of weather satellites operated by several nations and processed by several groups in government agencies, laboratories, and universities.
The global coverage is obtained by using combined 5 geostationary satel-lites (GOES-E, GOES-W, METEOSAT, GMS(MTsat), INSAT) and one or more polar (mainly NOAA). The data from polar are necessary to cover polar regions, where geostationary data are degraded because of the view satellite angle.
*1.6 The cloud products are provided at different spatial and temporal resolution and with different contents. The DX, D1, D2 products are de-scribed in table 1.3. The DX is the product at highest resolution: temporal is 3 hours and the nominal spatial resolution is 30km, its coverage is individual satellite. The D1 and D2 have 280km of spatial resolution at equal-area grid and a global coverage but D2 is provided every 3 hours, while D2 monthly. An example of the percentage of coverage of D2 products is shown in figure 1.3 and the the anomalies to the mean cloud amounts from the 1983 to 2008 calculated by D2 products are plotted in figure 1.2
1.3.2
CloudSat
CloudSat is a NASA Earth Sciences Systems Pathfinder (ESSP) mission. ESSP missions are relatively low cost missions that require that the mission be built, tested and launched in a short time interval (normally within 3 years).
The purpose of the experimental CloudSat mission is to measure the ver-tical structure of clouds from space and, for the first time, simultaneously observe clouds and precipitation. CloudSat seeks to help solving some de-ficient knowledge of cloud and stimulate improvements in both forecasting and climate prediction. The primary CloudSat instrument is a 94-GHz, nadir pointing, Cloud Profiling Radar (CPR) which measures the power backscat-tered by clouds as a function of distance from radar. The CPR Pulse Repe-tition Frequency (PRF) is 4300 pulse/sec, the footprint for a single profile is approximately 1.3 km (across-track) by 1.7 Km (along-track). CPR profile is generated every 1.1 Km along track and each one has 125 vertical ”bins” thicken 24 m. (Stephens et al., 2002). A millimetre-wave radar operated in a vertically pointing mode, as CPR, is an attractive solution for the ob-servation of low-altitude low-reflectivity clouds such as fair weather cumuli (Lhermitte, 1988).
A unique aspect of this mission is the fact that CloudSat is flying in forma-tion with other Earth Sciences missions. CloudSat is a part of a constellaforma-tion of satellites (the A-Train) that currently include NASA’s EOS Aqua and Aura satellites as well as a NASA-CNES lidar satellite (CALIPSO) and CNES satellite carrying polarimeter (PARASOL). A unique feature that CloudSat brings to the constellation is the ability to fly a precise orbit enabling the fields of view of the CloudSat radar to be overlapped with the lidar foot-print and the other measurements of the constellation. The precision of this overlap creates a unique multi-satellite observing system for studying the atmosphere processes of the hydrological cycle.
Figure 1.4: A-train instruments.
1.3.3
Other missions and projects
Medium-spectral Resolution Imaging Spectrometer (MERIS) mission has been launched by ESA in March 2002. MERIS primary scope is observ-ing ocean colour. While secondary objectives of the MERIS mission are directed to the understanding of atmospheric parameters associated with clouds, water vapour and aerosols in addition to land surface parameters. The large influence of the atmosphere on the diversity of target reflectances to be observed by MERIS necessitates a rather complex radiometric cor-rection scheme. In order to verify the corcor-rections of the data sets various validation procedures have and are being developed using not only different radiative transfer procedures, but also different atmospheric components as input to complex simulation taking advantage of a MERIS system and data simulator (Albert et al., 2001). However, atmospheric constituents are not only being treated as noise and removed by the MERIS atmospheric correc-tion scheme, but also there is a considerable range of ”by-products” leading to valuable geophysical variables such as: cloud top height, cloud albedo, water vapour column abundance.
observa-tions is Polarization and Directionality of the Earth’s Reflectances (POLDER). This instrument is designed to accurate observations of the polarized and di-rectional solar radiation reflected by Earth-atmosphere system. The first (POLDER-1) was launched in 1996 aboard the Japanese ADEOS-1 (AD-vanced Earth Observing Satellite) platform, and the second (POLDER-2) in 2002 on board ADEOS-2. The sensor’s unique features, compared to the cur-rent instrument, include its ability to: 1) measure polarized reflectance in the visible and near infrared spectral regions; 2) observe Earth target reflectance from 12 directions during a single satellite pass; 3) operate in two dynamic modes in order to achieve both high signal to noise ratio and wide dynamic range (Deschamps et al., 1994). For cloud analysis POLDER measurements are processed to produce cloud product such as cloud optical and physical parameters (more details in Buriez and Coauthors, 1997), this processing includes cloud detection (Breon and S., 1998).
Statistics on clouds have been compiled from the High-resolution Infrared Radiation Sounder (HIRS) sensors on the NOAA satellites since June 1989 by Wisconsin University. The HIRS channels with partial CO2 absorption
from 13-15µm, provides the detecting semi-transparent clouds. The method has also been referred to as ”CO2 Slicing.” (Wylie et al., 1994; Wylie and
Menzel, 1999). These cloud statistics were compiled as a complement to the ISCCP. The ISCCP currently does not use the HIRS data for cloud detection and height determination. The Wisconsin HIRS Cloud Climatology reports more clouds in the upper troposphere than the ISCCP. A comparison of the two data sets can be found in Jin et al., 1996.
New types of information for scientists studying Earth’s climate are pro-vided by Multi-angle Imaging SpectroRadiometer (MISR). Viewing the sunlit Earth simultaneously at nine widely spaced angles, MISR provides ongoing global coverage with high spatial detail. Its imagery is carefully calibrated to provide accurate measures of the brightness, contrast, and colour of reflected
sunlight. MISR has four spectral bands centred at 446 nm, 558 nm, 672 nm, and 866 nm. It views the earth with its nine pushbroom cameras-four forward, one nadir, and four backward looking. Relative to the earth surface, the viewing angles are 0 26.1, 45.6, 60.0, and 70.5. The time interval for a scene to be viewed by all cameras is 7 min, and the swath width is about 400 km. The spatial resolution ranges from 275 m to 1100 m, depending on spectral channel and camera (Diner et al., 1998). MISR instrument is flying onboard the polar platform EOS-Terra. Due to its unique nine-angles configuration, MISR can retrieve cloud parameters such as cloud-motion vec-tors ans cloud-top heights using a purely geometrical technique that involves locating the same cloud features at different viewing angles (Moroney et al., 2002). These clouds parameters are products available by MISR mission.
There are also different climatology international project not directly in-terested on clouds, but focus on climate change, energetic budget and hy-drological cycle in which clouds play an important role. These projects often use the results of specific clouds project. For example the ISCCP results and data are into The Global Energy and Water Cycle Experiment (GEWEX)(more details in: http://www.gewex.org/gewex overview.html) and in the the World Climate Research Programme (WCRP)(more detail:
Cloud remote sensing at
VIS,NIR,IR wavelenghts
Energy transfer from one place to another essentially is accomplished by three processes. Conduction is the transfer of kinetic energy of atoms or molecules by contact among molecules travelling at varying speeds. Convec-tion is the physical displacement of matter in gases or liquids. Radiation is the process whereby energy is transferred across space without the necessity of transfer medium. This chapter illustrates the main interactions between radiation and atmosphere.
The observation of a target by a device separated by some distance is the act of remote sensing: space borne sensor remote sensing for meteoro-logical purposes have been largely confined to passive detection of radiation emanating from the earth/atmosphere system.
The basic principle associated with remote sensing of the atmospheric components (gases, aerosols and cloud particles) involves the interpretation of radiometric measurements of electromagnetic radiation in specific spectral intervals which are sensitive to some physical aspects of the medium.
incident wave producing a “signature” in the amplitude, phase or spectral composition each depends on composition and structure of the medium. The medium scatters, absorbs and emits electromagnetic fields in different ways depending on the wavelength considered. This means that radiation at different wavelength can bring to the sensor different information (this is the main reason for using multispectral remote sensing).
After an introduction to fundamental radiometric quantities, in this chap-ter the basic theory of VIS-NIR-IR radiative transfer in the atmosphere is outlined. Finally some cloud parameters are presented. Reference texts for this chapter are Liou (2002), Stephens (1994) and Kidder and Vonder-Haar (1995).
2.1
Radiometric quantities
Many of the units used to quantify the electromagnetic (e.m.) radiation are based on energy. The rate of energy (E) transfer by e.m. radiation is called theradiant flux, which has units of energy per unit time. It is denoted by:
F =dE/dt (2.1)
and it is expresses in watt (W =J/s). The radiant flux density is the ra-diant flux crossing a unit area, measured inW/m2, and it is called irradiance
(E). All energy-based quantities denoted by the words monochromatic or
spectral indicate the wavelength dependence of the radiation. A subscript λ
orν is used to indicate whether wavelength or frequency is being considered. In general, the irradiance upon an element of surface area may consist of contributions that come from all directions. It is sometimes necessary to identify the part of the irradiance that is coming from directions within some specified infinitesimal arc of solid angle dΩ (as is shown in figure 2.1). The irradiance per unit solid angle is called radiance,
Figure 2.1: Radiant energy toward theΩˆ direction and across the surface dA.
Iλ =
dE
dt dA dλ dΩ (2.2)
it is measured in W/m2µm sr. With the monochromatic radiance (also
called spectral radiance Lλ) definition, radiance is readily seen to be the
integral over all wavelength of frequencies:
I = Z ∞ 0 Iλdλ= Z ∞ 0 Iν dν (2.3) so that: Iλ =− ν dλIλ = ν2 c Iλ (2.4)
where cis the speed of light.
In order to express quantitatively the relationship between irradiance and radiance , it is necessary to define the zenith angle (θ) as the angle between the direction of the radiation and the normal to the surface (see figure 2.1). The component of the radiance normal to the surface is given by Iλ cosθ.
The irradiance represents the combined effects of the normal component of the radiation coming from the whole hemisphere; that is
Eλ =
Z
Ω
where in spherical coordinates dΩ =sinθ dθ dϕ.
A radiation field is said to be isotropic if Iλ(~s,Ω) does not depend on ˆˆ Ω,
so thatEλ =π Iλ(~s), and homogeneous if Iλ(~s,Ω) does not depend onˆ ~s.
Radiance or specific intensity has the useful property of being, in free space, independent of distance from an object, as the viewing angle is not changed. In fact, both the irradiance and the surface subtended solid angle will inversely decrease with the square of the distance, so that in the radiance (the ratio between these two quantities) the distance dependence will cancel out.
2.2
Interactions between radiation and
matter
One basic type of interaction between radiation and matter can be sum-marized by a photon transferring all of its energy to an atom or a molecule and thus being removed from the radiation field. The energy of the photon raises an electron to a higher energy level or a molecule to higher rotational or vibrational states. This increase in energy of the receiving atom or molecule can be released in several different ways.
Radiation interacts with atmospheric components with three different mechanisms:
• absorption: is the way by which the energy of a photon is taken up by matter, typically the electrons of an atom or molecules. The activated molecule (or atom) collides with another molecule, and drops back into a lower energy state; the energy freed becomes kinetic energy of the molecules and corresponds to warming the gas. In this case the photon is permanently lost and the radiation field attenuated.
(ther-mal energy) into electromagnetic energy (photons). This occurs when molecules are activated by collisions with each other and the activation energy is emitted as photons. Furthermore, it is a process by which the energy of a photon is released by another entity, for example, by an atom whose electrons make a transition between two electronic energy levels.
• scattering: a photon is absorbed by the molecule and its energy in-crease. When this energy is released a photon identical to the absorbed one except for its direction of propagation is emitted. Thus, a spon-taneous transition drops back the molecule into its original state. The photon remains part of the radiation field but the beam is reradiated in all directions.
2.2.1
Concepts of scattering
Blue sky, white clouds, rainbows and halos are all optical phenomena produced by scattering. Scattering is a fundamental physical process associ-ated with light and its interaction with matter. It occurs at all wavelengths throughout the entire electromagnetic spectrum.
The particles, that scatters energy along the path of electromagnetic wave, may be thought of as a point of source of the scattered energy. In the atmosphere, the particles responsible for scattering cover the sizes from gas molecules (∼ 10−4µm) to aerosols (∼ 1µm), water droplets (∼ 10µm),
ice crystals (∼100µm), and large raindrops and hail particles (∼1cm). A small anisotropic particle tends to scatter electromagnetic wave equally into the forward and backward directions. When the particle becomes larger, the scattered energy is increasingly concentrated in the forward directions. Distribution of the scattered energy involving spherical and certain symmet-rical particles may be quantitatively determined by means of the
electromag-netic wave theory (how can be expressed in next section).
In a scattering volume, which contains many particles, each particle is exposed to, and also scatters, the electromagnetic wave that as already been scattered by other particles. This phenomena is known as multiple scattering. The effect of particle size on scattering is inferred by the physical term
size parameter. For spherical particle it is defined as x = 2πa/λ, where a is the particle radius andλ is the incident wavelength. By using x we can find three different scattering regions:
• Rayleigh scattering, whenx≪1. This is the case of scattering of visible radiation by atmospheric molecules;
• Mie scattering, when x& 1. In this case particle sizes are comparable to or larger than wavelength, for example scattering of NIR radiation by cloud particle and aerosols. This scattering will be treated in next section;
• geometric optics, when x ≫ 1. In this case the angular distribution of scattered radiation can be described by the principles of geometric optics. For instance rain droplets scatter VIS-NIR radiation.
Mie scattering
Considering a classic physical-based approach, we can express the radi-ation passing through the atmosphere or matter as a linear combinradi-ation of monochromatic electromagnetic fields:
~
Ec =E0~ ei~k·~x−iω t H~c =H0~ ei~k·~x−iω t (2.6)
with E0~ and H0~ steady vector.
In general the scattering problem is: for a given object of known orienta-tion, shape, size and optical property (refraction index), and for an incident
monochromatic wave, determining the electromagnetic field inside and out-side the object.
The monochromatic electromagnetic field as indicated in the formula 2.6 has to satisfy the Maxwell equations inside and outside the object. This is a very complicated mathematical problem that, in general, can be solved only by numerical computation.
However assuming spherical and homogeneous particles the problem can be solved by Mie theory. The Mie solution in the far-field approximation consists of the explicit form of the diagonal scattering matrix componentsS1
and S2 in the following formula:
Ek E⊥ λ,sca = e ik(s−z) −iks S2 0 0 S1 Ek E⊥ λ,i (2.7)
wheresis the field propagation path and the incident and scattered fields are expressed according to the two orthogonal vectorial bases showed in fig-ure 2.2. The functions S1 and S2 are series of Riccati-Bessel, Bessel and Legendre function linear combinations. We do not explicitly specify them, but it should be emphasised that for a fixed wavelength they depend upon the refraction indexmλ, the scattering angleθand the size parameterx. The
scattering angle is the angle θ in figure 2.2. Thus:
Sλ,1 =Sλ,1 (r, mλ, θ)
Sλ,2 =Sλ,2 (r, mλ, θ)
Once the incident field Eλ,i is given and the scattering fieldEλ,sca
deter-mined from 2.7, it is possible to calculate some important quantities useful in describing the interaction of the radiation with an ensemble of atmospheric objects.
The cross section is defined as the analogous to the geometrical area of a particle, to denote the amount of energy removed from the original beam by
Figure 2.2: Scattering by homogeneous spherical particles
the particle, so its dimension is a surface [m2]. Considering a sphere around
the object, where we integrate the energy in time unit absorbed, scattered and extinguished: Wabs,WscaandWext, scattering, absorption and extinction
cross sections parameters are defined in this way:
σλ,abs = Wa Ii σλ,sca = Ws Ii σλ,ext= Wext Ii , (2.8)
Also, the extinction cross section, in unit of area, is the sum of scattering and absorption cross sections:
The calculation of the powers W is possible using the functions S1 and S2. As the flux of energy is calculated through a sphere around the object, the dependence upon the scattering angle is lost, so the cross sections depend only upon two parameters:
σλ,abs =fλ,abs(r, m) σλ,sca =fλ,sca(r, m) σλ,ext=fλ,ext(r, m),(2.10)
To know the scattering direction, it is necessary to define the phase func-tion: pλ ≡ 1 σλ,sca dσλ,sca dΩ =fλ,p(r, m, θ) (2.11) We introduce two other useful parameters: The single particle albedo:
ωλ =
σλ,sca
σλ,ext
(2.12)
and the asymmetric parameter
gλ ≡ hcosθi =
Z
4π
pλ cosθ dΩ (2.13)
The first tells us how well the particle reflects the radiation. For zero albedo the incident radiation is not scattered at all, and for an albedo value of 1 it is all reflected. The asymmetry parameter g is used to evaluate the main scattering direction. When its value is positive, the main scattering is forward, when negative, backscattering is dominant.
2.2.2
The black body radiation
The laws of blackbody radiation are basic to an understanding of the absorption and emission processes.
According to Planck’s radiation law, a blackbody emits unpolarised radia-tion uniformly in all direcradia-tions with a spectral brightness or specific intensity:
(Bλ ≡Iλ)black body = 2h c2 λ5 1 e hc λKB T −1 ! . (2.14)
whereKB is Boltzman’s constant, his the Plank,cis the velocity of light
and T is the absolute temperature.
For any temperatureT,Bλ(T) has a single maximum at a wavelength that
may be determined by setting the partial derivative of Bλ(T) with respect
toλ equal zero. The results is known as Wien’s displacement law:
λmaxT = 2897.8µm K, (2.15)
whereλmax is the wavelength (expressed in micrometres) of maximum
emis-sion for a blackbody at temperatureT (expressed in Kelvin). The solid black line in fig. ?? shows this relationship.
The Plank function have two different behaviours: referred to the Rayleigh-Jeans distribution: Bλ = 2c KBT λ4 when 2hc λKBT ≪1 (2.16)
and referred to as the Wien distribution:
Bλ(T) = 2h c2 λ5 e −h c/KBλT when h c KBλT ≫1 (2.17) Nonblackbodies
Since real material is not a perfectly blackbody we can be quantify how closely it approximates a blackbody. Theemittance of a body is defined as:
ελ =
emitted radiation at λ Bλ
(2.18)
Emittance can be a function of temperature and viewing geometry as well as wavelength. For a blackbody ελ = 1. Three related quantities describe the
mechanisms of radiation incident on a body:
αλ =
absorbed radiation at λ
incident radiation at λ, (2.19)
ρλ =
ref lected radiation at λ
incident radiation at λ , (2.20)
τλ =
trasmitted radiation at λ
incident radiation at λ . (2.21)
respectively absorptance, reflectance and trasmittance. Because these three processes are the only possibilities for the incident radiation by energy con-servation, each quantity must be between zero and one, and
αλ+ρλ+τλ ≡1. (2.22)
Kirchhoff discovered that a body is exactly as good an absorber as it is an emitter. This is summarized inKirchhoff ’s law:
αλ ≡ελ. (2.23)
This law applies only to material that is in Local Thermodymamic Equi-librium (LTE), which means that it can be characterized by a single ther-modynamic temperature. This is a good assumption below about 100km in the Earth’s atmosphere. Above 100km, collisions between molecules are rare enough that different chemical species can have different thermody-namic temperatures. For most satellite meteorology applications, however, the Earth’s atmosphere can be considered to be in local thermodynamic equilibrium.
The atmosphere trasmittance depends on the absorption proprieties of its components at different wavelengths. Figure 2.3 shows the atmosphere trasmittance function depending on wavelengths. Where the trasmittance is close to 1, the atmosphere can be considered as a blackbody and these
spectrum regions are called windows bands. H2O, CO2 and O2 are the main
gases that absorb radiation at VIS-NIR wavelengths. The spectrum bands of some satellite sensor are also shown in fig. 2.3. Most of these bands are placed in window regions but some other are also placed in absorption regions in order to sound the gas responsible of the absorption.
Figure 2.3: Atmosphere trasmittance at different wavelength form VIS to NIR. Colors bars represent the spectrum bands covered by different satellite sensors.
Brightness Temperature
One interesting parameter directly derived fromBλ is thebrightness
tem-perature (T), that is the temperature that corresponds to a particular Planck function value Bλ. This is determined by inverting the Planck function,
T = C2 λ ln( C1 λ5B λ + 1) = C2 ν ln(C1ν3 Bν + 1) (2.24)
As we have seen from Plancks Law, as temperature increases the radiance also increases; the percentage increase varies as a function of wavelength and temperature. The percentage change in radiance to a corresponding percentage change in temperature, called temperature sensitivity, α, of a given spectral band is defined as
dB/B =αdT /T (2.25)
For infrared wavelengths, we find that α ≈ C2ν/T = C2/λT. Thus the shorter wavelengths have a greater temperature sensitivity than the smaller longer wavelengths.
Consider two infrared windows 11 and 4 µm, for example; at 300 K, the temperature sensitivity for 11µm(longwave window) is 4.3 and for 4µm
(shortwave window) it is 12. The temperature sensitivity indicates the power to which the Planck radiance depends on temperature, since B proportional to Tα satisfies the equation. Thus the radiance in the shortwave window is
varying roughly as temperature to the twelfth power and in the longwave window roughly as temperature to the fourth power (Menzel, 2006). Fig-ure 2.4 demonstrates the temperatFig-ure dependence of the Planck Function B(,T) for infrared spectral bands between 4 and 15 microns for earth scene temperatures.
2.3
The Radiative Transfer Equation (RTE)
Radiative transfer serves as a mechanism for exchanging energy between the atmosphere and the underlying surface and between different layers of the atmosphere.
When dealing with radiation travelling in cloud and atmosphere, we need to consider these “objects” in terms of size, composition and their distribu-tion along the path.
Figure 2.4: Temperature dependence of the Planck function B(λ,T) for earth scene by Menzel, 2006.
Consider a specific intensity or spectral radiance Iλ(~s, Ω) incident uponˆ
a cylindrical elementary volume with cross section dA and length ds (see figure 2.5). Let this volume contain n0 dA ds particles having the same size and composition,n0 being the number of particles per unit volume. We want
to find out the specific intensity of radiation coming out of the same volume in the same direction, that is Iλ(~s+ ˆΩds, Ω) for monochromatic radiationˆ
propagating along a line of sight distance ˆΩ.
Each particle has a scattering cross section σλ,sca and an absorbing cross
section σλ,abs for a total extinction cross section σλ,ext = σλ,sca+σλ,abs; this
means that each particle absorbs the power σλ,absI and scatters the power
σλ,scaI. Therefore the decrease of the specific intensity dIλ(~s, Ω) for theˆ
Figure 2.5: Radiative energy transfer for specific intensity Iλ(~s, Ω) across anˆ
infinitesimal cylinder containing particles
dIλ(~s, Ω)ˆ extinction =−ds n0(σλ,sca+σλ,abs)Iλ(~s, Ω) =ˆ −ds n0 σλ,extIλ(~s, Ω)ˆ
(2.26) Therefore, the intensity is increased by the emission of particles and can be written as:
dIλ(~s, Ω)ˆ emission =ds n0 (σλ,abs)Bλ(T) (2.27)
where Bλ(T) is the Planck function that depends upon the temperature
T.
Also the specific intensity increases because a portion of the specific inten-sityIλ(~s,Ωˆ′) incident on the volume from other directions ˆΩ′ is scattered into
the direction ˆΩ, and is added to the intensity Iλ(~s, Ω). Since the scatteredˆ
intensity comes from all directions ˆΩ′, the specific intensity contribution in the direction ˆΩ from the n0ds particles in the volume is: