Online Detection of False Data Injection Attacks to Synchrophasor
Measurements: A Data-Driven Approach
Meng Wu Texas A&M University
Le Xie
Texas A&M University [email protected]
Abstract
This paper presents an online data-driven algorithm to detect false data injection attacks towards synchronphasor measurements. The proposed algorithm applies density-based local outlier factor (LOF) analysis to detect the anomalies among the data, which can be described as spatio-temporal outliers among all the synchrophasor measurements from the grid. By leveraging the spatio-temporal correlations among multiple time instants of synchrophasor measurements, this approach could detect false data injection attacks which are otherwise not detectable using measurements obtained from single snapshot. This algorithm requires no prior knowledge on system parameters or topology. The computational speed shows satisfactory potential for online monitoring applications. Case studies on both synthetic and real-world synchrophasor data verify the effectiveness of the proposed algorithm.
1. Introduction
The electric power system is evolving towards tighter coupling between the information and physical systems [1]-[4]. As a prime example of sensor and communication deployment, synchrophasors provide high-resolution measurements with GPS-synchronized time stamps, which could benefit system monitoring, control, and protection. However, the communication and sensory system for synchrophasors also gives rise to threats of cyber attacks, which is of increasing concern for the grid operators [5]-[10].
As a first step towards preventing the synchrophasor system from possible cyber attacks, several algorithms for better monitoring have been introduced. References [11]-[12] propose methodologies to identify and protect key measurements in a power grid, in order to prevent the
system from “unobservable false data injection attacks”, which are created by manipulating multiple measurements simultaneously while keeping all the measurement residuals within normal range. These detection methods use measurements obtained from a single time instant and deal with false data injection attacks for supervisory control and data acquisition (SCADA) systems. References [13]-[14] study false data injection attacks using synchrophasor measurements obtained from multiple time instants, and perform detections according to the spatio-temporal correlations among these measurements. However, expensive computations such as nonlinear optimizations are involved in [13], which may limit the real-time applicability of the algorithm. Prior knowledge on system parameters and topology is required in [14], which may introduce detection errors if inaccurate system information is presented.
In this paper, a purely data-driven approach is proposed for online detection of false data injection attacks for synchrophsor measurements. An online attack detection framework is proposed to detect false synchrophasor data that is temporarily injected into a limited number of synchrophasors in certain power system. The proposed approach leverages the spatio-temporal correlations among multi-time-instant synchrophasor measurements, and detects local outliers using a density-based data-mining technique. This approach is shown to be capable of detecting false data injection attacks in synchrophasor systems under both normal and eventful operating conditions, without introducing false alarms when system physical disturbances are presented. It requires no prior knowledge of system parameters or topology, and has fast computational speed suitable for online applications.
The rest of the paper is organized as follows. Section II provides problem formulation for the false-data-injection-attack detection of synchrophasor Proceedings of the 50th Hawaii International Conference on System Sciences | 2017
measurements; Section III proposes the online false-data-injection-attack detection approach for synchrophasor systems; Section IV verifies the proposed approach through case studies; Section V presents concluding remarks to this paper.
2. Problem Formulation
In this section, the detection of false data injection attacks for synchrophasor measurements is formulated as detection of spatio-temporal outliers among time series measured by synchrophasors installed at various locations in the same power network.
2.1. False Data Injection Attacks
Let m n matrix M denote a set of synchrophasor measurements collected from
n
synchrophasor channels of the same type (i.e. all of them are voltage/current/power channels), within m time instants. This measurement matrix can be decomposed into the following two matrices:M L D (1) where L denotes the matrix whose columns represent true synchrophasor measurements without false data injections attacks, and D denotes the matrix of false data injections created by attackers. Each nonzero entry Dij represents an injected data point to the jth synchrophasor channel at time instant
i.
Definition 1: Let mi, li, and di denote the ith
row of matrices M, L, and D, respectively. di
represents the vector of coordinated false data injections at time instant i, and mi represents the vector of attacked synchrophasor measurements at time instant i. The coordinated attack di is defined to be successful (undetectable) if the following conditions are satisfied:
( ) T i i i m h x r (2) ( )i f r (3) where xi denotes the system state variables estimated by certain state estimation algorithm at time instant i; h( ) denotes the nonlinear relationship between system states and measurements (i.e., the power flow equations); ri denotes the
measurement residuals at time instant i; f( )
denotes the bad data detection criterion based on measurement residuals; denotes the threshold for bad data detection. The detection criterion shown in (3) is determined by the bad data detection mechanism used in certain state estimation program. Specifically, the 2-test and largest normalized residual test can be applied on ri to build (3) and identify bad data.
In the above definition, the detection mechanism takes advantages of the following information: 1) system measurements obtained from single time instant; 2) power flow relationship among system measurements. Therefore, a coordinated attack di
can go undetectable if power flow relationship h( ) is satisfied without gross error, for the given measurement set mTi at single time instant i. In the following section, a different detection mechanism is proposed to deal with false data injection attacks. The proposed mechanism leverages the following information to detect false data injection attack: 1) system synchrophasor measurements obtained from multiple time instants; 2) spatio-temporal correlations among system synchrophasor measurements. By utilizing the above different set of information, the proposed approach is able to detect false data injection attacks which are undetectable when traditional detection mechanism is applied.
2.2.
Features
of
Synchrophasor
Measurements
with/without
False
Data
Injection Attacks
In order to analyze measurements obtained at multiple time instants, row vectors mi, li, and di are inserted back into matrices M, L, and D, respectively. Each column of M represents a measurement curve obtained at a synchrophasor channel, whose ith entry could be attacked. In this paper, we focus on the false data injection attacks that could temporarily affect a limited number of synchrophasors. This indicates the attack matrix D
is a sparse matrix with only a few nonzero entries. It has been demonstrated in [13]-[16] that under both normal and eventful operating conditions, matrix L has the property of low rank, indicating strong linear correlations among attack-free synchrophasor measurements. However, matrix M
is shown to have a higher rank compared to L, due to the nonzero entries of matrix D. Since rank of a
matrix represents the number of linearly independent columns/rows in the matrix, it can be concluded that the number of linearly independent synchrophasor measurements is increased due to the presence of false data injection attacks. This indicates synchrophasor curves under attacks tend to have weaker (linear) correlations among each other, compared with synchrophasor curves without attacks.
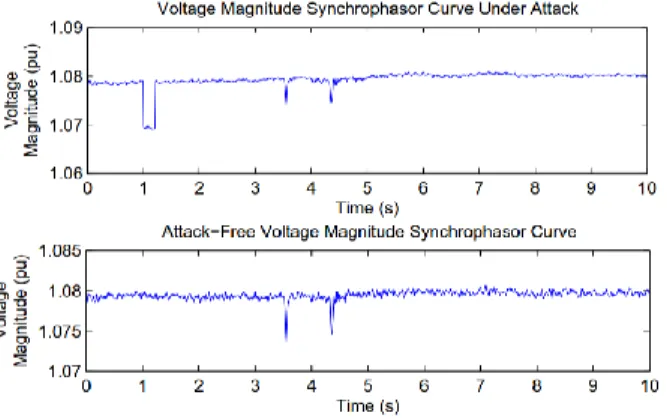
Figure 1. Comparison between synchrophasor with and without false data injection attack.
In order to further explain the above property, Figure 1 shows voltage magnitude curves obtained at two synchrophasors within the same local area. The system is under eventful condition from 3s to 5s. The upper curve contains a false data injection attack at around 1s, while the lower curve is free of false data injection attack. It can be observed that: 1) the upper curve tends to have outlier behavior (weak temporal correlation) when false data injection attack is presented (around 1s) and when system event is presented (from 3s to 5s); 2) during the attack-free time period (from 2s to 10s), the two curves obtained at different physical locations tend to have similar behavior (strong spatial correlation), no matter when the system is under normal or eventful operating condition; 3) when the system is under attack (around 1s), the upper curve tends to have outlier behavior (weak spatial correlation) compared with the lower curve. The above phenomena is caused by the low-rank property of the attack-free measurement matrix
L and the sparse property of the attack matrix D. Since components in the same power grid are strongly coupled with each other through transmission network, the system dynamic measurements obtained by different synchrophasors within a local area tend to be strongly correlated with similar behavior, under both normal and eventful operating conditions. However, when a limited number of synchrophasors are temporarily attacked
by the attackers, only the attacked synchrophasors in the system would encounter a temporary change in their measurements, while measurements obtained by the other synchrophasors would reflect normal system dynamics. Unlike system events which could affect most of the synchrophaor measurements within a local area, these false data injection attacks affect only a small fraction of all the synchrophasor measurements. Therefore, synchrophasor measurements under this type of attack would have outlier behavior compared with their spatial neighborhoods which are free of attack.
The above features of synchrophasors with/without false data injection attacks can be summarized as follows:
Feature 1: Under normal operating conditions, synchrophasor measurements without false data injection attacks obtained from nearby physical locations exhibit strong spatial and temporal correlations with each other.
Feature 2: Under eventful operating conditions, synchrophasor measurements without false data injection attacks obtained from nearby physical locations exhibit strong spatial correlations but weak temporal correlations with each other.
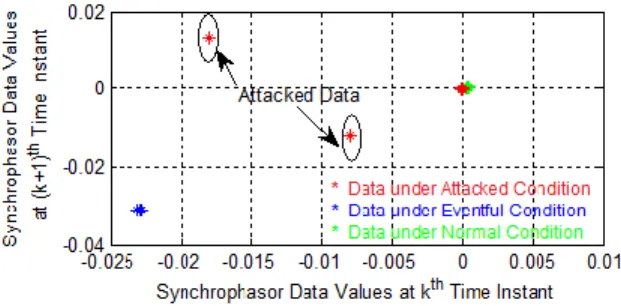
Feature 3: Under both normal and eventful operating conditions, synchrophasor measurements with false data injection attacks exhibit weak spatial and temporal correlations with synchrophasor measurements without false data injection attacks. The above three features are further demonstrated through the simple example shown in Figure 2. Three 2×8 measurement matrices M(1), M(2), and M(3) are sampled from the same set of synchrophasor channels at three different time periods. Each matrix contains 8 synchrophasor curves within 2 consecutive time instants. M(1) contains 6 attack-free synchrophasor curves and 2 attacked synchrophasor curves obtained under normal operating condition. M(2) and M(3) contain 8 attack-free synchrophasor curves obtained under eventful and normal operating conditions, respectively. The Euclidean distance is used to quantify the strength of the spatio-temporal correlations among these curves. Each synchrophasor curve in the three matrices is projected to the 2D Euclidean space shown in Figure 2. The x and y coordinates of each point are the data values at the
first and second time instant of the corresponding synchrophasor curve, respectively.
Figure 2. 2D points representing synchrophasor curves under normal/eventful/attacked conditions. The following observations can be drawn from Figure 2: (1) the cluster of eventful synchrophasor data (eventful cluster) lies far from the clusters of attack-free synchrophasor data under normal operating condition (normal cluster), indicating weak temporal correlation between the two clusters; (2) all the points within the eventful cluster lie close to each other, indicating strong spatial correlation among points within the eventful cluster; (3) the two points representing attacked synchrophasor curves lie far from the normal cluster, as well as the majority of points in the other 6 points representing the 6 attack-free synchrophasor curves in M(1), indicating weak spatial and temporal similarities with those neighboring points. Therefore, synchrophasor measurements under false data injection attacks show the feature of weak spatio-temporal correlations with their neighboring measurements.
2.3. Detection of Spatio-temporal Outliers due
to False Data Injection Attacks
The above features of synchrophasor measurements with/without false data injection attacks indicate that under both normal and eventful operating conditions, synchrophasor measurements with false data injection attacks can be considered as spatio-temporal outliers among all the synchrophasor measurements of the same type. These outliers can be detected using density-based outlier detection methods, if the strength of spatio-temporal correlations among synchrophasor measurements can be measured properly by certain definition of “distance”.
For a measurement matrix M obtained within a certain period of time, general steps to formulate the
false-data-injection-attack detection problem are presented as follows:
Step 1: Define a proper distance function to quantify the similarity between ithand jthcolumn of M.
Step 2: Map each column of M to the subspace S where the distance function is defined. Each column of M can be represented as a point in the corresponding subspace S.
Step 3: Examine the outlier behavior of the points in the subspace S, according to the distance function defined in Step 1. Points lying far from the majority are classified as data with false data injection attacks. In the above formulation, a data segment that can be identified as “spatio-temporal” outlier among its neiboring data segments has the the following characteristics: it shows certain outlying behavior (quantified by the definition of “distance”) along both row direction and column direction of the measurement matrix M.
3. Online Detection of False Data
Injection Attacks
In this section, a local outlier factor (LOF) based approach is proposed for online detection of false data injection attacks towards synchrophasor measurements. In [17], we present a similar LOF-based approach for data quality improvement of synchrophasor systems. In this paper, we focus on the false data injection attack detection problem for synchrophasor measurements, and propose a more robust definition of “distance”, which is tailored for detecting false data injection attacks caused by false data injections in synchrophasor systems. The proposed LOF-based false-data-injection-attack detection algorithm is described as follows.
3.1.
Definition
of
“Distance” between
Synchrophasor Measurements
In order to measure the strength of spatio-temporal correlations among synchrophasor measurements, the following definition of “distance” is proposed.
Definition 2: Let M k( ) denote the measurement matrix obtained at the kth time interval. Let M ki( )
and Mj( )k denote the
th
measurement matrix M k( ), that is, M ki( ) and ( )
j
M k are synchrophasor measurements obtained from the ith and jth synchrophasor channels at the same time interval. The distance d i j( , ) between
( )
i
M k and Mj( )k is defined as follows:
( , ) iNorm Normj d i j (4) 1 1 1 1 ( ) ( ) ( ( )) ( ( )) Norm i i t k t k i C i C i t t k t M t M t
(5) 1 ( ( ) ) ( ( )) 0 ( ( ) ) i C i i M t C M t M t C (6)where i( )t denotes the standard deviation of the
columns of M ti( ), C denotes the data set of all the
synchrophasor measurements identified to be clean (without false data injection attacks) by the proposed algorithm.
Intuitively, iNorm represents the standard deviation of measurements obtained from the ith
synchrophasor channel at current time interval k, normalized by the average of all the standard deviations of measurements obtained from the same channel at previous time intervals, when this channel is identified to be clean. This normalized standard deviation iNorm serves as an indicator of the strength of dynamic behavior of time series M ti( ). For clean
measurements without false data injection attacks, their normalized standard deviations tend to have similar values, indicating strong spatio-temporal correlations among them. However, the normalized standard deviations of attacked measurements tend to have significantly different values compared with those of clean measurements, due to their weak spatio-temporal correlations. Therefore, the distance
( , )
d i j can be defined as the absolute difference between iNorm and
Norm j
. Larger distance indicates weaker spatio-temporal correlations between M ki( )
and Mj( )k .
3.2. LOFs Computation
Based on the above definition of distance, LOFs for synchrophasor measurements can be calculated through the following procedure. Details of the LOF analysis can be found in reference [18].
3.2.1. Calculation of k-distance(p). Let the measurement matrix M be the matrix consisting of synchrophasor measurements, each row of M represents a time instant, and each column of M represents measurements obtained from a synchrophasor channel. Let p, q, o be some objects in M, each object represents a column in
M. Let k be a positive integer. Let qM\{ }p denotes { :q qM q, { }}p . The distance between p
and q, denoted by d p q( , ), is defined in the previous section.
For any positive integer k, the k-distance of object p, denoted by k-distance(p), is defined as the distance d p o( , ) between p and an object oM
such that:
a) for at least k objects oM\{ }p it holds that
( , ) ( , )
d p o d p o , and
b) for at most k1 objects oM\{ }p it holds that
( , ) ( , )
d p o d p o . where
The value of k-distance(p) provides a measure on the density around the objectp. Smaller k-distance(p) indicates higher density aroundp.
3.2.2. Identification of k-distance neighborhood of p. Given k-distance(p), the k-distance neighborhood of p contains every object whose distance from p is not greater than thek-distance, i.e.,
( )( ) { \{ }| ( , ) ( )} k distance p N p q M p d p q k distance p (7)
These objects q are called the k-nearest neighbors of p.
3.2.3. Calculation of reachability distance of object p with respect to object o. The reachability distance of object p with respect to object o is defined as:
( , ) { ( ), ( , )} k reach dist p o max k distance o d p o (8)
Intuitively, if object p is far away from object o, then the reachability distance between p and o is simply their actual distance. However, if they are
‘sufficiently’ close to each other, the actual distance is replaced by the k-distance of o. The reason is that in doing so, the statistical fluctuations of d p o( , ) for all the p's close to o can be significantly reduced. The strength of this smoothing effect can be controlled by the parameter k. The higher the value of k, the more similar the reachability distances for objects within the same neighborhood.
3.2.4. Calculation of local reachability density of p. The local reachability density of p is defined as:
1 ( ) ( ) ( , ) | ( ) | MinPts MinPts MinPts o N p MinPts lrd p reach dist p o N p
(9) where Nk( )p Nk distance p ( )( )p .Intuitively, the local reachability density of an object
p is the inverse of the average reachability distance based on the MinPts-nearest neighbors of p. It is essentially an estimation of the density at point p by analyzing the k-distance of the objects in Nk( )p .
The local reachability density of p is just the reciprocal of the average distance between p and the objects in its k-neighborhood.
3.2.4. Calculation of LOF of p. The local outlier factor of p is defined as:
( ) ( ) ( ) ( ) | ( ) | MinPts MinPts MinPts o N p MinPts MinPts lrd o lrd p LOF p N p
(10)The local outlier factor of object p captures the degree to which p is a local outlier. It is the average of the ratio of the local reachability density of p and those of p's MinPts-nearest neighbors. It is easy to see that the lower p's local reachability density is, and the higher the local reachability densities of p's MinPts-nearest neighbors are, the higher the LOF value of p is.
After obtaining LOFs for all the synchrophasor channels, each LOF is compared with a pre-defined threshold to detect false data injection attacks. The LOF threshold is a system-dependent value and can be determined through offline training, using
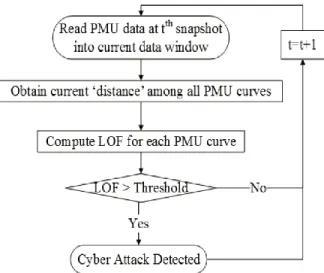
historical data obtained from the same system. Synchrophasor channels with LOFs exceeding the threshold can be detected as attacked channels. Figure 2 shows the implementation flowchart for the proposed LOF-based false-data-injection-attack detection approach.
Figure 3. Flowchart of the proposed false-data-injection-attack detection approach.
4. Case Studies
In this section, the proposed false-data-injection-attack detection approach is tested using both synthetic and practical synchrophasor data. In order to demonstrate the proposed approach can detect false data injection attack under eventful operating condition, without introducing false alarms by system physical events, a system event is presented in each of the test cases. In all the following test cases, a unique set of algorithm parameters are used: moving data window length = 20 data points; LOF threshold = 10; Number of neighboring data for LOF algorithm = 0.5 number of synchrophasor curves. The setting of the algorithm parameters can be optimized through offline training using historical synchrophasor measurements obtained in the same power grid. It is worth emphasizing that, the physical events chosen for the following case studies are fast transient events with similar temporal outlying behavior compared to the false data injection attacks. Both the events and the attacks show some sudden changes in the eventful/attacked synchrophasor curve. This similarity could potentially cause false alarms for false-data-attack detection algorithms. For slower events such as variation of loading conditions,
less false alarms would be introduced, since these slow events do not have very similar temporal outlying behavior compared to false data injection attacks.
4.1. Case Study with Synthetic Data
The synthetic synchrophasor measurements are generated using simulation results obtained from a standard IEEE-14 bus system in Matlab PSAT toolbox [19]. In order to verify the performance of the proposed algorithm under eventful operating condition, a three-phase line-to-ground fault is applied to the system. All the simulation results are sampled at the rate of 50Hz to build the synthetic synchrophasor data. The synthetic data set has 14 synchrophasor curves for voltage magnitudes, where synchrophasor channels No. 1, 3, and 9 contain constant false data injections (lasting from 6s to 6.4s) [13]-[14]. The length of each injected data segment is 0.4s. Figure 3 shows the data curves with false data injection attacks.
Figure 4. Synthetic synchrophasor measurements with false data injection attacks.
Figure 4 shows the LOF values of the synchrophasor measurements under physical event or false data injection attack. It can be seen that under physical events, LOFs of all the measurements lie far below the threshold value, while under false data injection attacks, LOFs of the attacked measurements (synchrophasor channel No. 1, 3, and 9) exceed the threshold value. This verifies the effectiveness of the proposed algorithm in accurately detecting false data injection attacks without creating false alarms due to physical system events.
Figure 5. LOF values of synthetic synchrophasor channels when system physical event (right) or false data injection attack (left) is presented.
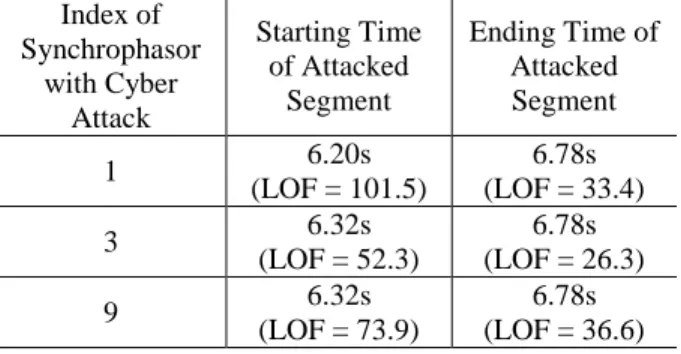
The detection results of false data injection attacks for synthetic synchrophasor data are shown in Table 1. It can be seen that all the attacked synchrophasor channels (No. 1, 3, and 9) are successfully detected, and no false alarms are created by system events. The time delay of the starting and ending time instants of the false data injection attacks is less than 0.38s. The time delay is mainly caused by the time window length determined in the algorithm. Larger time window may result in more time delay for the detection. The average computation time for the proposed algorithm over one time window is 0.0130s. The detection delay and computation time of the proposed approach are insignificant compared with the latency requirements for online quasi-steady-state applications, ranging from 1 seconds to 5 seconds [20]. The performance of the proposed approach is satisfactory for online applications. Table 1. Detection results for synthetic synchrophasor data with false data injection attack
Index of Synchrophasor with Cyber Attack Starting Time of Attacked Segment Ending Time of Attacked Segment 1 6.20s (LOF = 101.5) 6.78s (LOF = 33.4) 3 6.32s (LOF = 52.3) 6.78s (LOF = 26.3) 9 6.32s (LOF = 73.9) 6.78s (LOF = 36.6)
4.2. Case Study with Actual PMU Data
The proposed approach is also tested using real synchrophasor measurements obtained in a practical power grid during a line-tripping fault. The sampling rate of the synchrophasor data is 100Hz. Since we do not have access to some cyber compromised actual PMU data, in order to test the performance under
false data injection attacks, we added constant data injections to PMU No. 14, 18, 24, and 37 (lasting from 1.0s to 1.2s). The length of each injected data segment is 0.2s. Figure 5 shows the data curves with false data injection attacks.
Figure 6. Practical synchrophasor measurements with false data injection attacks.
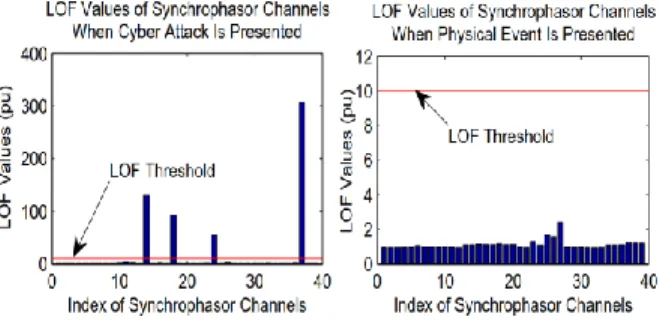
Figure 6 shows the LOF values of the synchrophasor measurements under physical event and false data injection attack. It can be seen that under physical events, LOFs of all the measurements lie far below the threshold value, while under false data injection attacks, LOFs of the attacked measurements (synchrophasor channel No. 14, 18, 24, and 37) exceed the threshold value. This verifies the effectiveness of the proposed algorithm in accurately detecting false data injection attacks without creating false alarms due to physical system events.
Figure 7. LOF values of practical synchrophasor channels when system physical event (right) or false data injection attack (left) is presented.
The detection results of false data injection attacks for practical synchrophasor data are shown in Table 2. It can be seen that all the attacked synchrophasor channels (No. 14, 18, 24, and 37) are successfully detected, and no false alarms are created by system events. The time delay of the starting and ending time instants of the false data injection attacks is less than
0.19s. The time delay is mainly caused by the time window length determined in the algorithm. Larger time window may result in more time delay for the detection. The average computation time for the proposed algorithm over one time window is 0.040s. The detection delay and computation time of the proposed approach are insignificant compared with the latency requirements for online quasi-steady-state applications, ranging from 1 seconds to 5 seconds [20]. The performance of the proposed approach is satisfactory for online applications. Although the computation time of the proposed algorithm would grow if more synchrophasor curves are available in the system, the growth in computation time would be limited since there is no complicated computation, such as nonlinear optimization or matrix inversion, involved in the proposed approach. Moreover, in order to detect false data injection attacks in large-scale power systems with a large number of synchrophasors, this approach can be easily applied in a decentralized way by performing false-data-injection-attack detection at each of the local phasor data concentrators (PDC), using synchrophasor data obtained at the corresponding local regions.
Table 2. Detection results for practical synchrophasor data with false data injection attack
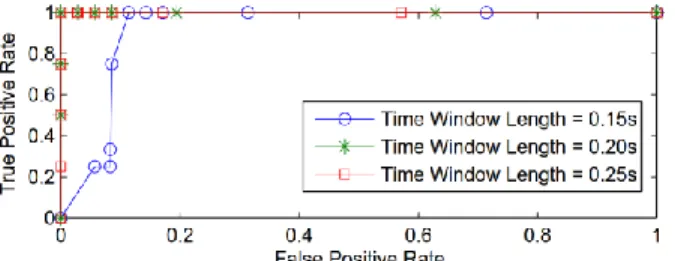
Index of Synchrophasor with Cyber Attack Starting Time of Attacked Segment Ending Time of Attacked Segment 14 1.16s (LOF = 141.9) 1.39s (LOF = 133.4) 18 1.16s (LOF = 99.5) 1.39s (LOF = 93.6) 24 1.16s (LOF = 60.4) 1.39s (LOF = 55.9) 37 1.16s (LOF = 332.2) 1.39s (LOF = 311.8) In order to study the impact of time delay on the performance of the proposed algorithm, Figure 7 shows the receiver operator characteristic (ROC) curves when different time window lengths are used. It can be seen from Figure 7 that: a) the proposed approach has higher detection accuracy when the time window length is set to be 0.2s or 0.25s; b) when the time window length is set at a lower value (0.15s), the detection accuracy tends to be lower and false alarms would happen; c) when the time window length is increased form 0.2s to 0.25s, the detection accuracy of the proposed algorithm is not improved
significantly. Since time window length is also closely related to the detection delay of the algorithm, it is desirable to consider both detection accuracy and detection delay when determining the time window length for the algorithm.
Figure 8. ROC curves for test case with practical synchrophasor measurements when different time window lengths are used.
5. Conclusions
This paper proposes an online data-driven algorithm to detect false data injection attacks against synchronphasor measurements. This approach leverages the unique spatio-temporal correlation signatures among synchrophasor measurements over a moving window of time. The change of the signature indicates the presence of possible false data injection attacks. The detection is shown to be effective under both normal and fault-on conditions. It is purely data-driven algorithm without involving prior knowledge on parameters or topology of the power grid, which avoids the impact of inaccurate system information on the detection results. The effectiveness of the proposed approach is verified through case studies using both synthetic and practical data sets.
The proposed LOF-based framework can also be applied to detecting various low-quality synchrophasor measurements. Through proposing different ‘distance functions’ for different types of data quality problems, and introducing multiple ‘distance functions’ into the algorithm, the spatio-temporal features of each type of data quality problem can be quantified differently. This could improve the detection sensitivity for different types of problems.
While in this work we focus on attacks that only affect a limited number of synchrophasors in a temporary way, our future work will investigate the possibility of a more coordinated attack. The cross-domain correlation among different sets of data (e.g.,
SCADA and synchrophasors) would offer new possibilities to detect such coordinated attacks. We would also investigate more robust definitions of distances for various types of data attacks. Last but not least, we would also investigate different categories of cyber attacks such as spoofing of GPS clocks.
6. References
[1] Y. Yan, Y. Qian, H. Sharif, and D. Tipper, “A survey on cyber security for smart grid communications,”
Communications Surveys Tutorials, IEEE, vol. 14, no. 4, pp. 998–1010, Fourth 2012.
[2] G. Ericsson, “Cyber security and power system communication - essential parts of a smart grid infrastructure,” Power Delivery, IEEE Transactions on, vol. 25, no. 3, pp. 1501–1507, July 2010.
[3] A. Teixeira, S. Amin, H. Sandberg, K. Johansson, and S. Sastry, “Cyber security analysis of state estimators in electric power systems,” in Decision and Control (CDC), 2010 49th IEEE Conference on, Dec 2010, pp. 5991–5998.
[4] A. Creery and E. Byres, “Industrial cybersecurity for power system and SCADA networks,” in Petroleum and Chemical Industry Conference, 2005. Industry Applications Society 52nd Annual, Sept 2005, pp. 303–309.
[5] O. Kosut, L. Jia, R. Thomas, and L. Tong, “Malicious data attacks on smart grid state estimation: Attack strategies and countermeasures,” in Smart Grid Communications (SmartGridComm), 2010 First IEEE International Conference on, Oct 2010, pp. 220–225.
[6] L. Xie, Y. Mo, and B. Sinopoli, “False data injection attacks in electricity markets,” in Smart Grid Communications (SmartGridComm), 2010 First IEEE International Conference on, Oct 2010, pp. 226–231.
[7] B. Sikdar and J. Chow, “Defending synchrophasor data networks against traffic analysis attacks,” Smart Grid, IEEE Transactions on, vol. 2, no. 4, pp. 819–826, Dec 2011.
[8] T. Morris, S. Pan, and U. Adhikari, “Cyber security recommendations for wide area monitoring, protection, and control systems,” in Power and Energy Society General Meeting, 2012 IEEE, July 2012, pp. 1–6.
[9] Y. Yang, K. McLaughlin, S. Sezer, T. Littler, B. Pranggono, P. Brogan, and H. Wang, “Intrusion detection system for network security in synchrophasor systems,” in
Information and Communications Technologies (IETICT 2013), IET International Conference on, April 2013, pp. 246–252.
[10] X. Jiang, J. Zhang, B. Harding, J. Makela, and A. Dominguez-Garcia, “Spoofing GPS receiver clock offset of phasor measurement units,” Power Systems, IEEE Transactions on, vol. 28, no. 3, pp. 3253–3262, Aug 2013.
[11] G. Dan and H. Sandberg, “Stealth attacks and protection schemes for state estimators in power systems,” in Smart Grid Communications (SmartGridComm), 2010 First IEEE International Conference on, Oct 2010, pp. 214–219.
[12] T. Kim and H. Poor, “Strategic protection against data injection attacks on power grids,” Smart Grid, IEEE Transactions on, vol. 2, no. 2, pp. 326–333, June 2011.
[13] L. Liu, M. Esmalifalak, Q. Ding, V. Emesih, and Z. Han, “Detecting false data injection attacks on power grid by sparse optimization,” Smart Grid, IEEE Transactions on, vol. 5, no. 2, pp. 612–621, March 2014.
[14] M. Wang, P. Gao, S. Ghiocel, J. Chow, B. Fardanesh, G. Stefopoulos, and M. Razanousky, “Identification of unobservable cyber data attacks on power grids,” in Smart Grid Communications (SmartGridComm), 2014 IEEE International Conference on, Nov 2014, pp. 830–835.
[15] L. Xie, Y. Chen, and P. Kumar, “Dimensionality reduction of synchrophasor data for early event detection: Linearized analysis,” Power Systems, IEEE Transactions on, vol. 29, no. 6, pp. 2784–2794, Nov 2014.
[16] M. Wang, J. Chow, P. Gao, X. Jiang, Y. Xia, S. Ghiocel, B. Fardanesh, G. Stefopolous, Y. Kokai, N. Saito, and M. Razanousky, “A low-rank matrix approach for the analysis of large amounts of power system synchrophasor data,” in System Sciences (HICSS), 2015 48th Hawaii International Conference on, Jan 2015, pp. 2637–2644.
[17] M. Wu and L. Xie, “Online identification of bad synchrophasor measurements via spatio-temporal correlations,” accepted to 19th Power Systems Computation Conference, Genoa, Italy, 2016.
[18] M. M. Breunig, H.-P. Kriegel, R. T. Ng, and J. Sander, “LOF: Identifying density-based local outliers,” in Proceedings of the 2000 ACM SIGMOD International Conference on Management of Data, ser. SIGMOD ’00. New York, NY, USA: ACM, 2000, pp. 93–104. [Online]. Available: http://doi.acm.org/10.1145/342009.335388
[19] F. Milano, “An open source power system analysis toolbox,” Power Systems, IEEE Transactions on, vol. 20, no. 3, pp. 1199–1206, Aug 2005.
[20] P. Kansal and A. Bose, "Bandwidth and Latency Requirements for Smart Transmission Grid Applications,"
Smart Grid, IEEE Transactions on, vol. 3, no. 3, pp. 1344-1352, Sep. 2012.