Access to Electronic Thesis
Author: Qian Zhang
Thesis title: Nature-Inspired Multi-Objective Optimisation and Transparent Knowledge Discovery via Hierarchical Fuzzy Modelling
Qualification: PhD
Date awarded: 19 January 2009
This electronic thesis is protected by the Copyright, Designs and Patents Act 1988. No reproduction is permitted without consent of the author. It is also protected by the Creative Commons Licence allowing Attributions-Non-commercial-No
Nature-Inspired Multi-Objective Optimisation and
Transparent Knowledge Discovery via Hierarchical Fuzzy
Modelling
Qian Zhang
Department of Automatic Control and Systems Engineering The University of Sheffield
A thesis submitted in partial fulfilment of the requirements for the degree of Doctor of Philosophy
Knowledge discovery is one of the most important human activities, which helps people recognise and understand some of the intricacies associated with the ancient and modern worlds. With the rapid development in the human capabilities to both generate and collect data, the discovery of knowledge from data has become a practical and popular research topic. In this thesis, knowledge discovery from data is conducted from the following two overarching viewpoints: first, developing prediction models using the data that represent input-output relationships; second, based on these developed prediction models, finding the optimal designs (solutions) from a set of predefined objectives. The theoretical aspects behind the previous two research facets are described and the associated experimental studies are carried out.
A particular focus of this thesis is on a cooperative fuzzy modelling framework, which integrates transparent (interpretable) fuzzy systems with robust evolutionary computing based algorithms involving several techniques, such as data clustering, data mining, and multi-objective optimisation. Evolutionary optimisation algorithms are also developed on the basis of nature and social inspired ideas. Optimisation forms an essential part of the modelling framework and is employed in the direct optimal design problems as well. The proposed cooperative fuzzy modelling methodology and the devised evolutionary optimisation algorithms are then applied to knowledge discovery in terms of systems modelling and control (static optimisation via reverse-engineering), using simulation platforms as well as real industrial data.
The experimental results show that the proposed modelling framework and optimisation algorithms outperform some of the other salient techniques; the proposed approaches can successfully work within the context of the high-dimensional industrial applications, including modelling and optimal design problems.
Acknowledgements
I would like to thank everyone who has helped me over the last few years. Without their support, I would certainly not have completed this thesis.
First of all, I would like to express my sincere and great thanks to my excellent supervisor, Professor Mahdi Mahfouf, for his expert guidance, continuous support and constructive advice throughout the whole period of this PhD project.
I would also like to thank all my friends and colleagues in the Intelligent Systems Laboratory for their kind help and friendship.
Last but not least, I wish to thank my family, especially my parents, my sister and my grandparents for their support, encouragement and love throughout my PhD study. My family has always taken care of me and I love them all very much.
Zhang, Q., Mahfouf, M. (2008) Mamdani-Type Fuzzy Modelling via Hierarchical Clustering and Multi-Objective Particle Swarm Optimisation (FM-HCPSO) International Journal of Computational Intelligence Research (IJCIR), Accepted
Zhang, Q., Mahfouf, M. (2007) Fuzzy predictive modelling using hierarchical clustering and multi-objective optimisation for mechanical properties of alloy steels Proceedings of the 12th IFAC Symposium on Automation in Mining, Mineral and Metal Processing, IFAC MMM07, pp. 427-432, 21-23 August 2007, Quebec City, Canada
Zhang, Q., Mahfouf, M. (2007) A new Reduced Space Searching Algorithm (RSSA) and its application in optimal design of alloy steels Proceedings of the 2007 IEEE Congress on Evolutionary Computation, CEC 2007, pp. 1815-1822, 25-28 September 2007, Singapore
Zhang, Q., Mahfouf, M. (2006) A New Structure for Particle Swarm Optimization (nPSO) Applicable to Single Objective and Multiobjective Problems Proceedings of the 3rd International IEEE Conference on Intelligent Systems, IEEE IS´06, pp. 176-181, 4-6 September 2006, London, UK
Mahfouf, M., Chen, M.-Y., Zhang, Q., Linkens, D. A. (2006) Adaptive Weighted Particle Swarm Multiobjective Optimisation and Societal Reasoning for the Design of Alloy Proceedings of the 1st IFAC Workshop on Applications of Large Scale Industrial Systems, IFAC ALSIS06, 30-31 August 2006, Helsinki, Finland
Zhang, Q., Mahfouf, M. (2005) Reduced Space Searching (RSS) Algorithm: A New Optimization Algorithm for Single-Objective and Multi-Objective Problems Proceedings of the 1st European Symposium on Nature-inspired Smart Information Systems, NiSIS05, 3-5 October 2005, Albufeira, Portugal
Contents
Chapter 1: Introduction
1.1 Background and Research Aims...1
1.2 Structure of the Thesis...7
Chapter 2: Evolutionary Based Optimisation and Fuzzy Theories - A Background 2.1 Optimisation...11
2.1.1 Single Objective Optimisation...11
2.1.2 Multi-Objective Optimisation...12 2.2 Evolutionary Computation...14 2.2.1 Evolutionary Algorithms...15 2.2.1.1 Genetic Algorithms...16 2.2.1.2 Evolution Strategies...17 2.2.2 Swarm Intelligence...17
2.2.2.1 Particle Swarm Optimisation (PSO)...18
2.2.3 Multi-Objective Optimisation Algorithms within Evolutionary Computation...19
2.2.3.1 Strength Pareto Evolutionary Algorithm...20
2.2.3.2 Pareto Archived Evolution Strategy...21
2.2.3.3 Nondominated Sorting Genetic Algorithm II...21
2.3 Fuzzy Sets and Fuzzy Systems...22
2.3.2 Fuzzy Systems...24
2.4 Summary...26
Chapter 3: A New Reduced Space Searching Algorithm with Applications to Single Objective and Multi-Objective Problems 3.1 Introduction to the Reduced Space Searching (RSS) Strategy...27
3.2 The Reduced Space Searching Algorithm (RSSA) ...30
3.2.1 The Basic Idea...30
3.2.2 Improvement of the Basic Idea...30
3.2.3 An Example of the Search Space Decreasing or Increasing...31
3.2.4 The Variation Operators...34
3.2.5 The RSSA Algorithm...34
3.3 Experimental Studies using RSSA...36
3.3.1 Benchmark Test Functions...36
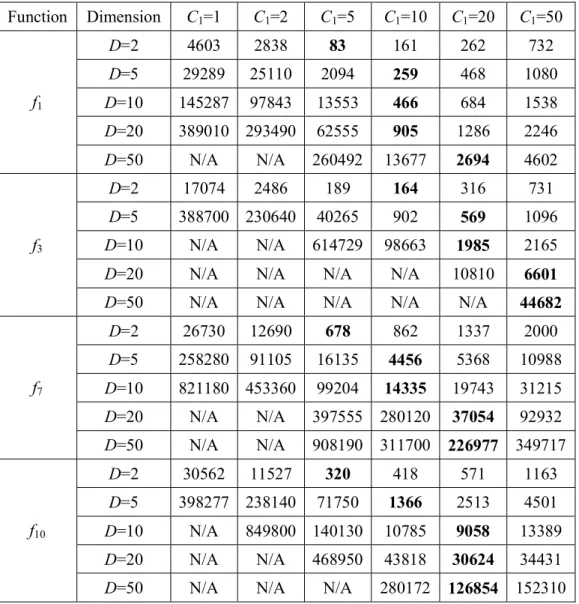
3.3.2 Effect of the Decreasing Parameter C1 ...42
3.3.3 Effects of the Variation Strategies ...44
3.3.4 A Comparison between RSSA and Other Evolutionary Algorithms.44 3.4 Extension of RSSA to Multi-Objective Optimisation Problems...49
3.4.1 The Random Weighted Aggregation Approach...49
3.4.2 Archive Design...50
3.4.3 The Multi-Objective Reduced Space Searching Algorithm (MO-RSSA)...52
3.5 Experimental Studies using MO-RSSA...53
3.5.1 Comparison between MO-RSSA and Other Multi-Objective EAs....53
3.5.1.1 Problems Description...54
3.5.1.2 Performance Metrics...55
3.5.1.3 Experimental Setup...56
3.5.1.4 Experimental Results...57
3.5.2 Experiments Based on the DTLZ Series Problems...59
Contents Chapter 4: A New Structure for Particle Swarm Optimisation with
Applications to Single Objective and Multi-Objective Problems
4.1 Introduction to Particle Swarm Optimisation (PSO)...65
4.1.1 Basic Concepts of PSO...66
4.1.2 New Developments in PSO...72
4.1.3 Features of PSO...76
4.2 A New Structure for Particle Swarm Optimisation (nPSO)...76
4.2.1 Algorithm Formulation...77
4.2.2 Advantages of nPSO...80
4.3 Experimental Studies using nPSO...81
4.3.1 Effect of the Population Size...81
4.3.2 Effects of the Acceleration Coefficients...86
4.3.3 Effects of Different Mechanisms for Position Parameters Refreshing ...88
4.3.4 Comparison between nPSO and Other Evolutionary Algorithms...89
4.4 Extension of nPSO to Multi-objective Optimisation Problems...94
4.4.1 Experiments Based on the ZDT Series Problems...94
4.4.2 Experiments Based on the DTLZ Series Problems...98
4.5 Summary...102
Chapter 5: A Fuzzy Modelling Approach with a Hierarchical Clustering Algorithm and a Multi-Objective Optimisation Mechanism (FM-HCMO) 5.1 Introduction...104
5.1.1 Fuzzy Systems...106
5.1.2 Fuzzy Modelling...107
5.1.3 Data-Driven Fuzzy Modelling...108
5.1.4 Accuracy and Interpretability...110
5.1.5 Optimisation of Fuzzy Modelling...111
5.1.6 Features of the Proposed Modelling Methodology...116
5.2 The Framework of the Proposed Modelling Methodology...118
5.3.1 Data Clustering...120
5.3.1.1 Basic Concepts...120
5.3.1.2 Types of Data Clustering Algorithms...122
5.3.1.3 Hierarchical Clustering Algorithms...123
5.3.1.4 The Proposed New Agglomerative Complete-Link Clustering Algorithm...127
5.3.2 Initial Fuzzy Model Construction...129
5.3.2.1 An Example of Constructing the Initial Fuzzy Model...129
5.3.2.2 Fuzzy System Definition and Notation...131
5.3.2.3 The Fuzzy Model Extraction Approach...131
5.3.3 Experimental Studies...133
5.3.3.1 Comparison of Clustering Algorithms for Fuzzy Modelling Problems...133
5.3.3.2 Effects of Various Weights of Distance Measure...138
5.4 Accuracy Optimisation and Data Selection...141
5.4.1 Accuracy Optimisation...141
5.4.1.1 The Validation Mechanism...142
5.4.2 Data Selection...144
5.4.2.1 Rough Data Selection...145
5.4.2.2 Missing Representative Data Selection...148
5.4.3 The Joint Mechanism of Accuracy Optimisation and Data Selection ...151
5.5 Simultaneous Multi-Objective Optimisation of Accuracy and Interpretability...154
5.5.1 Interpretability Improvement...154
5.5.1.1 Removing Redundant Fuzzy Rules...154
5.5.1.2 Merging Similar Fuzzy Rules...157
5.5.1.3 Removing Redundant Fuzzy Sets...158
5.5.1.4 Merging Similar Fuzzy Sets...160
5.5.2 Experimental Studies...161
5.5.2.1 An Example of Using the Interpretability Improvement Approach...161
Contents 5.5.2.2 Effects of the Thresholds of the Interpretability Improvement
Approach...164
5.5.3 The Multi-Objective Optimisation Mechanism...169
5.5.4 The Designed Objective Functions for Fuzzy Modelling...172
5.6 Confidence Band Analysis...172
5.7 Summary...175
Chapter 6: Application of FM-HCMO to Fuzzy Modelling Problems 6.1 Introduction...177
6.2 The Nonlinear Function Approximation...177
6.3 The Identification of a Dynamic System...186
6.4 Mechanical Property Prediction of Alloy Steels...196
6.4.1 Ultimate Tensile Strength (UTS)...197
6.4.2 Reduction of Area (ROA)...206
6.4.3 Elongation...212
6.4.4 Impact Energy...218
6.5 Summary...224
Chapter 7: Application of RSSA and MO-RSSA for Alloy Steel Design Problems 7.1 Introduction...226
7.2 The Optimal Design of UTS for Alloy Steels...228
7.3 The Optimal Design of ROA...232
7.4 The Optimal Design of both UTS and ROA...236
7.4.1 Boundaries for the UTS and ROA Design...236
7.4.2 The Single Objective Optimisation...238
7.4.3 The Multi-objective Optimisation...239
7.5 The Optimal Alloy Design Considering both the Mechanical Properties and the Economical Factors...241
7.5.1 The Optimal Design Considering both UTS and the Cost...242
7.5.2 The Optimal Design Considering both ROA and the Cost...244
7.6 Summary...248
Chapter 8: Conclusion and Future work 8.1 Summary of Main Results...249
8.2 Future work...252
8.3 Conclusion...256
List of Figures
Figure Page
2-1 An example of membership functions... 23
2-2 The basic configuration of fuzzy systems... 24
3-1 The RSS strategy for dealing with optimisation problems... 29
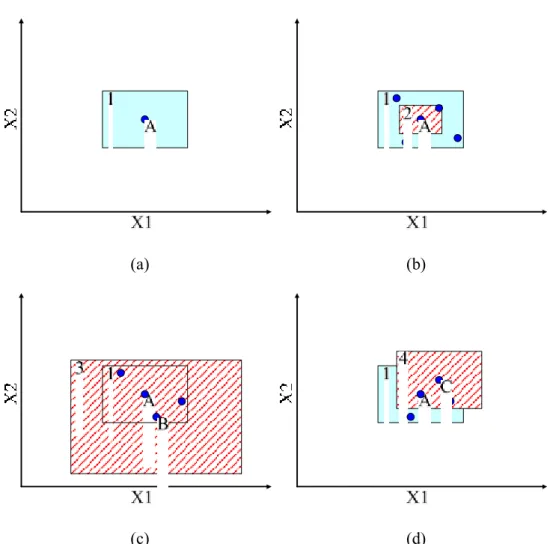
3-2 An example of how to divide the search space in the case a two-dimensional problem... 32
3-3 Flow chart of the RSSA algorithm... 33
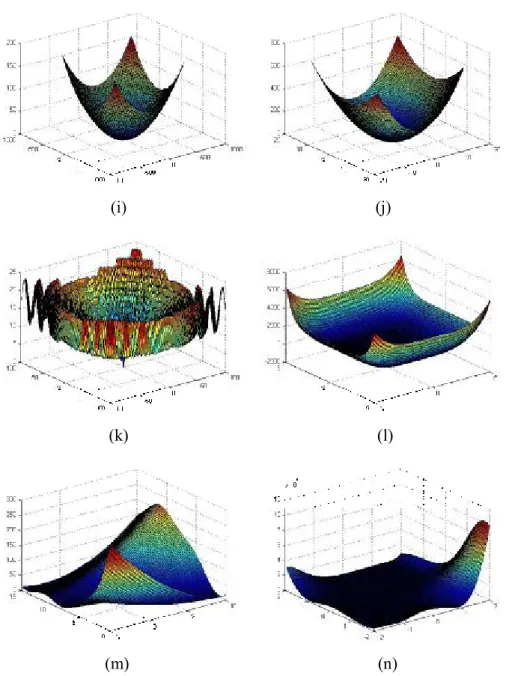
3-4 The 3-dimensional map for f1 to f14 in the 2-dimensional situation: (a) to (n)... 41
3-5 Pseudo-code for maintaining the archive... 51
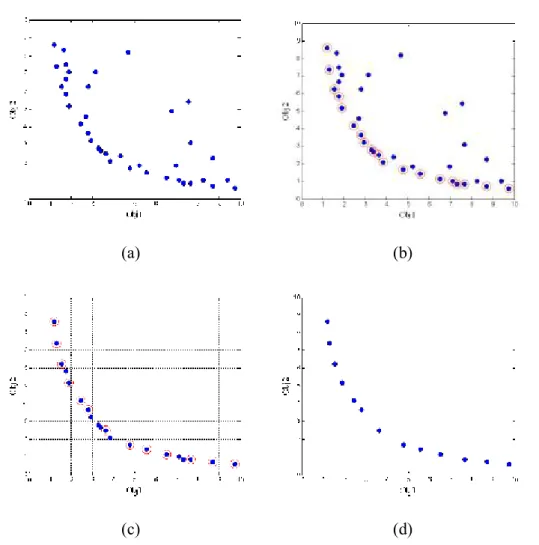
3-6 An example of non-dominated selection and diversity selection: (a) The solutions before the selections; (b) Non-dominated selection; (c) Cell selection; (d) The solutions after the selections... 53
3-7 Pareto fronts obtained by MO-RSSA... 59
3-8 The optimisation result of MO-RSSA on DTLZ1... 60
3-9 The optimisation result of MO-RSSA on DTLZ2... 61
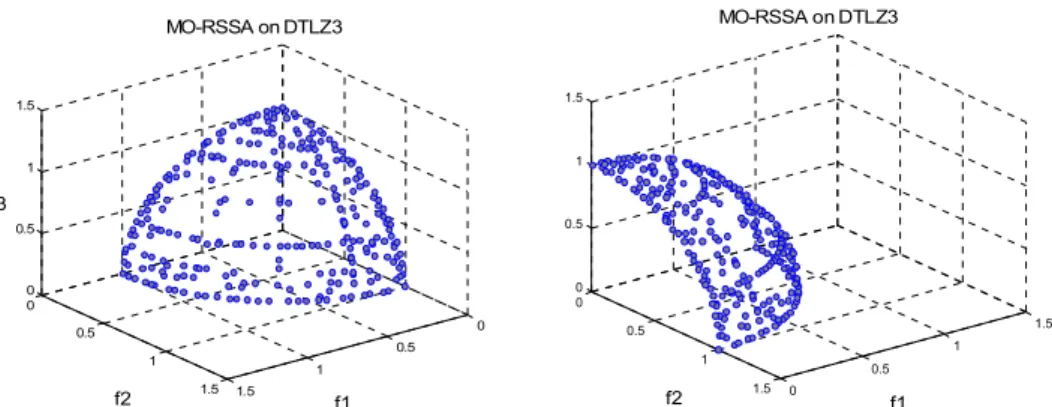
3-10 The optimisation result of MO-RSSA on DTLZ3... 61
3-11 The optimisation result of MO-RSSA on DTLZ5... 62
3-12 The optimisation result of MO-RSSA on DTLZ6... 62
3-13 The optimisation result of MO-RSSA on DTLZ7... 63
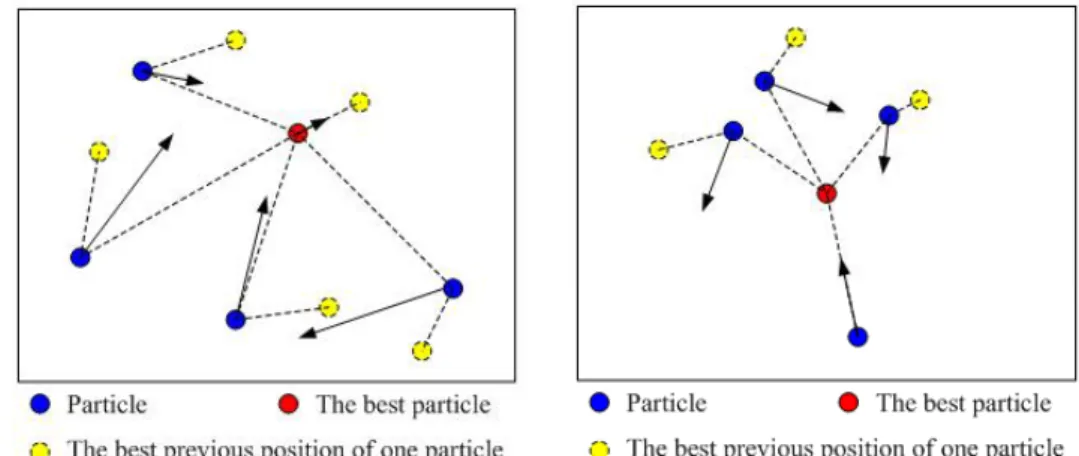
4-1 An example of the particles movements in two continuous iterations in PSO... 67
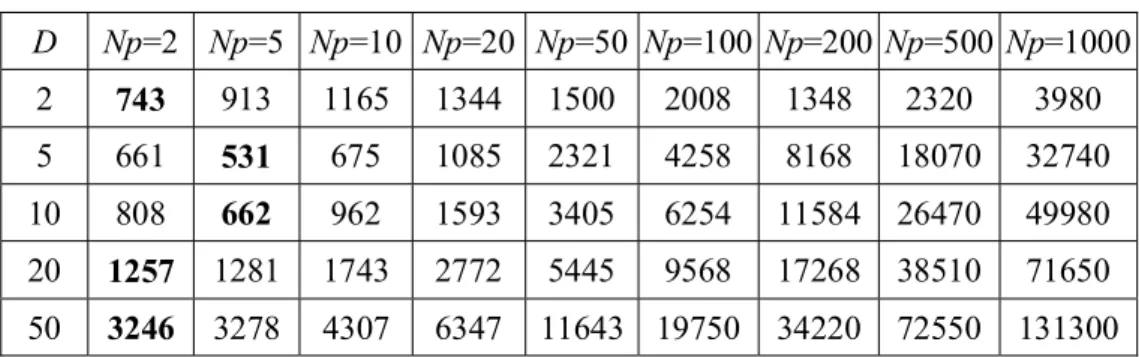
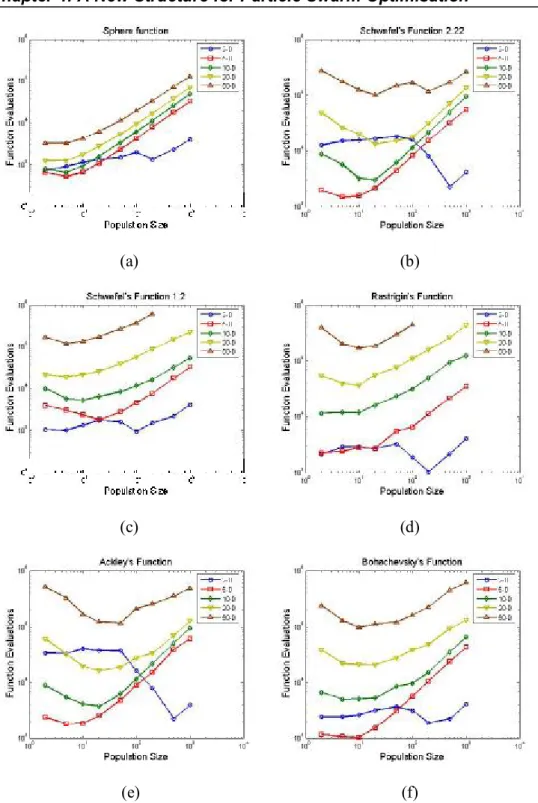
4-2 The mean number of function evaluations to find the optimum versus the population size with different problem dimension: (a) f1, (b) f2, (c)
f3, (d) f7, (e) f8 and (f) f10... 85
4-3 Pareto fronts obtained by nMPSO... 98
4-4 The optimisation result of nMPSO on DTLZ1... 99
4-5 The optimisation result of nMPSO on DTLZ2... 99
4-6 The optimisation result of nMPSO on DTLZ3... 100
4-7 The optimisation result of nMPSO on DTLZ5... 101
4-8 The optimisation result of nMPSO on DTLZ6... 101
4-9 The optimisation result of nMPSO on DTLZ7... 102
5-1 Modelling within the context of a Cartesian representation between accuracy and interpretability - the accuracy maximisation... 113
5-2 Modelling within the context of a Cartesian representation between accuracy and interpretability - the optimisation of the weighted sum of objective functions... 114
5-3 Modelling within the context of a Cartesian representation between accuracy and interpretability - the multi-objective optimisation... 116
5-4 A framework for the proposed fuzzy modelling approach... 119
5-5 Examples of data clustering... 121
5-6 Data samples of a clustering problem... 124
5-7 The hierarchical clustering dendrogram of the data samples shown in Figure 5-6... 125
5-8 An example of the initial fuzzy model construction... 130
5-9 RMSE of the validation data in the optimisation process... 143
5-10 The initial fuzzy models predicted UTS versus measured UTS: (a) all the training data (2820 data), (b) the selected training data (448 data)... 147
5-11 The trained fuzzy models predicted UTS versus measured UTS: (a) all the training data (2820 data), (b) the selected training data (448 data)... 150
List of Figures 5-13 Flow chart of the mechanism for accuracy optimisation and data
selection... 152 5-14 The well-trained fuzzy models predicted UTS versus measured UTS:
(a) all the training data (2820 data), (b) the selected training data (480 data)... 153 5-15 An example of a redundant rule... 155 5-16 An example of the membership function relates to a redundant fuzzy
set... 159 5-17 An example of membership functions of similar fuzzy sets... 160 5-18 The membership functions of Inputs 14 and 15 before the
interpretability improvement... 163 5-19 The membership functions of Inputs 14 and 15 after the
interpretability improvement... 163 5-20 The performance of fuzzy models following the interpretability
improvement with different Th1: (a) RMSE versus Th1; (b) the
number of rules versus Th1; (c) the number of fuzzy sets versus Th1;
(d) the total length of rules versus Th1... 165
5-21 The performance of fuzzy models following the interpretability improvement with different Th2: (a) RMSE versus Th2; (b) the
number of rules versus Th2; (c) the number of fuzzy sets versus Th2;
(d) the total length of rules versus Th2... 166
5-22 The performance of fuzzy models following the interpretability improvement with different Th3: (a) RMSE versus Th3; (b) the
number of rules versus Th3; (c) the number of fuzzy sets versus Th3;
(d) the total length of rules versus Th3... 167
5-23 The performance of fuzzy models following the interpretability improvement with different Th4: (a) RMSE versus Th4; (b) the
number of rules versus Th4; (c) the number of fuzzy sets versus Th4;
(d) the total length of rules versus Th4... 169
5-24 The framework of the proposed multi-objective optimisation mechanism... 171
5-25 Example of the %-range confidence band: (a) the prediction performance of the UTS model; (b) the %-range confidence band of the UTS model... 175 6-1 The performance of the optimised Pareto-optimal fuzzy models for
the nonlinear function approximation problem (6.1)... 179 6-2 The fuzzy models predicted outputs versus the measured outputs
with the nonlinear function approximation problem: (a) the initial model, (b) an optimised model with 8 rules, (c) an optimised model with 6 rules, and (d) an optimised model with 4 rules; the green and red lines represent the +10% and -10% error bands respectively... 182 6-3 The fuzzy models membership functions with the nonlinear function
approximation problem: (a) the initial model, (b) an optimised model with 8 rules, (c) an optimised model with 6 rules, and (d) an optimised model with 4 rules... 183 6-4 The optimised 8-rule fuzzy model for the nonlinear function
approximation problem... 185 6-5 Response surfaces for the nonlinear function approximation problem:
(a) the actual system and (b) the optimised 8-rule fuzzy system... 186 6-6 (a) The prediction performance and (b) the 5%-range confidence
band of the optimised 8-rule fuzzy model for the nonlinear function approximation problem... 186 6-7 The input u(k), unforced system g(k), and output y(k) of the plant
(6.3)... 188 6-8 The performance of the optimised Pareto-optimal models for the
dynamical system identification problem... 189 6-9 The fuzzy models predicted outputs versus measured outputs with
the dynamical system identification problem: (a) the initial model, (b) an optimised model with 6 rules, (c) an optimised model with 4 rules, and (d) an optimised model with 3 rules; the green and red lines represent the +10% and -10% error bands respectively... 192
List of Figures 6-10 The fuzzy models membership functions with the dynamical system
identification problem: (a) the initial model, (b) an optimised model with 6 rules, (c) an optimised model with 4 rules, and (d) an optimised model with 3 rules... 193 6-11 The optimised 6-rule fuzzy model for the dynamical system
identification problem... 195 6-12 Response surfaces for the dynamical system identification problem:
(a) the actual system and (b) the optimised 6-rule fuzzy model... 195 6-13 Training and testing errors of the optimised 6-rule fuzzy model for
the dynamical system identification problem... 196 6-14 (a) The prediction performance and (b) the 5%-range confidence
band of the optimised 6-rule fuzzy model for the dynamical system identification problem... 196 6-15 The performance of the Pareto-optimal UTS models... 199 6-16 The UTS models predicted outputs versus measured outputs: (a) the
initial model, (b) an optimised model with 13 rules, and (c) an optimised model with 10 rules; the green and red lines represent the +10% and -10% error bands respectively... 201 6-17 The UTS models membership functions: (a) the initial model, (b) an
optimised model with 13 rules, and (c) an optimised model with 10 rules... 202 6-18 Rules of the optimised 10-rule UTS model... 204 6-19 Response surfaces of the optimised 10-rule UTS model... 205 6-20 (a) The prediction performance and (b) the 5%-range confidence
band of the optimised 10-rule UTS model... 206 6-21 The performance of the Pareto-optimal ROA models... 207 6-22 The ROA models predicted outputs versus measured outputs: (a) the
initial model, (b) an optimised model with 15 rules, and (c) an optimised model with 7 rules; the green and red lines represent the +10% and -10% error bands respectively... 209
6-23 The ROA models membership functions: (a) the initial fuzzy model, (b) an optimised fuzzy model with 15 rules, and (c) an optimised fuzzy model with 7 rules... 210 6-24 Response surfaces of the optimised 15-rule ROA model... 211 6-25 (a) The prediction performance and (b) the 5%-range confidence
band of the optimised 15-rule ROA model... 212 6-26 The performance of the Pareto-optimal Elongation models... 213 6-27 The Elongation models predicted outputs versus measured outputs:
(a) the initial model, (b) an optimised model with 10 rules, and (c) an optimised model with 8 rules; the green and red lines represent the +10% and -10% error bands respectively... 215 6-28 The Elongation models membership functions: (a) the initial fuzzy
model, (b) an optimised fuzzy model with 10 rules, and (c) an optimised fuzzy model with 8 rules... 216 6-29 Response surfaces of the optimised 10-rule Elongation model... 217 6-30 (a) The prediction performance and (b) the 5%-range confidence
band of the optimised 10-rule Elongation model... 218 6-31 The performance of the Pareto-optimal Impact Energy models... 219 6-32 The Impact Energy models predicted outputs versus measured
outputs: (a) the initial model, (b) an optimised model with 15 rules, and (c) an optimised model with 8 rules; the green and red lines represent the +10% and -10% error bands respectively... 221 6-33 The Impact Energy models membership functions: (a) the initial
fuzzy model, (b) an optimised fuzzy model with 15 rules, and (c) an optimised fuzzy model with 8 rules... 222 6-34 Response surfaces of the optimised 15-rule Impact Energy model... 223 6-35 (a) The prediction performance and (b) the 5%-range confidence
band of the optimised 15-rule Impact Energy model... 224 7-1 The prediction performance of the UTS model and the ROA models
used in this chapter; the red and green lines delimit the +10% and -10% confidence bands respectively... 227
List of Figures 7-2 Average fitness of 10 runs versus function evaluation for the UTS
design problem with UTSTarget = 900 (MPa)... 229
7-3 Average fitness of 10 runs versus function evaluation for the UTS design problem with UTSTarget = 1100 (MPa)... 229
7-4 Average fitness of 10 runs versus function evaluation for the ROA design problem with ROATarget = 60 (%)... 232
7-5 Average fitness of 10 runs versus function evaluation for the ROA design problem with ROATarget = 70 (%)... 234
7-6 The maximum and minimum boundaries (Pareto fronts) for the problem of designing UTS and ROA simultaneously... 237 7-7 The performance of the Pareto-optimal solutions for the design
problem of UTSTarget = 600 (MPa) and ROATarget = 50 (%) with
respect to (a) the Objective 1 and the Objective 2 and (b) the UTS and the ROA... 240 7-8 The performance of the Pareto-optimal solutions for the design
problem of UTSTarget= 900 (MPa) and minimising the heat treatment
cost with respect to (a) Objective 1 and Objective 2; (b) UTS and Cost... 243 7-9 The performance of the Pareto-optimal solutions for the design
problem of ROATarget = 60 (%) and minimising the heat treatment
cost with respect to (a) Objective 1 and Objective 2; (b) ROA and Cost... 245 7-10 The performance of the Pareto-optimal solutions for the design
problem of UTSTarget = 900 (MPa), ROATarget = 60 (%) and
minimising the heat treatment cost with respect to (a) Objective 1 and Objective 3; (b) Objective 2 and Objective 3; (c) UTS and Cost; and (d) ROA and Cost... 247 8-1 The layout of the designed fuzzy modelling GUI... 253 8-2 An example of the modelling process using the designed fuzzy
modelling GUI: (a) loading data, (b) running the optimisation, (c) displaying the prediction performance of the training data and (d) output predicting from a set of provided discrete inputs... 253
8-3 An example of analysing the loaded data and the obtained model using the designed fuzzy modelling GUI: (a) the training data with variable ID(s) being 1 and 3, (b) the histograms of the density of the training data with variable ID(s) being 1 and 3, (c) the measured outputs vs. the predicted outputs of the training data, and (d) the inputs and output sensitivity plot (response surface) with various variable ID(s) being 1 and 2... 254
List of Tables
Table Page
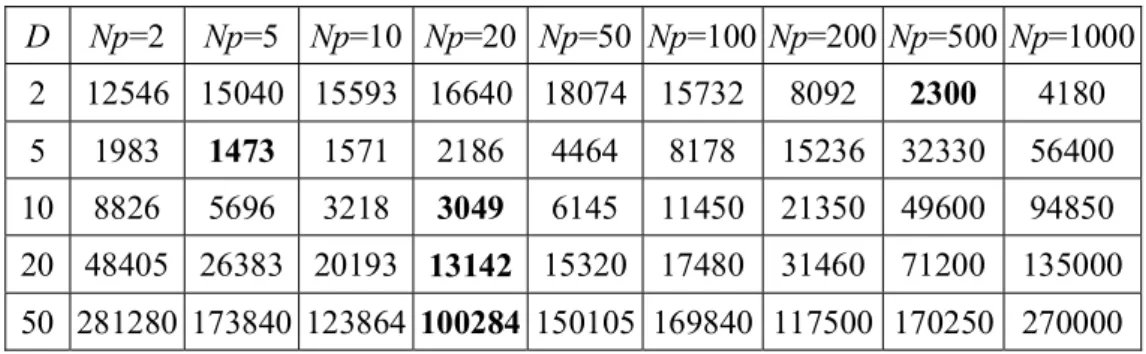
3-1 The average number of function evaluations to find the optimum; the bold values represent the best results... 43 3-2 Average performance of RSSA with different variation strategies in
optimising f5 to f11: The integer in every cell is the average function
evaluation number in successful runs; the value between the parentheses is the average result in the unsuccessful runs; the percentage value in the square brackets indicates the percentage of the successful runs out of all the runs; the bold values represent the best results... 45 3-3 Average performance of various algorithms in optimising f1 to f14:
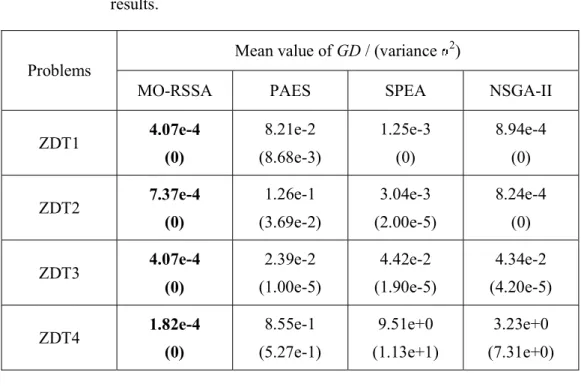
The integer in every cell is the average function evaluation number in successful runs; the value between parentheses is the average result in the unsuccessful runs; the percentage value in the square brackets indicates the percentage of the successful runs out of all the runs; the bold values represent the best results... 48 3-4 Mean and variance values of GD; the bold values represent the best
results... 58 3-5 Mean and variance values of ; the bold values represent the best
results... 58 4-1 The average number of function evaluations to find the optimum on
4-2 The average number of function evaluations to find the optimum on
f2; the bold values represent the best results... 83
4-3 The average number of function evaluations to find the optimum on
f3; the bold values represent the best results... 83
4-4 The average number of function evaluations to find the optimum on
f7; the bold values represent the best results... 83
4-5 The average number of function evaluations to find the optimum on
f8; the bold values represent the best results... 84
4-6 The average number of function evaluations to find the optimum on
f10; the bold values represent the best results... 84
4-7 Average performance of nPSO with various acceleration coefficients in optimising f1 to f14: The integer value in every cell is the average
function evaluation number in successful runs; the value in parenthesis is the average result in the unsuccessful runs; the percentage value in the square brackets indicates the percentage of the successful runs out of all the runs; the bold values represent the best results... 87 4-8 Average performance of nPSO with different position parameter
refresh mechanisms in optimising f5 to f11: The integer in every cell is
the average function evaluation number in successful runs; the value in parenthesis is the average result in the unsuccessful runs; the percentage value in the square brackets indicates the percentage of the successful runs out of all the runs; the bold values represent the best results... 89 4-9 Average performance of various algorithms in optimising f1 to f14:
The integer in every cell is the average function evaluation number in successful runs; the value in parenthesis is the average result in the unsuccessful runs; the percentage value in the square brackets indicates the percentage of the successful runs out of all the runs; the bold values represent the best results... 93 4-10 Mean and variance values of GD; the bold values represent the best
List of Tables 4-11 Mean and variance values of ; the bold values represent the best
results... 97 5-1 Comparative results of different clustering algorithms for Mamdani
fuzzy systems construction with the function approximation problem 136 5-2 Comparative results of different clustering algorithms for Mamdani
fuzzy systems construction with the ROA modelling problem... 136 5-3 Comparative results of different clustering algorithms for Mamdani
fuzzy systems construction with the UTS modelling problem... 137 5-4 Comparative results of different distance weights for Mamdani fuzzy
systems (with 8 rules) construction with the function approximation problem; the bold values represent the best results... 139 5-5 Comparative results of different distance weights for Mamdani fuzzy
systems (with 15 rules) construction with the ROA modelling problem; the bold values represent the best results... 140 5-6 Comparative results of different distance weights for Mamdani fuzzy
systems (with 30 rules) construction with the UTS modelling problem; the bold values represent the best results... 140 5-7 The main parameters of the UTS fuzzy models following the
different stages of the interpretability improvement... 162 6-1 The performance comparison of various models for the nonlinear
function approximation problem... 181 6-2 The performance comparison of various models for the dynamical
system identification problem... 191 6-3 Main parameters of the obtained UTS models... 200 6-4 Main parameters of the obtained ROA models... 208 6-5 Main parameters of the obtained Elongation models... 214 6-6 Main parameters of the obtained Impact Energy models... 220 7-1 Optimisation solutions of 10 independent runs for the UTS design
problem with UTSTarget = 900 (MPa)... 230
7-2 Optimisation solutions of 10 independent runs for the UTS design problem with UTSTarget = 1100 (MPa)... 231
7-3 Optimisation solutions of 10 independent runs for the ROA design problem with ROATarget = 60 (%)... 233
7-4 Optimisation solutions of 10 independent runs for the ROA design problem with ROATarget = 70 (%)... 235
7-5 Optimisation solutions of 10 independent runs for the design problem with UTSTarget = 900 (MPa) and ROATarget = 70 (%)... 238
7-6 Pareto-optimal solutions for the design problem with UTSTarget = 600
(MPa) and ROATarget = 50 (%)... 240
7-7 Contribution of composites to the cost of heat treatment... 242 7-8 Contribution of tempering (annealing) to the cost of heat treatment... 242 7-9 Ten of the Pareto-optimal solutions for the design problem of
UTSTarget = 900 (MPa) and minimising the heat treatment cost... 244
7-10 Ten of the Pareto-optimal solutions for the design problem of ROATarget = 60 (%) and minimising the heat treatment cost... 245
7-11 Ten of the Pareto-optimal solutions for the design problem of UTSTarget = 900 (MPa), ROATarget = 60 (%) and minimising the heat
Chapter 1
Introduction
1.1 Background and Research Aims
Knowledge discovery is one of the most important activities that, we humans, undertake almost on a daily basis. It helps people recognise and understand some of the intricacies of the ancient and modern worlds. In computer science, knowledge discovery is one of the most desirable end-products of computing and is also one of the most difficult computing challenges to undertake.
For this purpose, one can identify two complementary approaches, which are knowledge acquisition from experts and knowledge discovery from data.
Knowledge acquisition from experts often includes discovery as a by-product, since the formalisation often uncovers new linkages. But that discovery also depends on human recognition of unexpected phenomena. Such discoveries must often be validated with broader tests, since a single expert typically has a narrow
view of the world. [Fayyad et al. 1996]. In some of new and more complex systems, the knowledge cannot even be obtained from experts because of the lack of understanding of the systems themselves.
Discovering knowledge from data can help to overcome the above limitations. During the last two decades, one would have witnessed an explosive growth in humans capabilities to both generate and collect data. By analysing and summarising these data, one can extract useful knowledge from such information. Experts may have known one part of the knowledge, but the other part is totally new to us humans.
To employ the idea of discovering knowledge from data, the format of knowledge expression must be determined first. In some particular domains, appropriate models exist and can be used in new knowledge expression. Experts can understand the new knowledge based on these models. But in some other domains, there are currently no models that can be used in a new knowledge expression. In this situation, fuzzy systems appear to be suitable for complex and uncertain environments.
Fuzzy systems are known to be universal approximators [Wang 1992] and good at modelling complex, nonlinear, or partially unknown systems [Babuska 1998; Passino & Yurkovich 1998; Wang 1997]. These systems are normally based on linguistic knowledge expressions that are easy to be understood not only by an expert but also by an even wider audience. The advantages of fuzzy systems in
Chapter 1: Introduction
both adaptability and transparency make them suitable for knowledge discovery in this current research project.
A Mamdani-type fuzzy system [Mamdani & Assilian 1975] is the first type of fuzzy systems, which is based on Zadeh's theories in human-machine interaction [Zadeh 1973]. It uses linguistic expressions in both the antecedent and consequent parts. Later, the TSK-type fuzzy system [Takagi & Sugeno 1985] was introduced by replacing the linguistic consequent parts of the Mamdani-type fuzzy system with mathematical functions. Because of their computational efficiency and their high accuracy, TSK-type fuzzy systems seem attractive and as a result abundant research has been carried-out based on their associated architectures in recent years. However, one cannot ignore the fact that on a linguistic level these numerically improved systems are somewhat meaningless to human operators.
In fact, the most attractive property of fuzzy systems lies in their ability of processing information in linguistic terms. But it can be argued now that this aspect is somewhat neglected and sacrificed to numerical accuracy. In this current research project, more attention will be paid to building more transparent (interpretable) fuzzy systems.
To implement a fuzzy system in a knowledge discovery context, it must cooperate with other paradigms that include some learning abilities. Two of the most successful attempts to hybridise fuzzy systems with learning and adaptation methods include neural fuzzy systems [Jang et al. 1997; Nauck et al. 1997; Fuller
1999] and genetic fuzzy systems [Pedrycz 1997; Cordon et al. 2001].
Neural fuzzy systems have been studied extensively in the last ten years while genetic fuzzy systems are still not fully developed. In recent years, better evolutionary computing based algorithms other than genetic algorithms (GAs) [Holland 1975] have been researched. These should be helpful in improving the learning abilities of fuzzy systems if used in cooperation with these algorithms. However, most of the current research still focuses on the hybridisation of fuzzy systems with only GAs. On the other hand, research about GA-based approaches focuses on simple problems and discovering knowledge at a low level, most of which are of two or three-input one-output systems. Only a few high-quality genetic fuzzy systems have been proposed and used in real industrial applications. Thus, in the research contained in this thesis, more emphasis will be directed forwards the cooperation of fuzzy systems with some effective evolutionary computing based optimisation algorithms.
It is worth nothing that data-driven modelling based on fuzzy systems possesses two conflicting requirements: accuracy (precision) and transparency (interpretability). Accuracy is easy to embrace as it relates to the capability of representing a real system faithfully, this representing a fundamental requirement for models. In contrast, interpretability means that human beings should be able to understand a fuzzy systems behaviour by inspecting its associated rule-base. The latter is crucial in the field of data mining and knowledge discovery, where information should be extracted from data bases and represented in a
Chapter 1: Introduction
comprehensible form, or for decision support systems where the reasoning process should be transparent to the users [Mikut et al. 2005]. To deal with this type of problems with conflicting objectives, multi-objective optimisation techniques [Deb 2001] becomes a natural choice. Another advantage of the multi-objective optimisation technique is that it will lead to a set of Pareto-optimal models with different accuracy and interpretability levels, instead of only one solution if using other learning techniques. This should provide more options and add more flexibility to users. Therefore, designing efficient optimisation algorithms, including multi-objective optimisation algorithms, will form another task within this research project.
Through the simulation of natural and social behaviours, researchers have succeeded in developing many successful approaches to solve complex problems. Artificial neural networks and evolutionary algorithms are two of the most salient representatives. Artificial neural networks imitate the structure of biological neural networks and mimic the process of human learning and memory to manage information. On the other hand, most of the introductions of evolutionary algorithms are also inspired by some natural or social behaviour. For example, Genetic Algorithms (GA) imitate the natural evolution, while Particle Swarm Optimisation (PSO) [Kennedy & Eberhart 1995] algorithms mimic the behaviour of birds flock. In the same way, more effort will be devoted to develop nature-inspired or social-inspired methods for optimisation problems.
necessary to validate them in real industrial problems. In this research project, the proposed methodologies will be applied to the modelling and design problems relating to the steel (metal) industry.
In materials engineering, it is important to establish appropriate and reliable mechanical property prediction models for materials design and development. In the past, several mechanical property models were developed, which were mainly based on linear regression methods [Pickering 1978] or artificial neural networks [Hodgson 1996; Chen et al. 1998; Bakshi & Chatterjee 1998]. Linear models are only designed for specific classes of steels and specific processing routes, and are not sophisticated enough to account for more complex interactions, while neural networks can be seen as black-box techniques and the knowledge behind this kind of models cannot be understood fully. Thus, developing a fast, efficient and transparent data-driven modelling framework for material property prediction is still needed. In this situation, fuzzy modelling provides an ideal approach because of its interpretable structure and its excellent ability of learning from data.
If intelligent models in the form of fuzzy systems were constructed to predict the mechanical test results for alloy steels, then these models can be implemented to facilitate the optimal design of alloy steels. In the steel industry, determining the optimal heat treatment regime and the required weight percentages for chemical composites to obtain the desired mechanical properties of the steel is always a challenging multi-objective optimisation problem. Usually, some objectives may conflict with each other, such as the Ultimate Tensile Strength (UTS) and the
Chapter 1: Introduction
ductility. By using the designed multi-objective optimisation algorithms and the developed prediction models, the design targets can be achieved.
Above all, in this project, a cooperative fuzzy modelling framework is investigated, which integrates such transparent fuzzy systems with the effective evolutionary computing based algorithms and involves many techniques, such as data clustering, data mining, as well as multi-objective optimisation. Evolutionary optimisation algorithms are also developed following the nature-inspired or the social-inspired ideas, which are an essential part of the modelling framework and are employed in the optimal design problems as well. This cooperative fuzzy modelling methodology and the proposed evolutionary optimisation algorithms are then applied to knowledge discovery, in terms of system modelling and optimal design, using simulation platforms as well as real industrial data.
1.2 Structure of the Thesis
The next paragraphs will describe the key points covered by the various chapters in this thesis.
Chapter 2 will introduce some basic knowledge relating to this project. This will include the basic concepts relating to fuzzy sets, fuzzy systems, optimisation and multi-objective optimisation. The frameworks relating to single objective and multi-objective optimisation algorithms will also be described.
Chapter 3 will propose a new nature-inspired optimisation algorithm, Reduced Space Searching Algorithm (RSSA). This algorithm will be validated using a set of well-known benchmark problems and compared with some recently developed and most salient optimisation algorithms, the Covariance Matrix Adaptation Evolution Strategy (CMA-ES), the Differential Evolution (DE) and the Generalised Generation Gap model with the Parent-Centric Recombination operator (G3-PCX). In addition, various parameter settings will be explored and the appropriate parameter configurations will be outlined. Furthermore, this new algorithm will be extended to the multi-objective optimisation case (MO-RSSA), in which the Random Weighted Aggregation (RWA) technique will be employed and a new approach named cell selection method will be introduced in order to keep a good diversity of the Pareto-optimal solutions. A comparative study between MO-RSSA and other MOEAs, such as the Pareto Archived Evolution Strategy (PAES), the Strength Pareto Evolutionary Algorithm (SPEA) and the Non-dominated Sorting Genetic Algorithm II (NSGA-II) will be carried-out based on a set of challenging problems, such as the ZDT and DTLZ series problems.
In Chapter 4, a new social-inspired algorithm, the new Particle Swarm Optimisation (nPSO), will be proposed, which will introduce a new momentum term to replace the original inertia term of the standard PSO. This algorithm will be validated using a set of benchmark problems and will be compared with the standard PSOs and some other salient optimisation algorithms. In addition, various parameter settings will be explored in detail and the appropriate parameter
Chapter 1: Introduction
configurations will also be outlined. Furthermore, nPSO will be extended to the multi-objective optimisation case and the newly developed multi-objective PSO (nMPSO) will be compared with several well-known evolutionary multi-objective algorithms, such as PAES, SPEA and NSGA-II, via the ZDT and DTLZ series problems.
Chapter 5 will propose a new framework for data-driven fuzzy modelling, named the Fuzzy Modelling approach with a Hierarchical Clustering algorithm and a Multi-objective Optimisation mechanism (FM-HCMO), in order to construct linguistic fuzzy models considering both the accuracy and the interpretability of fuzzy systems. In this methodology, a new agglomerative complete-link clustering algorithm will be first developed and applied to construct an initial fuzzy model. A new data selection technique will then be proposed to select the representative training data used to improve the modelling efficiency. A multi-objective optimisation mechanism will then be developed for the improvement of modelling performance, which will take into account both the accuracy and interpretability attributes. Finally, a method for computing the confidence bands relating to the model prediction analysis will be described. All of these proposed techniques will be validated via a series of experiments using real industrial data from the steel industry.
In Chapter 6, the proposed modelling framework FM-HCMO will be validated as a whole. The test problems will include the benchmark problems relating to the identification of nonlinear, static and dynamic systems, as well as the modelling
problems of the mechanical properties for alloy steels, namely the Ultimate Tensile Strength (UTS), Reduction of Area (ROA), Elongation and Impact Energy.
In Chapter 7, RSSA and MO-RSSA will be applied to single objective and multi-objective optimal design of alloy steels. This research aims at determining the optimal heat treatment regime and the required weight percentages for chemical composites to obtain the desired mechanical properties of steel, such as UTS and ROA. In addition, the work will later be extended to include economic factors, such as the costs associated with the composites and the machining operation.
Finally, Chapter 8 will detail the conclusions resulting from the work within this project, together with future research directions.
Chapter 2
Evolutionary Based Optimisation and
Fuzzy Theories - A Background
2.1 Optimisation
2.1.1 Single Objective Optimisation
In mathematics, the term optimisation refers to the study of problems in which one seeks to minimise or maximise a real function by systematically choosing the values of real or integer variables from within an allowed set.
Normally, an optimisation problem can be represented in the following way: Given a function f : A R, seek a solution x* A such that f(x*) f(x)
for all x in A (minimisation) or such that f(x*) f(x) for all in A (maximisation).
Typically,A is the subset of the Euclidean space Rn and is often specified by a set of constraints, equalities or inequalities that the members of A should satisfy. The domain A of f is called the search space, while the elements x of A are called candidate solutions or feasible solutions. The function f is called an objective function, or cost function. The feasible solution that minimises (or maximises, if that is the goal) the objective function is called an optimal solution.
Generally, the optimisation problems may include some local minima or maxima, where a local minimum is defined as a point, for which there exists some > 0 so that for all
l
x
x where x xl , the expression f(xl) f(x) holds. That is to
say, in some region around xl, all of the function values are greater than or equal
to the value at the xl point. Local maxima are defined similarly.
2.1.2 Multi-Objective Optimisation
Multi-objective optimisation [Sawaragi et al. 1985; Steuer 1986], also known as multi-criteria optimisation, is the process of simultaneously optimising two or more conflicting objectives subject to certain constraints.
In mathematical terms, the multi-objective problem can be written as follows: Find a vector x* that will optimise the following vector function:
)] ( , ), ( ), ( ), ( [ ) (x f1 x f2 x f3 x f x f k
Chapter 2: A Background
subject to the m inequality constraints gi(x) 0, i 1,2,3, ,m, and the p equality constraints hj(x) 0, j 1,2,3, ,p, where x is the vector of decision variables.
If a multi-objective problem is well formed, there should not be a single solution that simultaneously optimises each objective to its fullest. Meanwhile, multiple solutions exist, for which each objective has been optimised to the extent that if one tries to optimise it any further, then the other objective(s) will suffer as a result. These solutions are regarded as the answer to the multi-objective optimisation problem, which are called Pareto-optimal solutions or non-dominated solutions [Sawaragiet al. 1985; Steuer 1986; Deb 2001].
Pareto-optimal solutions (non-dominated solutions) are those for which improvement in one objective can only occur with the worsening of at least one other objective. They are defined as follows (for a minimisation problem):
One solution is Pareto optimal, where A is the feasible solution space, if for every
A x
A
x
either fi(x) fi(x ), i k, where k is the number of objectives, or there is at least one such that. k i ) ( ) (x f x fi i
The above definition means that x* is Pareto optimal if there is no feasible vector
x that would decrease some objective values without causing a simultaneous increase in at least one other objective value [Coello Coello 1999].
Multi-objective optimisation problems can be found in various fields such as product and process design, finance, aircraft design, the oil and gas industry, automobile design, or wherever optimal decisions need to be taken in the presence of trade-offs between two or more conflicting objectives, for instance, maximising the profit and minimising the cost of a product; maximising the performance and minimising the fuel consumption of a vehicle; and minimising the weight while maximising the strength of a particular component.
2.2 Evolutionary Computation
Evolutionary computation [Eiben & Smith 2003; De Jong 2006] is a subfield of artificial intelligence that involves optimisation problems. It uses iterative progress with a growth or development in a population. This population is then selected in a guided random search using parallel processing to achieve the desired end. Such processes are often inspired by biological mechanisms of evolution.
Evolutionary techniques mostly involve evolutionary algorithms (comprising genetic algorithms [Mitchell 1996], evolutionary programming [Eiben & Smith 2003], evolution strategy [Beyer 2001], genetic programming [Langdon & Poli 2002] and learning classifier systems [Bull & Kovacs 2005]), swarm intelligence (comprising ant colony optimisation [Dorigo & Stutzle 2004] and particle swarm optimisation [Kennedy et al. 2001]), self-organising maps [Kohonen 2001], differential evolution [Price et al. 2005], and artificial immune systems [De Castro
Chapter 2: A Background
& Timmis 2002].
2.2.1 Evolutionary Algorithms
In artificial intelligence, evolutionary algorithms (EA) are the generic population-based metaheuristic optimisation algorithms, which are a subset of evolutionary computation. An EA uses some mechanisms (operators) inspired by biological evolution: reproduction, mutation, recombination, and selection. Candidate solutions to the optimisation problem play the role of individuals in a population, and the cost function determines the environment within which the solutions live. Evolution of the population then takes place after the repeated application of the above operators.
Evolutionary algorithms consistently perform well in approximating solutions to all types of problems because they do not make any assumptions about the underlying fitness landscape. This generality is shown by successes in fields as diverse as engineering, art, biology, economics, marketing, genetics, operations research, robotics, social sciences, physics, politics, and chemistry.
2.2.1.1 Genetic Algorithms
algorithms. They are inspired by evolutionary biology such as inheritance, mutation, natural selection, and recombination (or crossover). Over the last two decades, GAs have been extensively used as search and optimisation tools in various problem domains, including science, commerce and engineering. The main reasons for their success lie in their broad applicability, ease of use and global perspective [Goldberg 1989].
The concept of a genetic algorithm was first proposed by John Holland of the University of Michigan in 1975 [Holland 1975]. Most of the initial research work can be found in various early international conference proceedings and several textbooks [Goldberg 1989; Holland 1975; Michalewicz 1992; Back et al. 1997]. Some journals are dedicated to promote research in evolutionary algorithms, certainly including GAs, such as Evolutionary Computation Journal published by MIT Press, Transactions on Evolutionary Computation published by IEEE and
Genetic Programming and Evolutionary Computation published by Kluwer Academic Publishers. New developments about GAs and other evolutionary algorithms can be found in these journals as well as in recent international conference proceedings.
2.2.1.2 Evolution Strategies
The idea behind Evolution Strategies (ES) represents a joint development of Bienert, Rechenberg and Schwefel in the 1960s at the Technical University of
Chapter 2: A Background
Berlin (TUB) in Germany. The first application of ESs was experimental and attempted to solve the shape optimisation of a bended pipe, the drag minimisation of a jointed plate and the shape optimisation of a flashing nozzle. Thereafter, different versions of ESs were suggested, such as multi-membered ESs, recombinative ESs and self-adaptive ESs. More details can be found in [Michalewicz 1992; Schwefel & Rudolph 1995; Back et al. 1997].
Though the ESs working principle is similar to that of a real-parameter GA used with selection and mutation operators only. The early ES is fundamentally different from the early binary GAs in mainly two ways: (1) ESs use real values for coding and (2) ESs do not use any crossover-like operator. In addition, the step size of ESs mutation operator can adjust itself adaptively during the optimisation process. That gives ESs the capability of self-adaptation which GAs do not have. The latter is also the reason why there are still many researchers interested in ESs.
2.2.2 Swarm Intelligence
Swarm intelligence (SI) is an artificial intelligence based on the collective behaviour of decentralised, self-organised systems. The expression was introduced by Gerardo Beni and Jing Wang in 1989, in the context of cellular robotic systems [Beni & Wang 1989].
locally with one another and with their environment. The agents follow very simple rules, and although there is no centralised control structure dictating how individual agents should behave, local interactions between such agents lead to the emergence of complex global behaviour. Natural examples of SI include ant colonies, bird flocking, animal herding, bacterial growth, and fish schooling. The most successful algorithms employing swarm intelligence are Ant Colony Optimisation (ACO) [Dorigo et al. 1996] and Particle Swarm Optimisation (PSO) [Kennedyet al. 2001].
2.2.2.1 Particle Swarm Optimisation (PSO)
Particle swarm optimisation is a population-based evolutionary computing algorithm for problem solving. It is the type of swarm intelligence that is based on social-psychological principles and provides insights into social behaviour, as well as contributing to engineering applications. The particle swarm optimisation algorithm was first described in 1995 by James Kennedy and Russell C. Eberhart [Eberhart & Kennedy 1995; Kennedy & Eberhart 1995] and the techniques have evolved greatly since then.
Since its introduction in 1995, the PSO method has become very popular due to its simplicity of implementation and ability to quickly converge to a reasonably good solution. A fair amount of research results have been reported in the literature and the first book dedicated to PSO [Kennedy et al. 2001] has been published in 2001.
Chapter 2: A Background
2.2.3 Multi-Objective Optimisation Algorithms within Evolutionary Computation
Most real-world search and optimisation problems naturally involve multiple objectives. Knowledge discovery can also be seen as multi-objective. For example, one objective is that the knowledge discovered should be accurate and the other objective is that the knowledge should be transparent. These two objectives conflict with each other to a certain extent. With the accuracy of the knowledge increasing, the amount of the knowledge will also increase. This will make the knowledge less transparent for people to understand. If we want to decrease the amount of the knowledge for easier and better understanding, the accuracy should decrease. Zadeh termed this principle of incompatibility [Zadeh 1973]. To solve multi-objective problems in knowledge discovery, multi-objective optimisation techniques are needed. Here, several well-known evolutionary multi-objective optimisation algorithms which have been developed in recent years will be discussed.
2.2.3.1 Strength Pareto Evolutionary Algorithm
The Strength Pareto Evolutionary Algorithm (SPEA) was introduced by Zitzler and Thiele [Zitzler & Thiele 1998] and was proposed as a way of integrating different Multi-Objective Evolutionary Algorithms (MOEAs). This algorithm introduces elitism by maintaining an archive to store non-dominated solutions
previously found, which is called an external non-dominated set. At every generation, newly found non-dominated solutions are compared with the existing external population and the best non-dominated individuals are copied to the external non-dominated set. For each individual in the external set, a strength value is calculated, which is proportional to the number of solutions to which the certain individual dominates. The fitness of each individual in the current population is calculated according to the strength of all external non-dominated solutions that dominates it. To maintain diversity, a clustering technique average linkage method is used.
A second version of the original algorithm, Strength Pareto Evolutionary Algorithm 2 (SPEA2), was proposed in 2001 [Zitzler et al. 2001]. It has three main differences with respect to its predecessor: (1) it improves the fitness assignment scheme which, for each individual, takes into account how many individuals that it dominates and it is dominated by; (2) it incorporates a nearest neighbour density estimation technique which gives a more precise guidance for the search process, and (3) it uses an enhanced archive truncation method to guarantee the preservation of boundary solutions.
2.2.3.2 Pareto Archived Evolution Strategy
The Pareto Archived Evolution Strategy (PAES) was introduced by Knowles and Corne in 2000 [Knowles & Corne 2000]. In its simplest form, PAES consists of a
Chapter 2: A Background
(1+1) evolution strategy, which means that a single parent generates a single offspring in every generation. In PAES, a historical archive, which is the elitist mechanism of the algorithm, is used to record some of the non-dominated solutions previously found. This archive works as a reference set against which each mutated individual is being compared. To maintain diversity, the algorithm uses a mechanism that consists of a crowding procedure that divides objective space in a recursive manner. Each solution is located in a certain grid based on its objective value. The number of solutions that reside in each grid location is recorded in an external memory. This information is used for the selection and the archiving processes. This method has two advantages over other methods used in some multi-objective GAs: Its computational cost is lower; it is adaptive and does not need the critical setting of other extra parameters except for the number of divisions of the objective space.
2.2.3.3 Nondominated Sorting Genetic Algorithm II
The Nondominated Sorting Genetic Algorithm II (NSGA-II) [Deb et al. 2002] was proposed by Deb et al., which represents a revised version of the Nondominated Sorting Genetic Algorithm (NSGA) [Srinivas & Deb 1994] and is more efficient than its predecessor. It employs a crowded tournament selection operator to keep diversity. In the elitist mechanism of NSGA-II, it does neither use an external memory nor does it specify any extra niching parameters as most of the other algorithms have to do. Instead, the elitist mechanism consists of combining the
best parents with the best offspring obtained. Because of NSGA-IIs elitist approach and less parameters needed, NSGA-II has become one of the best multi-objective optimisation algorithms.
There are some other evolutionary multi-objective optimisation algorithms proposed in recent years. More details can be found in the following books and papers [Coello Coello 1999; Deb 2001; Zitzler et al. 2002; Coello Coello 2003; Zitzleret al. 2003].
2.3 Fuzzy Sets and Fuzzy Systems
2.3.1 Fuzzy Sets
Fuzzy sets are sets whose elements have degrees of membership. Fuzzy sets have been introduced by Lotfi A. Zadeh [Zadeh 1965] at the University of California, Berkeley, as an extension of the classical notion of a set. In classical set theory, the membership of elements in a set is assessed in binary terms according to a bivalent condition - an element either belongs or does not belong to the set. By contrast, fuzzy set theory permits the gradual assessment of the membership of elements in a set; this is described with the aid of a membership function valued in the real unit interval [0, 1]. Fuzzy sets generalise classical sets, since the indicator functions of classical sets are special cases of the membership functions of fuzzy sets, if the latter only take values 0 or 1[Dubois & Prade 1988].
Chapter 2: A Background
A fuzzy set is a pair (A, A) where A is a set and A:A [0, 1] is a membership
function. For each x A , A(x) is the grade of membership of x.
0 ) ( ) , (A x A x
x A A . If A = {z1, ..., zn}, the fuzzy set (A, A) can also
be denoted as { A(z1) / z1, ..., A(zn) / zn}.
An element mapping to the value 0 means that the member is not included in the fuzzy set, value 1 describes a fully included member. Values strictly between 0 and 1 characterise the fuzzy members.
Generally, the membership functions A(x) use Gaussian functions,
triangular-shape functions or trapezoidal-triangular-shape functions, as shown in Figure 2-1.
x
(
x
)
1
Figure 2-1. An example of membership functions
2.3.2 Fuzzy Systems
applied to a wide variety of fields ranging from control, signal processing, communications, integrated circuit manufacturing, and expert systems to business, medicine, psychology, etc.
A fuzzy system basically consists of four components: fuzzy rule-base, fuzzy inference engine, fuzzifier and defuzzifier. Figure 2-2 shows the diagram of a fuzzy system.
Figure 2-2. The basic configuration of fuzzy systems
The heart of a fuzzy system is the knowledge-base (rule-base) consisting of the so-called fuzzy IF-THEN rules and all other components are used to implement these rules in a reasonable and efficient manner. A fuzzy IF-THEN rule is an IF-THEN statement in which some words are characterised by continuous membership functions. Specifically, the fuzzy rule-base comprises the following fuzzy IF-THEN rules:
Rulel:IFx1 is A1l and and xn is Anl,THENy is Bl,
Chapter 2: A Background
are fuzzy sets in and , respectively, and x =
and are the input and output (linguistic) variables of the fuzzy system, respectively. R Ui V R x x x T U n) , , , ( 1 2 V y
The fuzzifier is defined as a mapping from a real-valued point x* to a fuzzy set A* in U. Normally, three types of fuzzifiers are used, which are singleton
fuzzifier, Gaussian fuzzifier and triangular fuzzifier [Wang 1997]. The defuzzifier is defined as a mapping from a fuzzy set B* in (which is the output of the fuzzy inference engine) to a crisp point . Conceptually, the task of the defuzzifier is to specify a point in V that best represents the fuzzy set B*. Three
mostly used defuzzifiers are centre of gravity defuzzifier, centre average defuzzifier and maximum defuzzifier [Wang 1997].
n R U R V V y*
In a fuzzy inference engine, fuzzy logic principles are used to combine the fuzzy IF-THEN rules in the fuzzy rule-base into a mapping from a fuzzy set A* in U to a
fuzzy set B*. For more information and details about the fuzzy inference engine,
please refer to the book [Wang 1997].
2.4 Summary
In this chapter, some basic knowledge relating to this research project was introduced. This includes the basic concepts relating to optimisation, multi-objective optimisation, evolutionary computation, fuzzy sets, and fuzzy systems.
Meanwhile, some important single objective and multi-objective optimisation algorithms based on evolutionary computation principles were also introduced, which include Genetic Algorithms, Evolution Strategies, Particle Swarm Optimisation, Strength Pareto Evolutionary Algorithms, Pareto Archived Evolution Strategy, and Nondominated Sorting Genetic Algorithm II. The next chapter presents the development of a new optimisation algorithm in its single objective format as well as its multi-objective extension.
Chapter 3
A New Reduced Space Searching
Algorithm with Applications to Single
Objective and Multi-Objective Problems
3.1 Introduction to the Reduced Space Searching (RSS) Strategy
Inspired by natural and social behaviours, researchers have developed many successful optimisation algorithms. For example, the Genetic Algorithm (GA) [Holland 1975; Goldberg 1989] originates from the simulation of natural evolution, while the Particle Swarm Optimisation (PSO) [Kennedy and Eberhart 1995; Eberhart and Kennedy 1995] algorithm is motivated by the simulation of the social behaviour of birds flock. In the same way, a new search and optimisation algorithm Reduced Space Searching Algorithm (RSSA) is reported in this chapter, which is inspired by the simple human experience when looking for an optimal