University of Nebraska - Lincoln
DigitalCommons@University of Nebraska - Lincoln
Cornhusker Economics
Agricultural Economics Department
2013
Updated ACRE Analysis for 2012 and 2013
Bradley Lubben
University of Nebraska-Lincoln, [email protected]
Follow this and additional works at:
http://digitalcommons.unl.edu/agecon_cornhusker
This Article is brought to you for free and open access by the Agricultural Economics Department at DigitalCommons@University of Nebraska Lincoln. It has been accepted for inclusion in Cornhusker Economics by an authorized administrator of DigitalCommons@University of Nebraska -Lincoln.
Lubben, Bradley, "Updated ACRE Analysis for 2012 and 2013" (2013).Cornhusker Economics. 652. http://digitalcommons.unl.edu/agecon_cornhusker/652
C
ORNHUSKER
E
CONOMICS
University of Nebraska–Lincoln Extension
August 21, 2013
Institute of Agriculture & Natural Resources Department of Agricultural Economics http://agecon.unl.edu/cornhuskereconomics
Updated ACRE Analysis for 2012 and 2013
Market Report
Yr Ago
4 Wks
Ago 8/16/13
Livestock and Products, Weekly Average
Nebraska Slaughter Steers,
35-65% Choice, Live Weight. . . . Nebraska Feeder Steers,
Med. & Large Frame, 550-600 lb.. . . . Nebraska Feeder Steers,
Med. & Large Frame 750-800 lb. . . . Choice Boxed Beef,
600-750 lb. Carcass. . . . Western Corn Belt Base Hog Price Carcass, Negotiated. . . . Pork Carcass Cutout, 185 lb. Carcass, 51-52% Lean.. . . . Slaughter Lambs, Ch. & Pr., Heavy, Wooled, South Dakota, Direct. . . . National Carcass Lamb Cutout,
FOB. . . . $120.68 159.00 144.82 190.23 85.32 91.82 118.13 320.41 $119.79 177.09 151.94 189.83 98.72 99.13 117.38 278.62 $125.00 182.24 158.34 192.13 96.85 102.85 117.75 282.15 Crops,
Daily Spot Prices Wheat, No. 1, H.W.
Imperial, bu. . . . Corn, No. 2, Yellow
Nebraska City, bu.. . . . Soybeans, No. 1, Yellow
Nebraska City, bu.. . . . Grain Sorghum, No. 2, Yellow
Dorchester, cwt. . . . Oats, No. 2, Heavy
Minneapolis, MN , bu. . . . 8.01 8.04 16.96 13.29 4.02 6.86 7.04 15.61 11.50 3.87 6.76 5.84 13.94 8.82 4.05 Feed
Alfalfa, Large Square Bales, Good to Premium, RFV 160-185 Northeast Nebraska, ton. . . . Alfalfa, Large Rounds, Good
Platte Valley, ton. . . . Grass Hay, Large Rounds, Good Nebraska, ton. . . . Dried Distillers Grains, 10% Moisture, Nebraska Average. . . . Wet Distillers Grains, 65-70%Moisture, Nebraska Average. . . . 242.50 220.00 155.00 307.50 120.88 250.00 180.00 150.00 225.00 85.00 245.00 165.00 160.00 215.50 72.50 *No Market
The one-year extension of the farm bill legislation back on January 1, 2013 brought with it a new round of enrollment and producer decisions between the Average Crop Revenue Election (ACRE) Program and the Direct and Counter-Cyclical Program (DCP). Producers faced a new program participation decision for the 2013 crop year, and another choice between ACRE and DCP that was first considered in 2009. As with the earlier decision, the choice between ACRE and DCP largely came down to expectations of ACRE payments and protection relative to the larger guaranteed Direct Payment (DP) received in the DCP. A quick review of the mechanics and features of each program provides a general overview:
ACRE
• Average revenue-based safety net tied to benchmark based on average yields and average prices.
• Protection from revenue losses when state and farm revenue both fall below respective benchmarks. • Protection tied to planted acres of program
commodities on a farm, up to the farm’s total base acreage.
• DPs available on base acres and program yields at 80 percent of the full DP rate for ACRE participants. • Non-Recourse Marketing Assistance Loan (ML)
available on actual production at 70 percent of the full ML rate for ACRE participants.
DCP
• Price-based safety net tied to set-in-legislation target prices.
• Counter Cyclical Payment (CCP) protection from price losses when national marketing year average price falls below CCP trigger price (target price minus DP rate). • Protection tied to base acres and program yields of
program commodities on a farm.
E xtension is a D ivision of the Institute of A griculture and N atural R esources at the U niversity of N ebrask a–Lincoln cooperating w ith the C ounties and the U .S . D epartm ent of A griculture. U niversity of N ebrask a E xtension educational program s abide with the non-discrim ination policies of the U niversity of N ebrask a–Lincoln and the U nited S tates D epartm ent of A griculture.
• DPs and MLs available at full rates for DCP participants.
The sign-up decision in 2013 presumably was affected by expected ACRE protection for 2013, as well as experiences of ACRE payments in 2009-2012. An earlier issue of Cornhusker Economics (April 10, 2013) examined both expected payments for the 2012 crop year as well as guarantees and expected protection for 2013. This issue updates that analysis and shows the substantial impact ACRE has had over the past two years.
DCP Protection
The DCP program provides price-based income support throughthe CCP and ML programs along with the fixed, guaranteed DP. The CCP program makes payments to producers when the marketing year average price of a commodity in their program base acreage falls below a trigger level. But, with trigger levels of $2.35/bushel for corn, $5.56/bushel for soybeans, $3.65/bushel for wheat and $2.39/bushel for grain sorghum, the protection from the CCP program is far below current price levels. Even with the sharp decline in projected prices from the 2012 crop marketing year to the 2013 crop marketing year, CCP protection is non-existent. The projected drop in marketing year national average prices from $6.95 to $4.90 per bushel for corn, or $14.40 to $11.35 per bushel for soybeans, for example, will still end up far above the CCP trigger levels. With LM loan rates even lower than the CCP trigger prices, the DCP program effectively provides no price protection. This was true in 2009 when the ACRE v. DCP decision was first considered, and it is even more the case today. Thus, the only expected benefit to producers from the DCP program is the fixed, guaranteed DP, which can average between $10 and $30 per base acre, based on the historical crop acreage and productivity reflected in the farm’s base acres and program yields. ACRE Protection
The ACRE program was introduced in the 2008 Farm Bill and first offered as a choice for the 2009 crop year. It substantially changed how the commodity support program worked by providing support based on average revenue levels, instead of set-in-legislation price levels. The state ACRE guarantee is calculated as 90 percent of the five-year Olympic average yield (2004-2008 for the 2009 guarantee), multiplied by the two-year simple-average price (2006-2007 and 2007-2008 marketing years for the 2009 guarantee). The farm-level guarantee is equal to the average yield, multiplied by the average price, plus the farmer-paid crop insurance premium. Both revenue guarantees must be triggered for the farm to receive an ACRE payment.
Over the 2009-2012 period, the ACRE guarantees moved every year based on updated yield and prices, but a ten percent limit on year-to-year changes to the ACRE
guarantee meant that protection fell further and further below expected revenue levels as prices continued to rise. Thus, the effective protection provided by ACRE got smaller and smaller, such that going into the 2012 season producers expected little protection from ACRE.
2012 ACRE Projections
However, the widespread drought in 2012 affected yields so much that ACRE did become significant. Originally, estimated overall yield losses looked to be compensated by price increases such that revenue might be sustained, but detailed yield data released by the United States Department of Agriculture’s (USDA) National Agricultural Statistics Service (NASS) showed the overall yield losses in corn and soybeans were almost all accruing from non-irrigated production. While irrigated production was estimated at average to above-average yields, non-irrigated corn and soybeans suffered losses in excess of 40 to 50 percent in yields per harvested acre. USDA’s Farm Service Agency (FSA) uses NASS’s harvested yield data, together with data on planted, but failed acres to estimate yields per planted acre for purposes of the ACRE program. Calculations based on currently published data from USDA-FSA are shown in Table 1 (at end of article) to update estimates of projected ACRE payments for the 2012 crop.
Farm-level ACRE payments cannot be calculated directly from the results in Table 1. The projected state ACRE payment rates for non-irrigated corn and soybeans must be multiplied by a farm-to-state productivity factor to determine the farm payment rate, and are only paid on 85 percent of the planted acres on a farm where the farm trigger was also met. In addition, the final payment rate will be determined by final marketing year price estimates not due until October 2013, and by yields per planted acre yet to be finalized by USDA-FSA.
But, the size of the projected state payment rates indicates ACRE will provide substantial revenue support for crop losses in non-irrigated corn and soybean production in 2012. The non-irrigated corn ACRE payment rate is, in fact, capped out at the limit of 25 percent of the ACRE guarantee, at $125.51 per acre. The non-irrigated soybean ACRE payment of $106.99 is within $10 of the 25 percent cap. Thus, producers can expect maximum or near-maximum payments on both non-irrigated corn and soybean acreage enrolled in ACRE for 2012.
As a result, Nebraska producers could see substantial ACRE payments in 2012. Approximately 4.3 million acres of program crops were planted on farms in Nebraska that were signed up for ACRE in 2012, according to USDA-FSA enrollment data. Of those acres, 2.7 million were planted to corn and 1.4 million to soybeans. Conservatively estimating just half of those acres were non-irrigated and eligible for ACRE payments, total ACRE payments to
Nebraska corn and soybean producers could exceed $200 million for 2012.
This number could be reduced somewhat by farm program payment caps. ACRE payments are limited to $65,000 per individual plus foregone DPs, for an effective limit of $65,000 to $73,000, depending on how many DPs were given up to sign up for ACRE. Based on projected payment rates, a producer with less than 700 planted acres of non-irrigated corn and soybeans enrolled in the ACRE program could hit the payment limit. In short, ACRE payments have gone from being virtually non-existent to potentially hitting payment limits for some producers in just one year.
2013 ACRE Projections
With the 2012 ACRE payments nearly set at this point and due in October, we can also look ahead to potential payments from the 2013 ACRE program. As in 2012, the ACRE guarantees for 2013 were limited by the ten percent cap on changes from the previous year. As a result, they were far below expected revenue levels going into the 2013 growing season, given trend yield expectations and new-crop futures price information at planting time. Table 2 (at end of article), provides up-to-date 2013 ACRE guarantee levels, as well as expected revenue levels using trend yield projections and base price calculations available back in March.
Based on ACRE guarantees and revenue expectations for 2013 as of March, the state would have had to suffer revenue losses of about 25 percent on corn, 20 percent on soybeans, more than 35 percent on wheat and more than 25 percent on grain sorghum in order to trigger any ACRE payments on the 2013 crop. Even with lingering drought concerns, it was difficult to project any revenue losses large enough to trigger ACRE payments and thus, ACRE again seemed to be of little protection for producers in 2013.
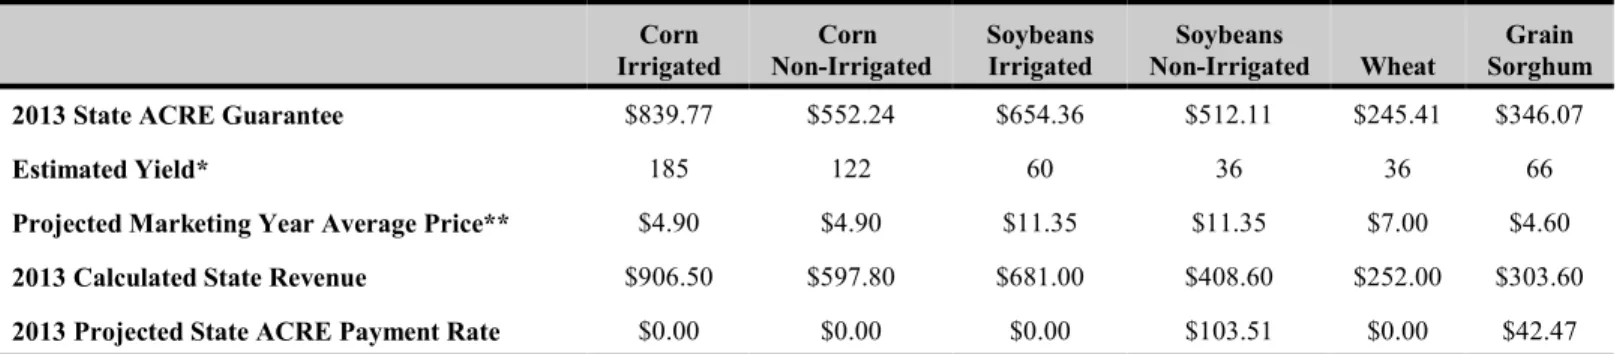
As the season has progressed, however, we have seen continuing drought concerns in much of the state, as well as significant price declines as other regions of the country recovered from the 2012 drought and nationwide crop prospects improved. As a result, revenue projections have fallen from early-season projections, so much so that ACRE again looks to be significant for a number of Nebraska crops. Table 3 (at end of article) provides an updated analysis of potential ACRE payments for the 2013 crop based on August crop production and price estimates from USDA.
Based on USDA-NASS yield estimates for overall Nebraska corn and soybean yields of 161 bushels per acre and 47 bushels per acre, respectively, and the author’s conservative estimates of irrigated yields consistent with 2012, the resulting yield estimates on non-irrigated corn and soybeans imply substantial yield losses again for
Nebraska. Non-irrigated yields of 122 bushels per acre for corn and 36 bushels per acre for soybeans would be substantially above 2012 results, but still far below trend -projected levels for 2013. Combined with substantial price declines from the 2012 crop marketing year projected for all crops, the revenue expectations for 2013 are substantially reduced. As a result, ACRE is currently projected to pay again on non-irrigated soybeans for 2013 as well as grain sorghum. And for the other crops, current revenue projections are just two to eight percent above the ACRE guarantees, suggesting any further losses in yield or price would be quickly covered by ACRE.
Summary
Enrollment data for 2013 has not yet been published by USDA-FSA, but if final enrollment is close to that of 2012, total payments under the ACRE program could again be substantial across the state. At the time 2013 enrollment began, this certainly wasn’t in the forecast. But again this year, ACRE proved to be a substantial safety net when producers were impacted by both lingering yield losses due to drought and also substantial price losses as crop production in other areas of the country recovered.
Depending on the fate of farm bill deliberations in late 2013, producers could face another new decision in 2014. If a new farm bill is completed, the farm program sign-up decision could be a choice of a new revenue-based safety net structured similar to ACRE or a revised price-based safety net, neither of which would include DPs. Or, if farm bill talks stall again and another extension of current legislation is passed, producers could see another ACRE v. DCP decision in 2014, maybe for 2014 and 2015. Given the experience of the past two years, the eventual sign-up decision will be a critical one for Nebraska crop producers.
Bradley D. Lubben, (402) 472-2235 Assistant Professor and Extension Public Policy Specialist Department of Agricultural Economics University of Nebraska-Lincoln [email protected]
Table 1. State ACRE Guarantees, Projected Revenue and Projected Payment Rates for 2012 Corn Irrigated Corn Non-Irrigated Soybeans Irrigated Soybeans Non-Irrigated Wheat Grain Sorghum 2012 State ACRE Guarantee $763.43 $502.04 $594.87 $465.55 $223.10 $314.61
Estimated Yield* 188 49 60.7 24.9 40.2 53
Projected Marketing Year Average Price** $6.95 $6.95 $14.40 $14.40 $7.77 $6.60
2012 Calculated State Revenue $1,306.60 $340.55 $874.08 $358.56 $312.35 $349.80
2012 Projected State ACRE Payment Rate $0.00 $125.51 $0.00 $106.99 $0.00 $0.00
* Estimated state yields per planted acre published by FSA as of July 2013 (yield per planted acre not published for soybeans; yield per harvested acre from USDA-NASS used as a substitute).
** Estimated national marketing year average price for 2012 projected from USDA-WAOB (World Agriculture Outlook Board) as of August 12, 2013.
Table 2. State ACRE Guarantees and Projections for 2013
Corn Irrigated Corn Non-Irrigated Soybeans Irrigated Soybeans Non-Irrigated Wheat Grain Sorghum
2012 State ACRE Guarantee $763.43 $502.04 $594.87 $465.55 $223.10 $314.61 5-Year Olympic Average State Yield* 185 132 60 44 42.8 91 2-Year National Marketing Year Average Price $6.59 $6.59 $13.45 $13.45 $7.51 $6.30
2013 Calculated State ACRE Guarantee $1,097.24 $782.89 $726.30 $532.62 $289.29 $515.97
2013 Adjusted State ACRE Guarantee** $839.77 $552.24 $654.36 $512.11 $245.41 $346.07 Expected 2013 State Yield*** 202.8 131.5 62.6 47.2 43.6 89.9 Expected 2013-2014 National MYA Price**** $5.55 $5.55 $13.27 $13.27 $8.76 $5.27 Expected 2013 State Revenue $1,125.54 $729.83 $830.70 $626.34 $381.94 $473.77
Revenue Loss to Trigger ACRE Payment 25% 24% 21% 18% 36% 27%
* Preliminary yields published by USDA-FSA.
** Adjusted guarantee based on ten percent limit on changes in 2013 guarantee from 2012 guarantee.
*** Expected 2013 yields projected from farm income and risk management research model (and similar trend analysis for grain sorghum).
**** Expected 2013-2014 prices based on insurance base prices adjusted for historical average national basis (and corn-grain sorghum ratio for grain sorghum).
Table 3. State ACRE Guarantees, Projected Revenue and Projected Payment Rates for 2013
Corn Irrigated Corn Non-Irrigated Soybeans Irrigated Soybeans Non-Irrigated Wheat Grain Sorghum 2013 State ACRE Guarantee $839.77 $552.24 $654.36 $512.11 $245.41 $346.07
Estimated Yield* 185 122 60 36 36 66
Projected Marketing Year Average Price** $4.90 $4.90 $11.35 $11.35 $7.00 $4.60
2013 Calculated State Revenue $906.50 $597.80 $681.00 $408.60 $252.00 $303.60
2013 Projected State ACRE Payment Rate $0.00 $0.00 $0.00 $103.51 $0.00 $42.47
* Estimated state yields using yields per harvested acre published by USDA-NASS in August 2013. USDA-FSA calculates ACRE payments using yields per planted acre accounting for failed (planted, not harvested) acres. Corn and soybean yields by practice estimated by the author such that the overall yield estimates would be consistent with USDA-NASS estimates.