2019
Multimodal Approach for Malware Detection
Multimodal Approach for Malware Detection
Jarilyn M. Hernandez Jimenez
West Virginia University, [email protected]
Follow this and additional works at: https://researchrepository.wvu.edu/etd Part of the Information Security Commons
Recommended Citation Recommended Citation
Hernandez Jimenez, Jarilyn M., "Multimodal Approach for Malware Detection" (2019). Graduate Theses, Dissertations, and Problem Reports. 3832.
https://researchrepository.wvu.edu/etd/3832
This Dissertation is protected by copyright and/or related rights. It has been brought to you by the The Research Repository @ WVU with permission from the rights-holder(s). You are free to use this Dissertation in any way that is permitted by the copyright and related rights legislation that applies to your use. For other uses you must obtain permission from the rights-holder(s) directly, unless additional rights are indicated by a Creative Commons license in the record and/ or on the work itself. This Dissertation has been accepted for inclusion in WVU Graduate Theses, Dissertations, and Problem Reports collection by an authorized administrator of The Research Repository @ WVU. For more information, please contact [email protected].
Multimodal Approach for Malware
Detection
Jarilyn Marie Hern´andez Jim´enez
Dissertation submitted to the
Benjamin M. Statler College of Engineering and Mineral Resources at West Virginia University
in partial fulfillment of the requirements for the degree of
Doctor of Philosophy in
Computer Science
Katerina Goseva-Popstojanova, Ph.D., Chair Vinod Kulathumani, Ph.D.
Roy S. Nutter, Ph.D. Stacy Prowell, Ph.D. Yanfang Ye, Ph.D.
Lane Department of Computer Science and Electrical Engineering
Morgantown, West Virginia 2019
Keywords: malware detection, power consumption, network traffic data, system logs, code-based static data, multimodal learning, feature level fusion, decision
level fusion
Multimodal Approach for Malware Detection Jarilyn Marie Hern´andez Jim´enez
Although malware detection is a very active area of research, few works were focused on using physical properties (e.g., power consumption) and multimodal features for malware detection. We designed an experimental testbed that allowed us to run samples of malware and non-malicious software applications and to col-lect power consumption, network traffic, and system logs data, and subsequently to extract dynamic behavioral-based features. We also extracted code-based static features of both malware and non-malicious software applications. These features were used for malware detection based on: feature level fusion using power con-sumption and network traffic data, feature level fusion using network traffic data and system logs, and multimodal feature level and decision level fusion.
The contributions when using feature level fusion of power consumption and network traffic data are: (1) We focused on detecting real malware using the ex-tracted dynamic behavioral features (both power-based and network traffic-based) and supervised machine learning algorithms, which has not been done by any of the prior works. (2) We ran a large number of machine learning experiments, which allowed us to identify the best performing learner, DC voltage rails that led to the best malware detection performance, and the subset of features that are the best predictors for malware detection. (3) The comparison of malware detection performance was done using a comprehensive set of metrics that reflect different aspects of the quality of malware detection.
In the case of the feature level fusion using network traffic data and system logs, the contributions are: (1) Most of the previous works that have used network flows-based features have done classification of the network traffic, while our focus was on classifying the software running in a machine as malware and non-malicious software using the extracted dynamic behavioral features. (2) We experimented with different sizes of the training set (i.e., 90%, 75%, 50%, and 25% of the data) and found that smaller training sets produced very good classification results. This aspect of our work has a practical value because the manual labeling of the training set is a tedious and time consuming process.
In this dissertation we present a multimodal deep learning neural network that integrates different modalities (i.e., power consumption, system logs, network traf-fic, and code-based static data) using decision level fusion. We evaluated the performance of each modality individually, when using feature level fusion, and when using decision level fusion. The contributions of our multimodal approach are as follow: (1) Collecting data from different modalities allowed us to develop a multimodal approach to malware detection, which has not been widely explored by prior works. Even more, none of the previous works compared the performance of feature level fusion with decision level fusion, which is explored in this dissertation.
(2) We proposed a multimodal decision level fusion malware detection approach using a deep neural network and compared its performance with the performance of feature level fusion approaches based on deep neural network and standard super-vised machine learning algorithms (i.e., Random Forest, J48, JRip, PART, Naive Bayes, and SMO).
Acknowledgments
Firstly, I would like to express my sincere gratitude to my advisor Dr. Katerina Goseva-Popstojanova for her continuous support during my PhD journey and for her patience, motivation, and immense knowledge. I could not have imagined having a better advisor and mentor.
I would also like to thank the rest of my dissertation committee: Dr. Vinod Kulathumani, Dr. Roy Nutter, Dr. Stacy Prowell, and Dr. Yanfang Ye for their encouragement and for the hard questions which helped me to widen my research from various perspectives.
My sincere thanks go to Dr. Jeffrey A. Nichols and again to Dr. Stacy Prowell from Oak Ridge National Laboratory for their support with the initial hardware and software configuration of the experimental machine. Also, I would like to thanks my lab mates, Lingwei Chen, Mohammad Ahmad, and Yasser Alshehri, for their valuable time when discussing ideas and for their comments which helped me to strengthened the research.
Last but not the least, I would like to thank my family: my parents, my siblings, and my grandparents for supporting me throughout writing this dissertation. I will always be grateful for everything they have done for me. Specially, I want to dedicate this dissertation to my grandma who sadly passed away while I was writing it. This is for you my sweet angel!
This work was funded in part by the National Science Foundation under the grant CNS-1618629 and by the Lane Graduate Fellowship.
v
Contents
List of Figures viii
List of Tables x
List of Abbreviations xii
1 Introduction 1
1.1 Background & Motivation . . . 1
1.2 Contributions . . . 4
1.3 Main Findings . . . 5
1.4 Dissertation Overview . . . 7
2 Background on Malware 8 2.1 What is Malware? . . . 8
2.2 Common Malware Types . . . 9
2.3 Why Cyber Criminals use Malware? . . . 11
2.4 Cyber-attacks Caused by Malware . . . 12
3 Literature Review 16 3.1 Malware Detection using Behavioral-based Features . . . 17
3.1.1 Power-based Features . . . 18
3.1.2 Network Traffic-based Features . . . 25
3.1.3 System logs-based Features . . . 29
3.2 Malware Detection Using Code-Based Static Features . . . 32
3.3 Multimodal Learning for Malware Detection . . . 35
3.3.1 Feature Level Fusion . . . 35
3.3.2 Decision Level Fusion . . . 36
4 Preliminary Experimental Set-up & Proof of Concept Study 39 4.1 Initial Experimental Set-up . . . 39
4.1.1 Hardware Configuration . . . 39
4.1.2 Software Configuration . . . 45
4.2 Data Collection & Analysis . . . 47
4.3 Preliminary Results . . . 49
4.3.1 +3.3V Rails . . . 50
4.3.3 +12V Rails on the Motherboard . . . 52
4.3.4 +12V CPU Rails . . . 55
5 Experimental Set-up & Data Collection 57 5.1 Testbed Design & Development . . . 57
5.1.1 Hardware & Software Configuration . . . 57
5.2 Data Collection Set-up . . . 58
5.2.1 Dynamic Behavioral Data Collection . . . 58
5.2.2 Code-based Static Data Collection . . . 61
5.3 Malicious and Non-malicious Applications . . . 61
5.3.1 Malicious Software Selection . . . 61
5.3.2 Non-malicious Software Selection . . . 63
6 Data Pre-processing & Feature Extraction 65 6.1 Dynamic Behavioral-based Features . . . 65
6.1.1 Power Consumption . . . 66
6.1.2 Network Traffic . . . 67
6.1.3 System logs . . . 70
6.2 Code-based Static Features . . . 71
7 Machine Learning Algorithms & Performance Metrics 75 7.1 Background on Standard Machine Learning Algorithms . . . 75
7.2 Performance Metrics . . . 77
8 Malware Detection Using Power & Network Traffic Data 79 8.1 Approach & Contributions . . . 79
8.2 Results . . . 81
8.2.1 RQ1: Learners Analysis Performance . . . 81
8.2.2 RQ2: Voltage Rail Analysis . . . 83
8.2.3 RQ3: Feature Level Fusion Using Power & Network Traffic Data . . . 84
8.2.4 RQ4: Smallest Feature Set Without Performance Degradation 86 8.3 Summary of Findings . . . 88
9 Malware Detection using Network Traffic & System Logs 89 9.1 Approach & Contributions . . . 89
9.2 Results . . . 91
9.2.1 RQ1: Network Flows-based Features Performance . . . 91
9.2.2 RQ2: Smallest Feature Set Without Performance Degradation 94 9.2.3 RQ3: Training Sets with Different Sizes . . . 96
9.3 Summary of Findings . . . 97
10 Malware Detection Using All Modalities 98 10.1 Background on Artificial Neural Network . . . 98
10.2 Background on Multimodal Learning . . . 100
Contents vii
10.2.2 Multimodal Fusion . . . 101
10.2.3 Levels of Multimodal Fusion . . . 101
10.2.4 Data Fusion Techniques . . . 103
10.3 Malware Detection Using Deep Neural Network with Decision Level Fusion . . . 104
10.3.1 Approach & Contributions . . . 104
10.4 Results . . . 108
10.4.1 RQ1: Results Using Each Modality Individually . . . 108
10.4.2 RQ2: Results for Multimodal Feature Level Fusion . . . 114
10.4.3 RQ3: Results for Multimodal Decision Level Fusion . . . 117
10.5 Summary of Findings . . . 117
11 Threats to Validity 119
12 Conclusions & Future Work 121
List of Publications 124
References 126
Appendix A All features ranked using information gain 151 Appendix B Basic Statistics of F-score for each modality
individu-ally 158
Appendix C Basic Statistics for feature level and decision level
List of Figures
2.1 System message after infecting the experimental machine with the
Locky ransomware . . . 11
4.1 USB-1608G DAQ . . . 41
4.2 Minigrabbers . . . 41
4.3 ATX connector . . . 42
4.4 First configuration . . . 42
4.5 Voltage and current sense PCB . . . 43
4.6 Second configuration . . . 43
4.7 +12V rails soldered on the same contact point in the PSU . . . 44
4.8 Third configuration . . . 45
4.9 Wires attached to DAQ . . . 45
4.10 GUI for the “DAQ Monitoring Tool” software . . . 46
4.11 Sequence of events during the data collection process . . . 49
4.12 Power consumption for idle prior to infection vs. idle after infection with Alureon for the +5V rails . . . 51
4.13 Power consumption for opening IE prior to infection vs. opening IE after infection with Alureon for the +5V rails . . . 52
4.14 Power consumption for booting prior to infection vs. booting after infection with Alureon for the +12V rails on the motherboard . . . 53
4.15 Power consumption for idle prior to infection vs. idle after infection and reboot with Alureon for the +12V rails on the motherboard . . 54
4.16 Power consumption for opening IE prior to infection vs. opening IE after infection and reboot with Alureon for the +12V rails on the motherboard . . . 54
4.17 Power consumption for opening IE prior to infection vs. opening IE after infection with Alureon for the +12V CPU rails . . . 56
5.1 Experimental set-up . . . 58
8.1 Mean F-score & mean G-score for each learner using only power-based features for the +12V CPU rails . . . 82
8.2 Mean F-score & mean G-score for each learner using only commonly used network traffic-based features . . . 82
List of Figures ix
8.3 Box plots of the Random Forest performance metrics for each of the monitored voltage rails . . . 83 8.4 Box plots of Random Forest performance using only power-based
features from +12V CPU rails, only commonly used network traffic-based features, and combined set of features . . . 84 9.1 Box plots of the learners performance metrics for the baseline feature
vector . . . 92 9.2 Box plots of the learners performance metrics for all features . . . . 92 10.1 Deep neural network architecture for decision level fusion . . . 105 10.2 Box plots of the learners performance metrics for the power-based
features . . . 110 10.3 Box plots of the learners performance metrics for the network
traffic-based features . . . 111 10.4 Box plots of the learners performance metrics for the system
logs-based features . . . 112 10.5 Box plots of the learners performance metrics for the code-based
static features . . . 113 10.6 Box plots of the learners performance when doing feature level fusion115
List of Tables
3.1 Most relevant works that used power-based features . . . 20
3.2 Most relevant works that used network traffic-based features . . . . 28
3.3 Most relevant works that used system logs-based features . . . 31
4.1 Voltage rail usage for a general-purpose computer . . . 41
5.1 Malicious applications chosen for the experiments . . . 62
5.2 Non-malicious applications chosen for the experiments . . . 64
6.1 List of extracted power-based features . . . 67
6.2 List of extracted commonly used network traffic-based features . . . 68
6.3 List of extracted network flows-based features . . . 69
6.4 List of extracted system logs-based features . . . 71
6.5 List of extracted headers-based features . . . 73
6.6 List of extracted data directories-based features . . . 73
6.7 List of extracted DLL dependencies-based features . . . 74
7.1 Name and type of each learner used for this work . . . 76
8.1 Basic statistics for power-based features . . . 86
8.2 Basic statistics for network traffic-based features . . . 86
8.3 Power-based and commonly used network traffic-based features ranked using information gain . . . 87
9.1 Basics Statistics of G-score . . . 93
9.2 Basic Statistics of F-score . . . 93
9.3 Network traffic-based and system logs-based features ranked using information gain . . . 95
9.4 J48 and PART performance on training sets with different sizes . . 96
10.1 Mean learners performance for each modality individually . . . 109
10.2 Mean learners performance for feature level and decision level fusion 115 A.1 All features ranked using information gain . . . 151
B.1 Basics Statistics of F-score using power-based features . . . 158
List of Tables xi
B.3 Basics Statistics of F-score using system logs-based features . . . . 159
B.4 Basics Statistics of F-score using code-based static features . . . 159
C.1 Basics Statistics of Accuracy . . . 160
C.2 Basics Statistics of Recall . . . 161
C.3 Basics Statistics of Precision . . . 161
C.4 Basics Statistics of G-score . . . 161
C.5 Basic Statistics of F-score . . . 162
List of Abbreviations
AC Alternate Current
ACF Autocorrelation Function AGP Accelerated Graphics Port ANN Artificial Neural Network
API Application Programming Interface ATX Advanced Technology eXtended AV Anti-Virus
CFG Control Flow Graphs COS Cosine Similarity
CNN Convolutional Neural Network CPI Cycle Per Instruction
CPU Central Processing Unit CSV Comma-Separated Value DAQ Data Acquisition System DC Direct Current
DDoS Distributed Denial of Service DIMM Dual Inline Memory Module
DKOM Direct Kernel Object Manipulation DLL Dynamically Linked Library
DNS Domain Name System DoS Denial of Service
EPROM Erasable Programmable Read-Only FN False Negatives
FP False Positives FDR False Detection Rate
List of Abbreviations xiii
FPR False Positive Rate GPU Graphics Processing Unit
HIDS Host-Based Intrusion Detection System IAT Import Address Table
ICS Industrial Control System IDS Intrusion Detection System IQR Interquartile Range
IRC Internet Relay Chat
ISA Industry Standard Architecture LDA Linear Discriminant Analysis LKM Loadable Kernel Module mA Milliampere
MBR Master Boot Record
MFCC Mel Frequency Cepstrum Coefficient
NIDS Network-Based Intrusion Detection System OCP Overcurrent Protection
OS Operating System P2P Peer-to-Peer
PC Personal Computer
PCA Principal Component Analysis PCAP Packet Capture
PCB Print Circuit Board
PCI Peripheral Computer Interface PCIe PCI Express
PDA Personal Digital Assistant PE Portable Executable PFP Power Fingerprinting
PLC Programmable Logic Controller POS Point of Sales
PSU Power Supply Unit ROM Read Only Memory RBF Radial Basis Function
RNN Recurrent Neural Network
SCADA Supervisory Control and Data Acquisition SDR Software Defined Radio
SIMM Single Inline Memory Module SSD Sum of Square Distance
SSDT System Service Descriptor Table SVM Support Vector Machine
TLS Thread Local Storage TN True Negatives
TP True Positives
URL Uniform Resource Locator
1
Chapter 1
Introduction
1.1
Background & Motivation
Malware is a malicious software that is developed and propagated by cyber crimi-nals to launch a wide range of security attacks, such as stealing confidential data, hijacking devices remotely to deliver massive spam emails, launching denial of service attacks, identity theft, and so on [254]. A recent study [235] showed the average time to resolve a malicious attack is fifty days and the average time to resolve a ransomware attack is twenty three days. Moreover, the financial con-sequences of cyber-attacks are worsening [235]. In order to protect the computer systems against the evolving threat malware poses, malware detection is imperative to both anti-malware industry and users.
Typically, malware uses polymorphic techniques to avoid detection. Polymor-phic malware can bypass current detection methods by slightly changing the in-structions of an existing malware sample. These new malware instances are called
variants. Although these variants appear to be different programs from the view-point of anti-virus (AV) software, they exhibit similar functionality to their prede-cessor. Consequently, these new malware variants can bypass traditional detection methods until a pattern-matching for them can be identified and incorporated into the detection system.
These techniques include two stages: feature extraction and classification. For data collection and feature extraction, there are two methods used in the malware detection research area: static and dynamic [300]. The static methods extract features based on the analysis of the binary code of malware examples without executing the malware. On the other side, dynamic methods require the execu-tion of a given malware example, typically in a sandbox environment [305, 275], and extract behavior-based features that represent the actions performed by the malicious software.
Both static (code-based) and dynamic (behavioral-based) feature extraction methods have their own advantages and disadvantages. Static methods contains very useful information from the binary code and are easy to extract, but they are prone to obfuscation techniques, which are commonly used by polymorphic malware [270], and attacks based on packer-based encryption [116]. In the case of dynamic methods, the main advantage is that they reflect the runtime behavior of a program which is hard to obfuscate [286, 65], but the data collection process is time and resource consuming [283, 143].
With respect to malware detection, nowadays it is typically conducted via the implementation of machine learning methods. The basic idea behind machine learning is to train a model based on a specific algorithm to perform the classifi-cation (i.e., classify between malware and non-malicious software). The training of the algorithm is done based on the input dataset, and the model that is built is subsequently used to make classifications. The performance of malware detection approaches depends critically on both the extracted features and the classification techniques.
Considering the limitations of static and dynamic methods, in this dissertation we explore the effectiveness of using different modalities for malware detection. Our dataset was created by using features from multiple sources (i.e., code-based static data, power consumption, system logs, and network traffic data). Each of these sources is called amodality [79].
Chapter 1. Introduction 3
collect the dynamic behavioral data we used our testbed [171]. The power con-sumption, system logs, and network traffic data were collected while the malware and non-malicious applications ran separately, in a controlled sandbox environ-ment, on the experimental machine. Thus, based on the place of analysis our approach belongs to the commonly used remote server/cloud detection approach (e.g., [305, 275, 300]). Power data was collected by using a Data Acquisition Sys-tem (DAQ) which measured the power consumption from four different voltage rails (+3.3V, +5V, +12V on the motherboard, and +12V CPU rails). System logs were collected using CaptureBAT [32] and the network traffic data was collected using Wireshark [42].
For our experiments we selected examples of recent malware with different traits, such as viruses, worms, trojans, backdoors, rootkits, and ransomware. In the case of the non-malicious software, we used some applications that are network intensive and other that are CPU and memory usage intensive. Compared to datasets from previous works [91, 201] which included power-based features for malware detection, our dataset is the largest. Bridges et al. [91] used five malware examples and Luckett et al. [201] used four malware examples, while here we are using fifty one malware examples and twenty two non-malicious applications.
With respect to the classification stage of malware detection, we used the su-pervised machine learning approach. To classify any unknown file, which could be malicious or non-malicious, the classification process has two steps: model construction (i.e., training) and model usage (i.e., testing). In the training step, samples of labeled (i.e., known) malware and non-malicious software are provided to the system and the feature vectors are extracted. Both the feature vectors and the class label (i.e., malicious or non-malicious) are used to build a classification model (or a classifier). During the model usage phase (i.e., testing), the classifier generated in the training phase is used to classify a new collection of previously not seen applications, which could be either malicious or non-malicious.
When multiple sources are integrated to perform an analysis the task is referred to as multimodal fusion [74]. Two levels of multimodal fusion exist: feature level
and decision level. Feature level (also known as early fusion) is the most widely used approach as it fuses all the extracted features into one feature vector, while decision level fusion (also known as late fusion) fuses multiple modalities in the semantic space [74].
1.2
Contributions
The contributions of this dissertation can be summarized as follows:
• We developed a testbed [171], which was used to collect power consump-tion, network traffic data, and system logs when running samples of malware and non-malicious software applications. Power data was collected by using a Data Acquisition System (DAQ) which measured the power consumption from four different voltage rails, while the system logs were collected using CaptureBAT [32], and the network traffic data was collected using Wire-shark [42].
• In addition to dynamic behavioral-based features (i.e., power-based features, network traffic-based features, and system logs-based features) we extracted code-based static features (i.e., headers-based, data directories-based, and DLL dependencies-based features), which are typically used for malware de-tection.
• With respect to power consumption-based features, we identified the best performing DC voltage rails that led to the best malware detection per-formance. Our dataset is the largest when we compared it to prior works [91, 201] that used power-based features for malware detection.
• Most of the previous works that have used network flows-based fea-tures [124, 120, 98, 61, 316, 73, 289, 117, 125, 84, 308, 204, 148, 149] have done classification of the network traffic, while in this dissertation we focused on classifying the software running in a machine as malware and non-malicious
Chapter 1. Introduction 5
software using the extracted code-based static and dynamic behavioral-based features.
• We explored feature selection using information gain and identified the small-est number of features sufficient to distinguish malware from non-malicious software [156, 171]. We also experimented with different sizes of the train-ing set (i.e., 90%, 75%, 50%, and 25% of the data) and found that smaller training sets produced very good classification results [171]. This aspect of our work has a practical value because the manual labeling of the training set is a tedious and time consuming process.
• Collecting data from different sources allows us to develop a multimodal ap-proach to malware detection, which has not been widely explored by the prior works. Exceptions are [193, 184]. Kumar et al. [193] used two modal-ities and Kim [184] divided the code-based static features into 7 feature vectors, and used each of them as an individual modality. Both of the prior works [193, 184] monitored mobile devices, while here we monitored a general-purpose computer. None of these works compared the performance of feature level with decision level fusion, which is explored in this dissertation.
• We proposed a multimodal decision level fusion malware detection approach using a deep neural network. We compared its performance with the perfor-mance of feature level fusion approaches based on deep neural network and standard supervised machine learning algorithms (i.e., Random Forest, J48, JRip, PART, Naive Bayes, and SMO). Kim et al. [184] used only code-based static features, while we are combining behavioral-based with code-based static features.
1.3
Main Findings
We first experimented with power consumption and network traffic data and used ten supervised machine learning algorithms (i.e., J48, Random Forest, Random
Tree, OneR, Naive Bayes, JRip, PART, Multilayer Perceptron, SMO, and Decision Table) for classification. The main findings include: (1) Among the best performing learners, Random Forest had the highest F-score and close to the highest G-score. (2) Power data extracted from the +12V CPU rails led to better performance than power data from the other three voltage rails. (3) Using only power-based features provided better performance than using only network traffic-based features; using both types of features had the best performance. (4) Feature selection based on information gain was used to identify the smallest numbers of features sufficient to successfully distinguish malware from non-malicious software. The top eleven features provided the same performance as using all 25 features. Five out of seven power-based features were among the top eleven features.
We also experimented with network traffic data and system logs by evaluat-ing four supervised machine learnevaluat-ing algorithms (i.e., J48, Naive Bayes, Random Forest, and PART) for malware detection and identified the best learner. Further-more, we used feature selection on information gain to identify the smallest number of features needed for classification and experimented with different training sets of different sizes. The main findings include: (1) Adding network flows-based fea-tures improved significantly the performance of malware detection. (2) J48 and PART were the best performing learners, with the highest F-score and G-score values. (3) Using J48, the top five features ranked by information gain attained the same performance as when using all 88 features. In the case of PART, the top fourteen features ranked by information gain led to the same performance as when all 88 features were used. None of the system logs-based features were included in these two models. (4) The classification performance when training on 75% of the data was comparable to training on 90% of the data. As little as 25% of the data can be used for training at an expense of somewhat higher, but not very signifi-cant performance degradation (i.e., less than 7% for F-score and 6% for G-score compared to when 90% of the data were used for training).
In addition, we explored the effectiveness of integrating all four modalities (i.e., power consumption, network traffic data, system logs, and code-based static data)
Chapter 1. Introduction 7
for malware detection by using a deep learning neural network. To evaluate the performance of our multimodal approach, we conducted various experiments. We compared the performance of our multimodal fusion approach with each modality individually and to other learners (i.e., Random Forest, J48, JRip, PART, Na¨ıve Bayes, and SMO) when using feature level fusion. Furthermore, we compared the performance of our deep learning neural network when using feature level and decision level fusion. The main findings include: (1) When using multimodal feature level fusion, the performance of the deep neural network was worse than Random Forest, J48, JRip, PART, Naive Bayes, and SMO. (2) Using deep learning neural network for multimodal decision level fusion outperformed these standard supervised machine learning algorithms.
1.4
Dissertation Overview
The rest of this dissertation is organized as follows: Chapter 2 provides a detailed background on malware. Chapter 3 presents a literature review on existing malware detection methods that used similar code-based static and dynamic behavioral-based features, and includes the state of the art with respect to multimodal fusion. Chapter 4 describes the preliminary experimental set-up and presents a proof of concept study that shows the feasibility of our testbed. Chapter 5 explains the modifications done in the experimental set-up to collect simultaneously data from multiple modalities and explains the malicious and non-malicious software selec-tion. Chapter 6 explains the data pre-processing and feature extraction process. A description of the used supervised machine learning experiments and perfor-mance metrics is given in Chapter 7. The conducted machine learning experiments when combining the power-based and network traffic-based features is described in Chapter 8, while the experiments when combining network traffic-based and sys-tem logs-based features is given in Chapter 9. Our multimodal malware detection approach and results are described in Chapter 10. Threats to validity are given in Chapter 11. The conclusion and future work are presented in Chapter 12.
Chapter 2
Background on Malware
This chapter defines what is malware, describes the common malware types, explains why cyber criminals use malware, and provides several examples of cyber-attacks that were caused by malware.
2.1
What is Malware?
The term malware is a combination of the words malicious and software. Mali-cious software is any software that is used to disrupt the operations of a machine, to gather sensitive data, or gain access to private computer systems [50, 254]. Malware is created by cyber criminals with the objective of achieving particular goals. These goals can include stealing confidential data, harvesting logins and passwords, sending spam emails, launching denial of service attacks (DoS), and extortion or identity theft [254]. An example is the malware calledCryptoLocker, which has been and is still used by cyber criminals to infect and encrypt all the files on the computer, so that they can later ask for a ransom in order to decrypt these files [34].
Chapter 2. Background on Malware 9
2.2
Common Malware Types
Malware can fall into many different categories, depending on the method of trans-mission, its mechanism of operation and what actions are taken once it gains a foothold [179]. Most common malware types are: viruses, worms, trojans, back-doors,rootkits, andransomware. A computer virus is a piece of code that typically needs human action to spread itself into one or more files and then performs some action [87].
A worm is a program that copies itself from one computer to another [87]. The difference between a virus and a worm is that a worm spreads on its own through the network, that is, a worm does not need human action to spread [41]. Most of the time, worms cause at least some harm to the system network while viruses typically corrupt or modify files on a targeted computer [45].
A trojan horse is a malicious computer program which has a hidden function-ality and typically misrepresents itself as useful, routine, or interesting in order to persuade a victim to install it [53]. A difference between a virus, a worm, and a trojan is that trojans do not attempt to inject themselves into other files or oth-erwise propagate themselves [1]. Typically, backdoors are left after using a trojan or a worm. As the name implies, backdoors, open a “backdoor” into a computer with the objective of leaving a network connection for the cyber criminal or other malware to enter the system or to spread spam [36]. In other words, a backdoor is a type of malware that consists of a method for bypassing normal authentication or encryption in a computer system [44, 31]. Furthermore, many trojan’s payload act as a backdoor by contacting a controller which can then have unauthorized access to the affected system [53]. In the context of malware, a payload refers to the portion of the malware which performs the malicious action(s) [39].
A well-known malware type are rootkits. Rootkits are a “kit” consisting of small and useful programs that allow an attacker to escalate to maximum priv-ileges [159]. Rootkits are designed to hide the existence of certain processes or programs from normal methods of detection and enable continued privileged
ac-cess to a computer [206]. Typically, a rootkit has three goals: run, hide, and act [274]. Rootkits run other malware on the target machine without restrictions to avoid detection by an anti-virus (AV) or other security tools, and to get infor-mation (e.g., user’s passwords) from the compromised computer. They work by using a basic concept called modification. Essentially, a rootkit locates and modi-fies the software with the purpose of changing the software behavior. An example of a type of modification that can be made by a rootkit is patching, which is a technique that modifies the data bytes encoded in a executable code [159].
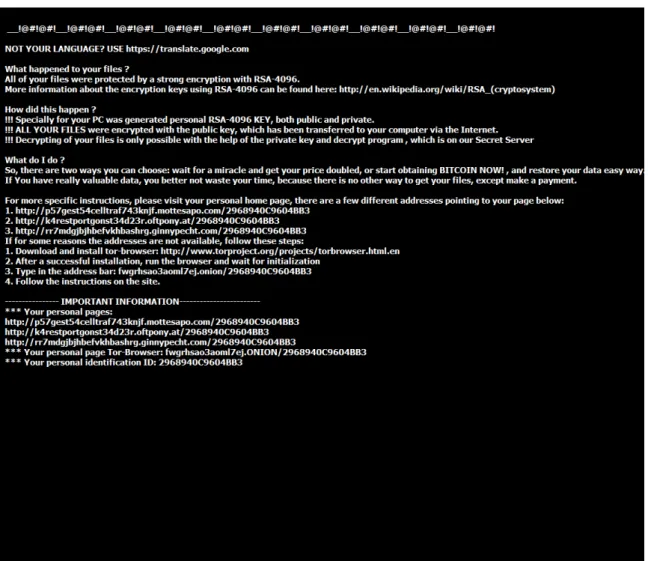
While a rootkit hides from detection, a ransomware (also known as crypto-virus, crypto-trojan or crypto-worm) threatens to publish the victim’s data or perpetually block access to it unless a ransom is paid. Ransomware attacks are often carried out by using trojans [53]. Typically, a ransomware encrypts all the files of the victim’s system and then demands a ransom payment in return for the decryption key which is required to decrypt the encrypted files [59]. Most of the time they are installed in the system through a malicious email attachment, an infected software download, or by visiting a malicious website or Uniform Resource Locator (URL). Once the system is infected with ransomware, the user’s files are encrypted, and/or the user is restricted from accessing the computer’s main features. Some ransomware-based applications disguise themselves as an authority figure (e.g., a police or a government agency such as the Federal Bureau of Investigation or the Department of Defense) claiming that the user’s system was locked down for security reasons and that a ransom or a fee is required to reactivate it [280]. The ransom message usually includes instructions on how to pay the ransom (most of the time is either through credit card or bitcoins). Ransom amounts range from one hundred dollars to several thousand dollars [281]. Figure 2.1 shows the message that appeared after we executed the Locky [49] ransomware on the experimental machine.
Chapter 2. Background on Malware 11
Figure 2.1: System message after infecting the experimental machine with the Locky ransomware
2.3
Why Cyber Criminals use Malware?
There are many ways in which cyber criminals use malware. For instance, mal-ware authors are increasingly taking advantage of the trust that exists between users and software providers to inject malware on these updates, thus potentially infecting the users through trusted official software distribution channels. A report by FireEye iSIGHT Intelligence stated that at least there were five cases in which malware authors compromised software providers [136].
effectiveness in achieving their goal (e.g., gaining access to the system) and be-cause, at least in the case of rootkits, they can hide to avoid detection by using modification techniques that are hard to detect. Most of the time cyber criminals installed the rootkits once they have obtained root or administrative access to the system. Obtaining root or administrative access to a system is a result of a di-rect attack on the system. An example of didi-rect attack is when a cyber criminal gains full control over a system by exploiting a known vulnerability or a password. Full control over a system means that existing software can be modified, including software that might be used to detect malware.
In the case of a ransomware, cyber criminals use them as a convenient payment system because it is hard to trace. Hence, they use them to commit financial fraud and extort money from computer users. However, not every type of ransomware will demand a cryptocurrency (digital currency that uses encryption techniques such as bitcoins) payment. For example, some types of ransomware demand a gift card code or other anonymous online payment option [94]. Examples of the most common payments methods for ransomware are wire transfers, premium-rate text messages, pre-paid voucher services (e.g. Paysafecard), and bitcoins [40].
Overall, cyber criminals use malware to steal passwords or network bandwidth, or to install other malicious software [274], and to gain and maintain unauthorized access to a system. By gaining unauthorized access to a system, the cyber crim-inals can obtain privileges to access sensitive data and conceal its own existence. Furthermore, a cyber criminal could use any type of malware that has rootkit ca-pabilities to hide other malware types. Malware hidden by rootkits often monitor, filter, and steal data, or could abuse the computer’s resources [27].
2.4
Cyber-attacks Caused by Malware
A cyber-attack refers to any act or attempt, successful or unsuccessful, to gain unauthorized access to, disrupt or misuse a Licensee’s electronic systems or infor-mation stored on such systems [12]. Not all cyber-attacks are caused by malware,
Chapter 2. Background on Malware 13
they could also be caused by exploits (a vulnerability in the system) or by other types of attacks such as a DoS (a type of attack in which the cyber criminal seeks to make a machine or a network resource unavailable to its intended users by temporarily or indefinitely disrupting services of a host that is connected to the Internet). However, in this section we focus on those cyber-attacks that were caused only by malware.
A well-known cyber-attack caused by malware is Stuxnet. Stuxnet is a worm with rootkit capabilities that was first uncovered in 2010 [282]. Stuxnet has three modules: a worm that executes all routines related to the main payload of the at-tack; a link file that automatically executes the propagated copies of the worm; and a rootkit component responsible for hiding all malicious files and processes [285]. It was introduced to the target environment via an infected USB flash drive. Once the machine was infected, the malware spread across the network scanning for Siemens Step-7 software on computers controlling a Programmable Logic Con-troller (PLC) [282]. This worm subverts the Step-7 software application that was used to reprogram these devices. This worm collected information on industrial control systems (ICS) and caused the fast-spinning centrifuges to tear themselves apart [195]. Siemens stated that the worm did not cause any damage to its cus-tomers, but it is believed that the Iran nuclear program was damaged by this cyber-attack [4, 203]. A report by Symantec showed that 60% of the infected computers worldwide were located in Iran [102, 135, 83].
In addition, a nuclear power plant in Russia was also infected by this worm. However, since the power plant was not connected to the public network, the sys-tem remained safe [267]. Like Stuxnet there are many malware that has targeted and keep targeting industrial control systems. Some examples are Shamoon [115] and Dragonfly [13, 257]. However, to this day the latter has not been used to attack ICS. Rather it has been used for counterfeiting [13] and cyber espionage purposes [257]. Even though these cases affected mainly countries that are not the United States (US), is imperative to be aware of them since the critical infrastruc-ture of the US could be affected by similar threats.
Furthermore, there have been cyber-attacks that targeted other systems as well. Some of the biggest data breaches happened to companies such as Target,
The Home Depot, and Anthem. In the case of Target, cyber criminals installed malicious software on the point of sales (POS) systems in the self-checkout lanes from nearly 2,000 Target stores [255]. The objective of the cyber-attack was to gain access to customer credit and debit card numbers. This malware compromised the identities of 70 million customers and 40 million credit and debit cards [255, 276]. The same malware was later used to target The Home Depot [256]. On the other hand, Anthem (a health insurance plan provider) was a victim of cyber criminals when they stole approximately 80 million of medical records [276]. The attack began with phishing emails that were sent to Anthem’s employees and it did not became successful until some of these employees were tricked and downloaded a trojan with a keylogger capability that enable the cyber criminals to acquire the passwords for accessing the unencrypted data.
In addition, there has been malware that targeted regular users (people that use general-purpose computers from the comfort of their home). Some examples of these malware are Alureon and GameOver Zeus. Alureon, also known as TDL, is a trojan with rootkit capabilities that was first discovered in 2008. It was created to steal data by intercepting a system’s network traffic and whose objective was to search for personal information such as banking usernames and passwords, credit card data, social security numbers and other sensitive user data. It was not until 2012 in which a new variant of this malware was discovered. Like its predecessor, it was used to steal personal information from its victims by redirecting them away from trusted websites. The number of computers that probably were infected was more than 277,000 worldwide, but the FBI believes that about 64,000 computers were infected only in the United States [294].
Similarly, GameOver Zeus (GOZ), a variant from the Zeus trojan was used by cyber criminals to send spam and phishing messages, to participate in Distributed Denial of Service (DDoS) attacks, and harvest banking information, such as login credentials, from a victim’s computer [292, 11]. As many as 1.2 million computers
Chapter 2. Background on Malware 15
were infected with this trojan prior to the takedown of the Zeus malware [186]. More examples of malware that targeted general-purpose computers can be found in Chapter 5. Particularly, Table 5.1 lists the malware examples that were chosen for our experiments.
Chapter 3
Literature Review
Malware is a malicious software that is developed by cyber criminals in or-der to steal confidential data, hijack devices remotely to deliver massive spam emails, launch denial of service attacks and so on. Typically, they avoid detection by constantly changing the program’s appearance while keeping its functionality the same. This malicious behavior is attained by manipulating the code using multiple obfuscation techniques, such as inserting junk code and reordering in-structions [247].
Lately, many authors of malware detection systems have attempted to address this problem by using different detection approaches, such as byte frequency [312], byte randomness [237], and behavioral patterns identified in the binary code of malware examples (i.e., behavioral analysis) [229, 154, 65, 283, 133]. The byte frequency of software refers to the frequency of the different unsigned bytes in the corresponding file, byte randomness refers to the bytes distribution value of the instruction sequences that are obtained from randomness tests, and behavioral analysis refers to the type of analysis that identifies the actions performed by the malware rather than their binary code patterns.
Next we provide an overview about previous works that have used code-based static and dynamic behavioral-based features, as well as those previous works that have used multimodal fusion techniques for their classification.
Chapter 3. Literature Review 17
3.1
Malware Detection using Behavioral-based
Features
The evolving evasion techniques being used by malware writers led to the usage of dynamic behavioral-based features for detection of malicious software [143]. Extracting behavioral-based features involves the execution of the PE file in a controlled environment (e.g., virtual machine and sandbox) [143]. Some types of dynamic behavioral-based features include function call monitoring, function parameter analysis, information flow tracking, and instruction traces [128, 143].
In addition, there are several online automated tools that helps to collect be-havioral data from malware and non-malicious software. Some examples of such tools are CWSandbox [293], TTAnalyzer [82], Cuckoo sandbox [30], and Payload Security [26]. The behavioral reports generated by these tools helps malware an-alysts to understand the malware behavior and provide valuable insight into the actions performed by them. Some details to consider when extracting dynamic behavioral-based features are: (1) each malware example should be executed within a secure environment for a specific time to ensure malware examples behave as in-tended [270]; (2) a secure environment is different from a real runtime environment as the malware may behave differently on each of these environments, leading to inaccurate behavior [128]; and (3) some actions of the malware example may only be activated or triggered under certain conditions (e.g., system date and time or direct input from the user) [167].
Compared to code-based static features, dynamic behavioral-based features are more costly. However, dynamic behavioral-based features are more resilient to obfuscation techniques because they extract behavior actions performed by the malware rather than their binary code patterns. All dynamic behavioral-based features vary in the execution environment for the malware and analysis granular-ity. For example, a debugger (e.g., GDB [200] and WinDbg [244]) can be used for fine-grained analysis of binary code at the instruction level and other tools, such
as Detours [162], CWSandbox [293], TTAnalyzer [82], Cuckoo sandbox [30], and Payload Security [26], run the malware example in a controlled environment and monitor its behavior.
The behavior of a software application, including a malicious application, can be characterized by its system and network activities, as well as by the analysis of its physical properties (e.g., power consumption). Although malware detection is a very active area of research [165, 275, 305] and dynamic behavioral-based features has been used widely [229, 154, 65, 283, 133, 300], few works were focused on using physical properties, such as power consumption. In this dissertation we extracted dynamic behavioral-based features from the power consumption, network traffic data, and system logs.
3.1.1
Power-based Features
Monitoring power consumption has been explored by previous works for the de-velopment of new approaches to help with energy efficiency [164, 189, 134, 144, 147, 233, 219], energy theft [103, 207], and to help for integrity assessment [132]. However, for these approaches power consumption was monitored for a different purpose than malware detection. For instance, power consumption was monitored to help data centers understand how much power was used among the running ap-plications across the network (in case of servers) [164, 189, 134, 144, 147], to extend the life of the cellphone’s battery (in case of mobile devices) [233], to prevent en-ergy theft on embedded devices [103, 207], and to improve the power consumption on house appliances [219].
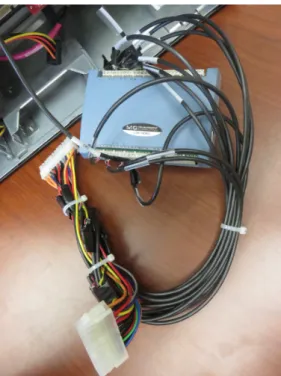
From these power-based approaches [164, 189, 134, 144, 147, 233, 219, 103, 207, 132], the work by Feng et al. [134] is the most relevant to our work as they used a similar hardware configuration to collect power consumption data. Like us, they used an ATX extender cable to attach the power supply unit (PSU) of the nodes to a sensor resistor on the circuit board. Specifically, they used a RadioShack 46-range digital multimeter (manufacturer part number 22-812) that led to a sampling rate
Chapter 3. Literature Review 19
of 0.25 (i.e., four samples per second). Similarly, the work by Dawson et al. [114] used a multimeter and current clamp, which limited the sampling rate to 1Hz for the collection of power consumption data on a general-purpose computer for malware detection. While these works used a multimeter, our testbed used a data acquisition system (DAQ) with a sampling rate of 0.01 second (i.e., one sample every 10 milliseconds). Thus, in comparison to the work by Feng et al. [134] and Dawson et al. [114], our testbed provides fine grain power consumption data.
The following subsections discusses related works that have used power-based features for malware detection. These works focused on specific devices, such as mobile devices [158, 313, 303, 77, 122, 123, 303, 169], embedded devices [108, 155, 107, 212], software defined radio [63, 64, 62, 62, 242], and general-purpose computers [114, 91, 201].
A comparison of the most relevant works that have used power-based features is given in Table 3.1. Note that the main difference among the prior works that used power-based features is with respect to what was classified. Some works classified sub-segments of the power consumption data as malicious or non-malicious [77, 63, 242, 62, 114], distinguished malicious from non-malicious operations (i.e., turning the pump on/off [62, 108] or turning the lights of PLC on/off [155]), and carried on malware detection (i.e., classified the unknown applications to malware and non-malicious software) [158, 303, 91, 201].
3.
Literature
Review
20
software
[303] M Yes St GMM malware vs. non-malicious software
remote servers N/A NR, PR, A
[77] M Yes ML-S DTW, KNN malicious vs. non-malicious sub-segments
remote servers N/A A, R, P, F [169] M Yes St correlation malware vs. non-malicious
software
remote servers N/A Approach was not evaluated. [108] ED Yes ML-S 3-NN, MLP, RF malware vs. normal operations remote servers mean, var, max, min,
skew, Kurt, RMS, IQR
mean of A, P, R
[155] ED No O N/A cyber-attacks vs. normal
operations
N/A N/A N/A
[212] ED O No N/A buffer overflow attacks
vs. normal operations
N/A N/A N/A
[63] SDR Yes St correlation malicious vs. non-malicious sub-segments
remote servers N/A Approach was not evaluated. [242] SDR No O correlation malicious vs. non-malicious
sub-segments
remote servers N/A Approach was not evaluated.
[62] SDR Yes AD spectral
periodogram
malicious vs. non-malicious sub-segments
remote servers N/A Approach was not evaluated. [114] PC Yes AD non-linear phase
space algorithm
malicious vs. non-malicious sub-segments
remote servers max, min, mean Approach was not evaluated. [91] PC Yes AD,ML-S ensemble learning,
SVM
malware vs. non-malicious software
remote servers mean, var, DSD, skew, L2Norm, Kurt, and permutation entropy
R, FDR
[201] PC Yes ML-S nested network malware vs. non-malicious software
remote servers N/A mean A, AUC
Table description for each column that has abbreviations:
•Devicecolumn: M = mobile; ED = embedded device; SDR = software-defined radio; and PC = general-purpose computer
•Techniquecolumn: O = observations; St = statistic-based ; ML-S = supervised machine learning; and AD = anomaly detection
Chapter 3. Literature Review 21
Mobile Devices
Before smartphones arrived to the market, previous works explored if cyber-attacks could be detected on personal digital assistants (PDAs) by monitoring its power consumption [168, 182, 93]. Later, with the arrival, popularity, and usability of smartphones they became the perfect target for cyber-attacks (e.g., malicious code) [300].
Malware detection approaches based on power consumption for mobile devices showed inconsistent results. The approach proposed by Hoffman et al. [158] was not successful due to the noise caused by unpredictable factors, such as user interaction and the strength of the mobile signal. On the other hand, the methods proposed by Yang et al. [303] and Zefferer et al. [313] were able to detect malware by monitoring the power consumption of smartphones. A recent work presented by Azmoodeh et al. [77] demonstrated that a specific type of malware, ransomware, can be detected on Android devices by monitoring only the power consumption.
Furthermore, the works by Dixon et al. [122, 123] explored the effectiveness of detecting malicious code by combining the mobile power profiles with user’s location [122], while an extended version of this work [123] integrated time as a feature. Results on both works demonstrated the effectiveness of these features for finding malware with a low false positive rate and a little impact to the battery life of smartphones.
Even though these works [77, 122, 123, 158, 303, 313] were able to detect malware by using power consumption as a feature, it is important to note that all of them used software-based monitoring (i.e., the PowerTutor tool) to collect the power consumption data, which may distort the power profiles and/or be affected by successful malicious attacks. An exception is the work by Robin et al. [169] which built their own testbed using a Monsoon power meter for the acquisition of power consumption data. Although preliminary results were promising in detecting malware from non-malicious applications, the development and validation process were not completed.
Embedded Systems
Several approaches have been proposed to detect malware targeting embedded de-vices (i.e., dede-vices with a dedicated function within a larger mechanical or electrical system) [107, 108, 155, 212].
The work by Clark et al. [108] explored whether power consumption could be used to detect the presence of malware on two embedded devices, an embed-ded medical device and a pharmaceutical compounder (i.e., an industrial-control workstation). They monitored the alternate current (AC) outlet and showed that malware can be detected based on the power consumption of embedded devices us-ing supervised machine learnus-ing algorithms. Same author (Clark et al.) presented in [107] two case studies in which it was proved that AC power traces can be both harmful to privacy and beneficial for malware detection, the latter of which may be beneficial for embedded devices (i.e., medical devices). However, the main issue when monitoring AC relies on periodic changes in the current direction, which leads the voltage to reverse itself, making the analog circuits much more susceptible to noise. To avoid this problem, we monitored the direct current (DC) channels, as some other prior works [158, 303, 77, 63, 242, 62, 114, 155, 91, 201].
Similarly, our previous work [155] presented a proof of concept study which demonstrated through observations based on illustrative examples that cyber-attacks can be detected by monitoring the power consumption of a Programmable Logic Controller (PLC). Power consumption data was collected using a data ac-quisition system (DAQ), but the hardware configuration was different than the one used in this dissertation. The main difference relies on the sensors that were attached to the DAQ, since the maximum voltage for the PLC rails were +24V and here our testbed monitored four voltage rails (i.e., +3.3V rails, the +5V rails, the +12V rails on the motherboard and the +12V rails on the CPU) whose max-imum value is +12V. Moreover, for the experiments in [155] we simulated three SCADA-specific cyber-attacks (i.e., command injection, replay, and Denial of Ser-vice), while here in our experiments we used real malware examples.
Chapter 3. Literature Review 23
Furthermore, another work that monitored the power consumption for an em-bedded device was presented by Moore et al. [212]. While it is important to mention that their objective was to detect buffer overflow attacks and not mal-ware detection, this work is still related as they used power-based features for anomaly detection. Power consumption data was collected by using an I-jet mod-ule, a device capable of providing power to the target board and measuring its power consumption during program execution in real time. Power segments were analyzed and they demonstrated that it is possible to distinguish some cases of buffer overflow attacks (i.e., a program crash and injection of executable code) from normal operations.
Software Defined Radio
A software defined radio (SDR) is a radio communication system in which those components that were typically implemented in hardware (e.g., mixers, filters, and amplifiers) are instead implemented by means of software on a general-purpose computer or embedded system [118]. Few works explored the usage of power consumption for SDR [63, 64, 62, 242].
Gonz´alez et al. [63] proposed an approach that relies on a mechanism that en-ables an integrity assessment on SDR by capturing fine-grained measurements of the processor’s power consumption and comparing them against signatures from trusted software. Their method collects fine-grained measurements from the power consumption during the execution of trusted code. Later, different signal process-ing techniques were applied to extract dissimilarity measures from the power seg-ments. After the feature extraction, these power segments were passed through a supervised classifier or detector that has been previously trained using power segments from trusted software. Finally, a detector compares the test segments against all known signatures, and if no single test is enough to determine that authorized code was executed, then an intrusion is reported. This method was adapted by the Power Fingerprinting (PFP) firm (http://pfpcyber.com/) and can also be applicable to embedded systems [64, 62, 242]. Nonetheless, we must
em-phasize that these works [212, 63, 64, 62, 242] used only power segments, while in this dissertation we are using power-based features from the whole power sig-nal and we are combining these features with other dynamic behavioral-based and code-based static features.
General-Purpose Computers
With respect to general-purpose computers, power consumption has received little attention as a feature for anomaly detection due to its noisiness which prevents fine-grained analysis of power traces [107]. Nevertheless, literature shows there are a few power-based approaches focused on general-purpose computers for identifying web pages by tapping the electrical outlet [106], and for malware detection [239, 290, 114, 91, 201]. From these previous works, the most relevant to our research are [114, 91, 201].
Dawson et al. [114] proved the algorithm developed in [157] can be used to detect the presence of malware (i.e., rootkits) through the collection and analysis of data from voltage measurements taken from one of the power supply rails. They collected power consumption data using a multimeter and current clamp [114, 201], which limited the sampling rate to 1Hz. While here we used a sampling rate of 100Hz to collect the power consumption data. Using hardware-based monitoring is more accurate and, unlike software-based monitoring tools (i.e., software used on mobile devices to collect power consumption data [158, 303, 77]), does not affect the power consumption on the experimental machine and is harder to be manipulated by successful malicious attacks. Similarly, Luckett et al. [201] extended the work in [114] by proposing a model using nested neural networks. When compared to traditional machine learning algorithms they demonstrated that the proposed model outperformed previous methods.
Another relevant work related to this dissertation is our previous work [91] in which we proposed an unsupervised anomaly detection ensemble using only the +12V CPU rails and compared its performance with several supervised kernel-based SVM classifiers (trained on clean and infected profiles) for detecting
previ-Chapter 3. Literature Review 25
ously unseen malware. While we used the same hardware configuration as in [91] to collect the power consumption data, our software tools were different. In ad-dition, our previous work used data only for the +12V CPU rails, while here we evaluate which voltage rail leads to best performance.
While all these works [114, 91, 201] used only power-based features and very small sets of malware (e.g., five [91] and four [201] malware examples), in this dissertation we used a larger set of malware and non-malicious applications (i.e. fifty one malware examples and twenty two non-malicious applications).
3.1.2
Network Traffic-based Features
Network traffic analysis is challenging due to the dynamic nature of network traffic. However, prior works proposed solutions to address this problem by using statistics, data mining, and machine learning techniques [166]. Anomalies in the network traffic data can be due to cyber-attacks, but also because of malfunctioning devices or network overloads. Thus, using reliable network traffic data is imperative.
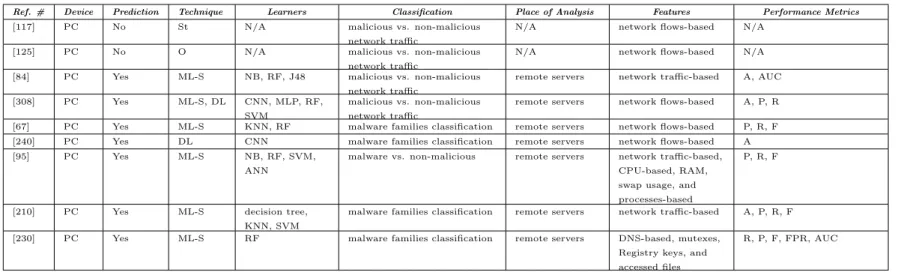
In this dissertation, we used the dynamic behavioral data collected from our experimental set-up and extracted network traffic-based features, which can be divided into two categories: commonly used network traffic features and network flows-based features. A comparison of the most relevant works that used network traffic-based features is given in Table 3.2. Previous works that explored commonly used network traffic-based features have focused on network traffic classification for botnet detection [124, 61, 316, 98, 148, 204], detection for specific types of cyber-attacks such as Denial of Service [253], detection of anomalies related to specific protocols (e.g., HTTP) [229, 236], classification of the network traffic itself to malicious and benign [84], and malware detection (i.e., malicious vs. non-malicious software) [95, 210, 230].
Besides the commonly used network traffic-based features, we are also exploring the usage of network flows-based features for malware detection as some previous works [124, 120, 98, 61, 316, 148, 149, 73, 289, 117, 125, 308]. Network flows-based
features have been mainly used for detection of botnets [124, 120, 98, 61, 316, 148, 149, 227], for detection of anomalous network traffic [80], and for classification of malware families [240, 67]. With respect to malware detection, network flows-based features have not been extensively explored, except for a few works that focused on network traffic classification for malware detection in Android devices [73, 289], detection of worms [117, 125], and detection of other types of malware, such as trojans and viruses [84, 308]. From these approaches, we focused on those methods that used similar network traffic-based features and malware types [95, 210, 230, 117, 125, 84, 308, 240, 67].
Some of these works [95, 210, 230] executed the malware examples in a con-trolled environment to collect the dynamic behavioral-based features for the clas-sification of malicious and non-malicious software [95] and for malware families classification [210, 230]. Burnap et al. [95] used machine learning techniques with behavioral-based features (i.e., CPU, RAM, processes and network traffic) derived from the footprint that was left behind on a computer system after the execution of a software to classify malware from non-malicious software. Mohaisen et al. [210] described a technique that relies on the order and frequency with which malware examples conduct specific actions on the system. Collected .pcap files were parsed for relevant events and subsequently n-grams features were extracted and used for malware classification. Radu et al. [230] proposed a malware classification ap-proach based on features such as DNS-based, accessed files, mutexes, and Registry keys-based. The integration of these features helped to maintain the Accuracy of the used supervised machine learning algorithm.
With respect to network flows-based features, the most relevant prior works to ours are [117, 125, 84, 67, 308, 240]. Dubendorfer et al. [117] proposed an approach that used network flows from high speed Internet backbones demonstrating worms can be detected by tracking the cardinality of sudden changes in the network traffic. Dressler et al. [125] developed a pattern based on the correlation of flow-based features with system logs data for worms detection. Bekerman et al. [84] presented a malware detection approach that classified malicious and non-malicious
Chapter 3. Literature Review 27
network traffic recorded in sandbox environments and in real networks. AlAhmadi et al. [67] proposed an approach that analyzed and classified network traffic of malware variants based on their network flow sequence behavior. Yeo et al. [308] classified network packets by botnets, trojans, and viruses using a convolutional neural network (CNN), while Rahul et al. [240] presented a CNN for classifying network traffic of malware families.
While prior works have integrated network flows-based features with system logs-based features for botnet detection [204], worm detection [125], malware de-tection [95], and malware families classification [210, 230], none of these works integrated the network traffic data and system logs with code-based static and power-based features for the classification of unknown applications to malware and non-malware.
3.
Literature
Review
28
network traffic
[125] PC No O N/A malicious vs. non-malicious network traffic
N/A network flows-based N/A [84] PC Yes ML-S NB, RF, J48 malicious vs. non-malicious
network traffic
remote servers network traffic-based A, AUC [308] PC Yes ML-S, DL CNN, MLP, RF,
SVM
malicious vs. non-malicious network traffic
remote servers network flows-based A, P, R [67] PC Yes ML-S KNN, RF malware families classification remote servers network flows-based P, R, F [240] PC Yes DL CNN malware families classification remote servers network flows-based A [95] PC Yes ML-S NB, RF, SVM,
ANN
malware vs. non-malicious remote servers network traffic-based, CPU-based, RAM, swap usage, and processes-based
P, R, F
[210] PC Yes ML-S decision tree, KNN, SVM
malware families classification remote servers network traffic-based A, P, R, F [230] PC Yes ML-S RF malware families classification remote servers DNS-based, mutexes,
Registry keys, and accessed files
R, P, F, FPR, AUC
Table description for each column that has abbreviations:
•Devicecolumn: M = mobile and PC = general-purpose computer
•Techniquecolumn: O = observations; St = statistical-based; ML-S = supervised machine learning; and DL = deep learning
Chapter 3. Literature Review 29
3.1.3
System logs-based Features
Monitoring system’s behavior is of great importance for malware analysts because it provides valuable information about the software, hardware, system processes and system components as well as information such as error and warning events related to the computer operating system. Previous works have used system logs-based features for intrusion detection [72, 202, 211, 311, 133, 126], to classify mal-ware from non-malicious softmal-ware [251, 250, 113, 163, 279, 119, 197, 295, 99, 222], for malware families classification [230, 131, 178], and for both malware detection and malware families classification [170, 97].
From these previous works, we focused on those approaches that did malware detection [251, 250, 113, 119, 197, 295, 170, 99, 97, 279, 163, 222]. These malware detection approaches [251, 250, 113, 119, 197, 295, 170, 99, 97, 279, 163, 222] can be divided based on the device being monitored (i.e., mobile devices [119, 197, 295, 170, 99, 97, 222] and general-purpose computers [251, 250, 113, 279, 163]). A comparison of previous works that used system logs-based features for malware detection is given in Table 3.3.
Salehi et al. [251] conducted several machine learning experiments using API names and arguments for malware detection and for malware families classifica-tion. For evaluation purposes, both API names and arguments were investigated separately and then combined. Results demonstrated the Accuracy of the learners improved by 6% when all features were used. Sainju [250] presented observations about specific system events triggered after infecting the experimental machine with different types of malware (e.g., trojans, worms). Dahl et al. [113] proposed the used of random projections to further reduce the dimensionality of the original input space before feeding the data to a neural network. This reduction technique allowed to train the neural network with one or more hidden layers reducing the two-class error rate by 43% when compared to Logistic Regression trained with all features. Huynh et al. [163] proposed an online algorithm for malware detection under concept drift when the behavior of malware changes over time. While a
most recent work, Stiborek et al. [279], proposed a malware detection approach using clustering techniques based on the behavior observed from system logs and network traffic data focused on the HTTP protocol.
Data analysis was conducted via machine learning techniques for most of these works [251, 113, 163, 279, 119, 197, 295, 170, 99, 97, 222], except for [250] which pre-sented observations about the behavior of specific malware examples. Most of these works used only system logs-based features [251, 113, 163, 250, 119, 295, 99, 97, 170] or combined the system logs-based features with network traffic-based fea-tures [279]. In the case of mobile devices, some works combined system logs-based features with permissions [197] and with permissions and intent [222]. Interestingly, none of these works combined the system logs-based features with code-based static features or with other behavioral-based features like power consumption, which is explored in this dissertation.