Implantable Cardioverter-Defibrillator Electrograms
Charles Swerdlow, MD; Kalyanam Shivkumar, MD, PhD; Jianxin Zhang, MS
Background—The upper limit of vulnerability (ULV) correlates with the defibrillation threshold and can be determined with 1 episode of ventricular fibrillation (VF). To automate the ULV in an implantable cardioverter-defibrillator (ICD), the most vulnerable intervals must be identified from an ICD electrogram rather than the latest-peaking surface T wave (Tpeak). We hypothesized that the recovery time (TR), defined as the maximum derivative (dV/dt) of the T wave of the shock electrogram, correlates with the most vulnerable intervals.
Methods and Results—We determined ULV, defibrillation threshold, and the most vulnerable intervals in 25 patients at ICD implantation. The ULV was the weakest T-wave shock that did not induce VF. The most vulnerable intervals were the ones associated with the strongest shocks that induced VF. Telemetered shock electrograms were stored on digital tape and differentiated offline to measure TR. Tpeak and TR were highly correlated (Tpeak⫺TR⫽⫺2⫾11 ms; ⫽0.80,
P⬍0.001). At least 1 most vulnerable interval timed between⫺20 ms and⫹20 ms relative to Tpeakin all patients and between⫺40 ms and⫹20 ms relative to TRin 96% of patients.
Conclusions—The recovery time of shock electrograms provides accurate information about global repolarization. TR closely approximates Tpeak. The ULV method may be automated in an ICD by timing T-wave shocks relative to TR.
(Circulation. 2003;107:3028-3033.)
Key Words: defibrillation 䡲 fibrillation 䡲 shock
T
he upper limit of vulnerability (ULV) is the weakest shock that does not induce ventricular fibrillation (VF) when delivered during the vulnerable period. It correlates closely with the minimum shock energy that defibrillates reliably.1–3 Studies have validated the ULV as a basis for programming implantable cardioverter defibrillator (ICD) shocks4,5 and identified advantages of vulnerability testing over fibrillation-defibrillation testing.4,5Determination of the ULV requires that T-wave shocks be timed at the most vulnerable intervals, corresponding to peak of the vulnerable zone.6This interval is identified relative to an easily determined and reliable measure of repolarization, usually the peak of the latest peaking T-wave recorded from multiple surface ECG leads.2–5ULV testing would be more efficient if the most vulnerable intervals could be identified from ICD electrograms, permitting ICDs to select timing intervals automatically for T-wave shocks.
Because ICD electrograms typically have biphasic T waves, their peaks are difficult to measure. The recovery time (TR) is defined as the maximum of the first time derivative (dV/dt) of the T wave. TR of a unipolar electrogram is a reliable measure of local repolarization.7–9We hypothesized that the timing of the peak of the vulnerable zone could be estimated from TRof an electrogram recorded between large, widely spaced, intrathoracic defibrillation electrodes.
Methods
Patients
Patients were candidates for this study if they had left pectoral implants of an ICD with a lead implanted at or near the right ventricular apex. All gave written, informed consent according to a protocol approved by the Human Subjects Committee. Patient characteristics are shown in Table 1.
Study Procedure
The implant procedure has been described.3–5We measured ULV
and defibrillation threshold (DFT) by an interleaved protocol.3
Testing was performed using the implanted pulse generator (Medtronic models 7274 or 7276), which delivered biphasic shocks from right ventricular coil to left pectoral ICD case (CAN) plus superior vena cava (SVC) electrode using a true-bipolar, dual-coil electrode (Medtronic model 6947).
Right ventricular apical pacing was performed at a baseline (S1) cycle length of 500 ms. All 12 surface ECG leads were recorded simultaneously on a computer screen and displayed at a 200 mm/s. The T waves were inspected to select the lead with the latest-peaking monophasic T wave that had opposite polarity to the QRS com-plex.3–5The interval from S1 to the peak of this T wave (S1-T
peak)
was measured initially and after every fourth T-wave shock. Because the timing of T-wave shocks was programmable in increments of 10 ms, S1-Tpeak was rounded to the nearest 10 ms to select shock
coupling intervals. T-wave shocks were delivered after 8 S1s. The sequence of shock energies used for both ULV and DFT testing is shown in Figure 1A.
Received January 21, 2003; revision received March 26, 2003; accepted March 31, 2003.
From Cedars-Sinai Medical Center (C.S., J.Z.) and David Geffen School of Medicine at UCLA (K.S.), Los Angeles, Calif.
Dr Swerdlow serves as a consultant to Medtronic. Drs Swerdlow and Shivkumar receive lecture honoraria paid for by Medtronic and St. Jude Medical. Dr Swerdlow has received lecture honoraria paid for by Guidant.
Correspondence to Charles D. Swerdlow, MD, 8635 W Third St, Suite 1190 W, Los Angeles, CA 90048. E-mail [email protected] © 2003 American Heart Association, Inc.
Circulation is available at http://www.circulationaha.org DOI: 10.1161/01.CIR.0000074220.19414.18
T-Wave Shock Protocol
This protocol identified both the ULV and the most vulnerable intervals, corresponding with the peak of the vulnerable zone, defined as those intervals associated with the strongest shocks that induced VF. The protocol delivered T-wave shocks until the most vulnerable intervals were bounded on 3 sides by intervals and shock energies at which VF was not induced (shorter and longer intervals at the same energy and higher energy at the same and adjacent intervals). There were 3 main steps. In step A, the intervals at 0 and ⫺20 ms relative to Tpeakwere tested using decreasing energies until
VF was induced. This strategy was chosen to limit the number of shocks based on a report that 1 of these intervals identified the peak of the vulnerable zone in⬇90% of patients.3In step B, to establish
the ULV, shock energy was increased by 1 step and shocks were delivered at any untested intervals in the range ⫺20 to⫹20 ms relative to the interval that induced VF. If VF was induced at this higher energy, this step was iterated. If VF was not induced, step C was performed. In step C, to establish the inner and outer boundaries of the peak of the vulnerable zone, shorter and longer intervals were tested at the greatest energy that induced VF. If VF was induced in step C, step B was performed relative to the new interval that induced VF. Steps B and C were interleaved until the most vulnerable intervals were bounded on 3 sides.
Figure 1B shows an example. In step A, neither shock 1 at Tpeakor
shock 2 at⫺20 ms relative to Tpeakinduce VF. Shock energy is then
decremented, and these intervals are retested (shocks 3 through 5) until VF is induced (shock 5). In step B, shock energy is increased by 1 step, and shocks are delivered to any untested intervals in the range of⫺20 ms to⫹20 ms relative to the interval of shock 5. The first 2 intervals (⫺20 and 0 ms) already have been tested (shocks 3 and 4), so shock 6 is delivered at the last interval (⫹20 ms) and does not induce VF. In step C, shock 7 is delivered 20 ms before the
interval at which shock 5 induced VF and at the same energy. Because shock 7 induces VF, step B is performed to cover the range ⫺20 ms to⫹20 ms relative to the interval of shock 7 by delivering shock 8 at the next higher energy. Because shock 8 did not induce VF, step C is performed relative to the interval of shock 7 by delivering shock 9 at an interval 20 ms earlier. Then shock 10 is delivered 20 ms after the longest interval that induced VF. In this example, the ULV is 6 J and the peak of the vulnerable zone includes the intervals at⫺20 and 0 ms relative to Tpeak.
If either of the 2 initial shocks at 9 J induced VF, the shock energy was increased as shown in Figure 1A and a corresponding protocol was followed until both the ULV and the width of the peak of the vulnerable zone were identified.
Determination of the DFT
VF was induced by T-wave shocks. If the T-wave shock protocol was completed before the DFT was determined, VF was induced by 2 J monophasic T-wave shocks at Tpeak. The sequence of shock
energies for DFT testing was identical to that for ULV testing. The DFT was defined as the lowest measured shock energy that termi-nated VF.
Pacing at Different Cycle Lengths
In the last 15 patients, we performed additional pacing for 10 seconds at cycle lengths 400, 500, 600, 800, and 1000 ms if hemodynamically tolerated (400 ms) and if pacing was maintained without sinus capture beats (800 and 1000 ms).
Recording and Analysis of Electrograms
Surface ECG lead II and 2 telemetered ICD electrograms (filtered 3 to 100 Hz) were recorded using a digital tape recorder (Teac Model RD-145T). Electrograms were telemetered at 256 Hz and digitized on an 8-bit scale with a range of ⫺4 to ⫹4 mV. Signals were transferred to a personal computer and differentiated using Origin 5.0 (Microcal Software).
Depending on the programmable options for each ICD model, we recorded the electrogram from either right ventricular coil to CAN (Coil-CAN, model 7276) or from right ventricular coil to a common
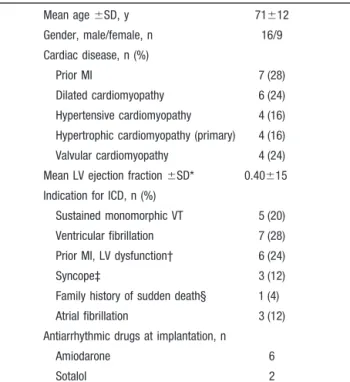
TABLE 1. Patient Characteristics (nⴝ25)
Mean age⫾SD, y 71⫾12 Gender, male/female, n 16/9 Cardiac disease, n (%) Prior MI 7 (28) Dilated cardiomyopathy 6 (24) Hypertensive cardiomyopathy 4 (16) Hypertrophic cardiomyopathy (primary) 4 (16) Valvular cardiomyopathy 4 (24) Mean LV ejection fraction⫾SD* 0.40⫾15 Indication for ICD, n (%)
Sustained monomorphic VT 5 (20) Ventricular fibrillation 7 (28) Prior MI, LV dysfunction† 6 (24)
Syncope‡ 3 (12)
Family history of sudden death§ 1 (4) Atrial fibrillation 3 (12) Antiarrhythmic drugs at implantation, n
Amiodarone 6
Sotalol 2
MI indicates myocardial infarction; LV, left ventricular; and VT, ventricular tachycardia.
*LV ejection fraction was measured by contrast angiography in 12 patients and radionuclide ventriculography in 13 patients.
†Prior MI and either LV ejection fraction⬍30% (n⫽1) or LV ejection fraction ⬍40%, clinical nonsustained VT, and inducible sustained VT.
‡Inducible sustained VT with prior MI (n⫽2), severe dilated cardiomyopathy (n⫽1).
§Hypertrophic cardiomyopathy with troponin T mutation.
Figure 1.Shock protocol. A, Sequence of shock energies for ULV and DFT testing. B, Sequence of shock energies and cou-pling intervals for T-wave shocks in an individual patient. Each box denotes a shock energy and coupling interval. Shocks are numbered sequentially from 1 to 10. Arrows indicate sequence. Hatched boxes labeled VF identify shocks that induced ventric-ular fibrillation. See text for details.
electrode of CAN and SVC coil (Coil-CAN⫹SVC, model 7274). These were the principal electrograms used for data analysis, and TR
refers to the recovery time measured from them. In the first 15 patients, we recorded electrograms from the right ventricular tip to right ventricular coil (Tip-Coil) electrodes in addition to the principal electrogram.
Data Analysis
When measurements were made from 8-beat pacing trains, S1-Tpeak
was the average value for the last 2 beats. When pacing was performed for 10 seconds, S1-Tpeakwas the average value for the last
5 beats. TRwas measured on a computer screen using digital calipers
at the maximum of the time derivative of the T wave of each
electrogram. S1-TR was measured on the same beats used for
measuring S1-Tpeak, and average values were calculated in the same
way. The width of the peak of the vulnerable zone was the difference between minimum and maximum intervals at the peak. If this peak included more than 1 interval, the timing of the peak was the average of these intervals. A P⬍0.05 using the 2-tailed, t test, 2test, or
ANOVA was used to reject the null hypothesis. The Lin concordance coefficient () was computed between Tpeakand TR. This coefficient
is similar to the Pearson correlation coefficient but measures close-ness of points to the line of identity rather than the line of regression. In the first 15 patients, repeated-measures ANOVA was used to compare Tpeak, TR, and the recovery time recorded from the Tip-Coil
electrogram (TR[Tip-Coil]). Post-hoc analysis was performed using
Fisher’s protected least significant difference test.
Results
ULV Versus DFT
The ULV and DFT were highly correlated (ULV: 9.4⫾5.5 J; DFT: 7.8⫾6.0 J; r⫽0.92, P⬍0.0001). Shock lead impedance was 39⫾8 ⍀. Patients received 8.7⫾2.2 T-wave shocks. There were no perioperative complications.
Measurement of TR
Figure 2 shows surface ECG lead II, intracardiac electrogram, and the derivative of the electrogram from 1 patient. There is close agreement between Tpeakon the surface ECG and TRon the differentiated electrogram. In all patients, electrograms had biphasic T waves similar to those in Figure 2. Thus, the method of identifying the most vulnerable intervals used for surface ECG leads, based on the peak of a monophasic T wave, could not be applied to electrograms. The slew rate at TRwas 1.4⫾0.5 V/s.
TpeakVersus TR
In all patients, S1-Tpeakand S1-TRwere highly correlated at cycle length 500 ms (S1-Tpeak: 345⫾18 ms; S1-TR: 347⫾18 ms;⫽0.80, P⬍0.001). The difference in Tpeakand TRwas ⫺2⫾11 ms (median,⫺4 ms; range,⫺23 to⫹22 ms). The absolute value of this difference was 9⫾7 ms. Tpeak⫺TRwas not significantly different for the 2 electrode configurations of the principal electrogram (Coil-CAN: 1⫾11 ms; Coil-CAN⫹SVC:⫺5⫾11 ms; P⫽0.18). Table 2 shows that there was no significant effect on Tpeak⫺TR of clinical variables
Figure 2.ECG lead II, intracardiac Coil-CAN⫹SVC electrogram (EGM), and its derivative (EGM dV/dt) from patient 5. The peak of differentiated signal (TR) times with the peak of the T wave
(Tpeak). In this patient, Tpeakwas identified in lead II.
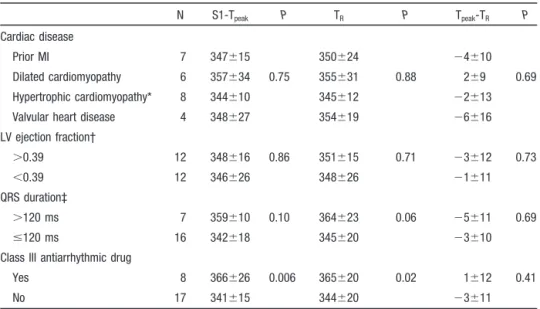
TABLE 2. Effect of Clinical Variables
N S1-Tpeak P TR P Tpeak-TR P
Cardiac disease
Prior MI 7 347⫾15 350⫾24 ⫺4⫾10
Dilated cardiomyopathy 6 357⫾34 0.75 355⫾31 0.88 2⫾9 0.69 Hypertrophic cardiomyopathy* 8 344⫾10 345⫾12 ⫺2⫾13
Valvular heart disease 4 348⫾27 354⫾19 ⫺6⫾16
LV ejection fraction† ⬎0.39 12 348⫾16 0.86 351⫾15 0.71 ⫺3⫾12 0.73 ⬍0.39 12 346⫾26 348⫾26 ⫺1⫾11 QRS duration‡ ⬎120 ms 7 359⫾10 0.10 364⫾23 0.06 ⫺5⫾11 0.69 ⱕ120 ms 16 342⫾18 345⫾20 ⫺3⫾10
Class III antiarrhythmic drug
Yes 8 366⫾26 0.006 365⫾20 0.02 1⫾12 0.41
No 17 341⫾15 344⫾20 ⫺3⫾11
MI indicates myocardial infarction; LV, left ventricular.
*Includes hypertensive and primary hypertrophic cardiomyopathy. †Dichotomized by median value of 0.39.
such as cardiac disease, left ventricular ejection fraction, QRS duration, or class III antiarrhythmic drugs.
Recovery Time for Tip-Coil Electrogram
Tip-Coil electrograms could be analyzed for 10 of the first 15 patients. In the remaining 5 patients, the amplitude of the T wave was so low that quantization noise made interpretation of the derivatives unreliable. In 10 analyzed patients, mean values for S1-Tpeak, S1-TR, and S1-TR[Tip-Coil] were 343⫾16, 345⫾23, and 314⫾27 ms, respectively. Repeated-measures ANOVA identified significant differences among these variables: F(2,18)⫽11.7, P⬍001. Post hoc analysis identified significant differences (P⬍0.001) for S1-Tpeak ver-sus S1-TR[Tip-Coil] and for S1-TR versus S1-TR[Tip-Coil] but not for S1-Tpeakversus S1-TR(P⫽0.79).
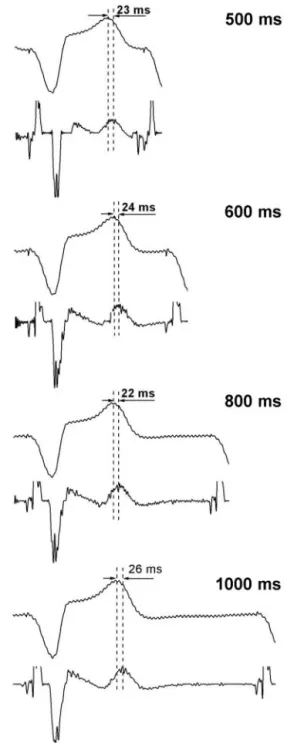
TpeakVersus TRat Multiple Cycle Lengths
Figure 3 shows the ECG and the derivative of the electrogram at multiple paced cycle lengths from a single patient. Tpeakand TR increase in parallel as cycle length increases. Figure 4 shows the strong correlation between Tpeakand TRat multiple paced cycle lengths in the last 15 patients;⫽0.90, P⬍0.001.
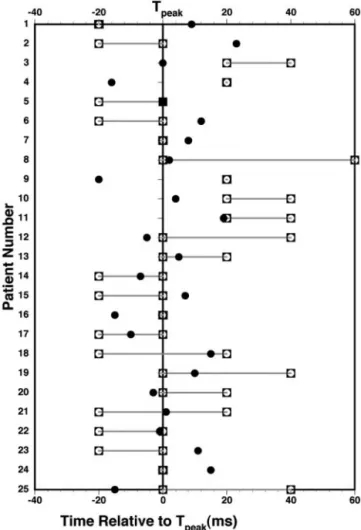
Most Vulnerable Intervals
Figure 5 shows the timing of the most vulnerable intervals and TR relative to Tpeak in all patients. The peak of the vulnerable zone included 1 tested interval in 8 patients (32%), 2 intervals in 12 patients (48%), 3 intervals in 4 patients (16%), and 4 intervals in 1 patient (4%). The difference between the longest and shortest most vulnerable interval was 20⫾17 ms (median, 20 ms; range, 0 to 60 ms).
The peak of the vulnerable zone was 6⫾15 ms after Tpeak versus 4⫾21 ms after TR. Tpeak identified the peak of the vulnerable zone in 19 patients (76%), and the 2 intervals at 0 and ⫹20 ms relative to Tpeak identified the peak of the vulnerable zone in 24 patients (96%). In all patients, at least 1 most vulnerable interval was timed from⫺20 to ⫹20 ms relative to Tpeak.
In 22 of 25 patients (88%), at least 1 most vulnerable interval timed from ⫺20 to ⫹20 ms relative to TR. In the remaining 3 patients, the most vulnerable interval timed at TR ⫺29 ms for a Coil-CAN electrogram and at TR⫹36 ms and TR⫹40 ms for 2 Coil-CAN⫹SVC electrograms.
Discussion
Our principal finding is that TR on the shock electrogram closely approximates Tpeak. The clinical implication is that the ULV method may be automated in an ICD by timing T-wave shocks relative to TR.
Clinical Application of the ULV
Vulnerability testing provides either a patient-specific mea-sure of defibrillation efficacy (the ULV)2,3with 1 episode of VF or a reliable defibrillation safety margin without VF. In comparison with ICD implant testing using the fibrillation-defibrillation method, the vulnerability method minimizes those risks that are related to VF or circulatory arrest rather than to shocks, such as intractable VF, cerebral hypoperfu-sion, and myocardial ischemia.
The ULV corresponds to the peak of the vulnerable zone, a bounded region in a 2-dimensional space defined by coupling interval (time) on the abscissa and shock strength on the ordinate.6To measure the ULV, T-wave shocks must be timed to coincide with this peak. During right ventricular apical pacing, the peak of the vulnerable zone times closely with the latest-peaking monophasic T wave in any ECG lead.3 The peak of the T wave corresponds with epicardial repolar-ization during endocardial pacing.10 This suggests that the timing of the latest-peaking T-wave (Tpeak) may correspond
Figure 3.ECG lead II and the differentiated EGM at multiple paced cycle lengths from patient 18. As cycle length varies,
tim-ing changes in TRparallel those of the peak of the T wave in
lead II. Tpeakis 22 to 26 ms after the peak of the T wave in lead
II, which timed 7 to 10 ms before Tpeakmeasured in lead V3.
with the timing of latest epicardial repolarization and that the timing of the peak of the vulnerable zone approximates that of latest epicardial repolarization.
The present clinical method for identifying the most vulnerable intervals has practical limitations. It requires inspecting multiple (preferably all 12) ECG leads,3–5 identi-fying those with monophasic T waves, and measuring their S1–Tpeak intervals.3–5 This is impractical in catheterization laboratories or operating rooms if only 1 to 3 ECG leads are recorded or if measurements can be made only at 25 to 50 mm/s. Because the S1-Tpeak interval may vary, S1-Tpeak should be remeasured during the testing procedure. Operator error may occur if biphasic T-waves are measured or retro-grade P waves are not identified. ULV testing would be more efficient if ICDs selected timing intervals for T-wave shocks automatically based on measurements made from electrograms.
Recovery Time
TRon a unipolar electrogram has been validated as a measure of local repolarization in basic physiological studies.7–9The activation-recovery interval has been used to assess local repolarization in canines11 and humans.12,13 Activation-recovery intervals recorded from point electrodes act as a spatial average and are thus dominated by the action poten-tials of cells closest to the recording site.7
Present Study
This study demonstrates that Tpeakcan be estimated accurately by a recovery time recorded from a global electrogram between large, widely spaced intracardiac and extracardiac electrodes. The recovery time recorded from 2 electrodes in the right ventricle (Tip-Coil) did not correlate closely with Tpeak. To the best of our knowledge, this is the first application of the recovery time method to global repolarization. How-ever, TR does not identify the most vulnerable intervals as accurately as Tpeak. A 3-shock T-wave scan relative to Tpeak identified the most vulnerable intervals in all patients. But a 4-shock T-wave scan relative to TRwas required to identify the most vulnerable intervals in 24 of 25 patients (96%).
The near equality of Tpeakand TRsuggests that TRcontains timing information that corresponds to the timing of latest epicardial repolarization. The close agreement of TR from Coil-CAN and Coil-CAN⫹SVC electrograms suggests that the Coil-CAN component contains the key timing informa-tion. Although we hypothesized a correlation between Tpeak and TR, we did not anticipate the near equality of their timing and we did not investigate its mechanism.
Timing of the Peak of the Vulnerable Zone
The present study confirms that the peak of the human vulnerable zone is narrow, including a median of only 2 20-ms intervals. Accurate, a priori knowledge of the timing of this peak is required to minimize the number of shocks required for a clinical T-wave scan.
In previous studies using a 2-electrode Coil-CAN shock pathway, the ULV could be determined accurately by a 3-shock T-wave scan at⫺40,⫺20, and 0 ms relative to Tpeak.3 In the present study, which used a 3-electrode
Coil-Figure 5.Timing of the most vulnerable intervals and TRrelative
to Tpeak(indicated by 0 ms) in all 25 patients. Open squares
con-nected by dotted line indicate temporal borders of the peak of the vulnerable zone. The peak includes only 1 tested interval in 5 patients (numbers 1, 4, 7, 16, and 24).䢇, Timing of TR. Peak
of vulnerable zone is within 20 ms of Tpeakin all patients. Range
of⫺20 to⫹40 ms relative to TRincludes peak of vulnerable
zone in 24 patients (96%). For patient 1, the peak of the
vulner-able zone precedes TRby 29 ms.
Figure 4.Scatter plot of Tpeakversus TRat multiple paced cycle
CAN⫹SVC shock pathway, the optimal timing of a 3-shock T-wave scan differed at⫺20, 0, and⫹20 ms relative to Tpeak. This small difference is important clinically. The peak of the vulnerable zone was identified only ⱖ ⫹20 ms relative to Tpeakin 5 of the 25 patients in the present study versus none of the 14 patients in a previous study.3A 20-ms difference in the coupling interval of T-wave shocks can result in signifi-cant underestimation of the ULV.3
Induction of VF by a T-wave shock depends on a critical relationship between the sequence of repolarization and the region of weakest shock field.6In swine, the timing of the peak of the vulnerable zone differs for different pacing configurations, providing the shocking configuration is kept constant.14Comparison of the present study with our previous clinical study3 suggests that the timing of the peak of the vulnerable zone differs for different shocking configurations, providing the pacing configuration is kept constant.
Limitations
The ICD pulse generators in the present study applied a 3-Hz high-pass filter to telemetered electrograms. We do not know how our results would be affected by different filtering. Our results apply specifically to right ventricular apical pacing. Pacing from other locations might affect the relationship between Tpeak and TR. This study was performed using true-bipolar defibrillation leads. Use of integrated-bipolar leads, which pace through the distal coil, might cause pacing artifact that affects measurement of TR. Although the study was performed using ICDs from one manufacturer, the results should be applicable to other ICDs if similar sampling rates, filtering, and electrodes are used. This study did not deter-mine which conditions, if any, alter the close relationship between Tpeakand TR. Although we did not identify any such conditions, it is possible that specific antiarrhythmic drugs, repolarization abnormalities, cardiac pathology, or other con-ditions might alter this relationship. We cannot exclude a small effect on Tpeak-TRbetween the 2 electrode configura-tions used for the principal electrogram.
Conclusion
Application of the recovery time method to widely spaced defibrillation electrodes provides accurate information about global repolarization. TR on the CAN or
Coil-CAN⫹SVC electrogram closely approximates Tpeak on the latest-peaking monophasic T wave. The ULV method may be automated in an ICD by timing T-wave shocks relative to TR.
Acknowledgments
Dr Shivkumar is a recipient of a Clinical Scientist Development Award from the Doris Duke Charitable Foundation, NY. The authors thank Lucy Gonzales for manuscript preparation.
References
1. Chen PS, Shibata N, Dixon EG, et al. Comparison of the defibrillation threshold and the upper limit of ventricular vulnerability. Circulation. 1986;73:1022–1028.
2. Swerdlow CD, Ahern T, Kass RM, et al. Upper limit of vulnerability is a good estimator of shock strength associated with 90% probability of successful defibrillation in humans with transvenous implantable cardioverter-defibrillators. J Am Coll Cardiol. 1996;27:1112–1118. 3. Swerdlow CD, Martin DJ, Kass RM, et al. The zone of vulnerability to T
wave shocks in humans. J Cardiovasc Electrophysiol. 1997;8:145–154. 4. Swerdlow CD, Peter CT, Kass RM, et al. Programming of implantable cardioverter-defibrillators on the basis of the upper limit of vulnerability. Circulation. 1997;95:1497–1504.
5. Swerdlow CD. Implantation of cardioverter defibrillators without induction of ventricular fibrillation. Circulation. 2001;103:2159 –2164. 6. Winfree AT. Sudden cardia death: a problem in topology. Sci Am. 1983;
248:144 –149.
7. Haws CW, Lux RL. Correlation between in vivo transmembrane action potential durations and activation-recovery intervals from electrograms: effects of interventions that alter repolarization time. Circulation. 1990; 81:281–288.
8. Millar CK, Kralios FA, Lux RL. Correlation between refractory periods and activation-recovery intervals from electrograms: effects of rate and adrenergic interventions. Circulation. 1985;72:1372–1379.
9. Wyatt R. Comparison of estimates of activation and recovery times from bipolar and unipolar electrograms to in vivo transmembrane action potential duration. In: Proceedings IEE: Engineering Medical Biologists Society Second Annual Conference. Washington, DC; 1980:22. 10. Yan GX, Antzelevitch C. Cellular basis for the normal T wave and the
electrocardiographic manifestations of the long-QT syndrome. Circu-lation. 1998;98:1928 –1936.
11. Taggart P, Sutton PM, Opthof T, et al. Transmural repolarisation in the left ventricle in humans during normoxia and ischaemia. Cardiovasc Res. 2001;50:454 – 462.
12. Chen PS, Moser KM, Dembitsky WP, et al. Epicardial activation and repolarization patterns in patients with right ventricular hypertrophy. Circulation. 1991;83:104 –118.
13. Chinushi M, Tagawa M, Kasai H, et al. Correlation between the effective refractory period and activation-recovery interval calculated from the intracardiac unipolar electrogram of humans with and without dl-sotalol treatment. Jpn Circ J. 2001;65:702–706.
14. Idriss SF, Wolf PD, Smith WM, et al. Effect of pacing site on ventricular fibrillation initiation by shocks during the vulnerable period. Am J Physiol. 1999;277:H2065–H2082.