Three Essays on Securitization
A Thesis
Submitted to the Faculty of
Drexel University
by
Adi Mordel
in partial fulfillment of the
requirements for the degree
of
Doctor of Philosophy
© Copyright 2010
Dedications
To my parents, Rufa and Itzchak Mordel To my wife, Rimma
Tables of Contents
LIST OF TABLES………vi
ABSTRACT………viii
CHAPTER I: Introduction 1. Securitization, Sale or Financing?………...1
3. The Role of Market Discipline………4
4. Corporate Governance and Securitization………...6
CHAPTER II: Asset Sales, Recourse, and Investor Reactions to Initial Securitizations: Evidence Why Off-Balance Sheet Accounting Treatment Does Not Remove On-Balance Sheet Financial Risk 1. Introduction………..8
2. Risk Transfer and Securitization………10
3. Literature Review………...15
4. Data………17
5. Empirical Evidence on the Effects of Securitization……….21
5.1. Short Term Market Reaction………..21
5.2. Matching Sample Selection………22
5.3. Long Term Market Reaction……….………..23
5.4. Long Term Operating Performance………....24
5.5 Securitization and Risk………25
6. Multivariate Analysis……….29
6.1. Sample Selection Bias……….29
6.2. OLS Estimation.………..31
Tables……….36
CHAPTER III: The Information Content of Asset-Backed Securities Downgrades, And the Motivation behind Them 1. Introduction………51
2. Literature Review………...55
2.1. Corporate Debt Downgrade and Security Returns………..55
2.2. FASB140 – True Sale Assumption……….57
2.3. Implicit Recourse and Securitization………..58
2.4. Rating Agencies and the ABS Market………61
3. Data………63
4. Investors’ Treatment of ABS Deals………...68
4.1. Downgrade Announcements………...68
4.2. Additional Evidence on Market Discipline..………...69
4.3. Could Investors Distinguish “Good” Securitizers from Bad” Ones?...72
4.4. Punishment Period: Demand or Supply Driven?...73
4.5. Cross Sectional Regression Analysis………..……74
5. Rating Agencies’ Treatment of ABS Deals………...76
5.1. Pre-Event Stock and Operating Performance……….76
5.2. Robustness………..79
6. Conclusion……….80
Tables……….83
CHAPTER IV: Governance and Firm Value: Evidence From Initial Securitizations by Bank Holding Companies
1. Introduction………98
2. Literature Review……….101
3. Data………..103
4. Risk, Leverage, and Operating Performance………...105
5. Governance and Securitization – Multivariate Analysis……….107
5.1. Determinants of Securitization Initiation...…………...………....107
5.2. Internal Control Governance Mechanisms and Securitization……….108
5. Discussion………110
6. Conclusion………...113
Tables………...116
Appendix I: Variable Definition………..122
Appendix II: Securitizers and Matched Peers….………123
List of References………...….………124
Vita………...….………...131
List of Tables CHAPTER II
Table 1. Descriptive Statistics and Deal Distribution by Industry………36
Table 2. Short Run Market Reaction to First Act of Securitization………..38
Table 3. Peer-Adjusted Buy-and-Hold Return Following the First Securitization ……..39
Table 4A. Median Peer-Adjusted Measures ………40
Table 4B. Median Industry-Adjusted Measures...………41
Table 5. The Impact of Securitization on Firm Risk ………42
Table 6. Comparison of Post Transaction Implied and Actual Debt-to-Equity Ratios …45 Table 7. Probit Estimation of a Firm’s Decision to Securitize…..………46
Table 8. Regressions of Stock Performance on Firm and Deal Characteristics………... 47
Table 9. Regressions of Risk Measures on Firm and Deal Characteristics…...…………49
CHAPTER III Table 1. Sample Characteristics ………..……….84
Table 2. Summary Statistics ……….………85
Table 3. Announcement Returns to ABS Downgrades ………...…….86
Table 4. Market Access before and around ABS Downgrades ………88
Table 4B. Punishment Period: Demand or Supply Driven………...90
Table 5. Determinants of Market Reaction and ………...91
Post Downgrade Securitization Activity Table 6. Long Term Pre ABS-Downgrade Stock Performance ………...…92
Table 7. Quarterly Operating Performance and Capital Ratio …..………...93
CHAPTER IV
Table 1. Summary Statistics ………..……….116 Table 2. Median Firm and Governance Characteristics for BHCs Prior to………117 their First Securitization Transaction
Table 3. Comparison of Median Measures of Systematic Risk (β) and Leverage …….118 Table 4. Median Peer-Adjusted Measures For BHCs that ……….119 Securitized for the First Time
Table 5. Probit Estimation of Securitization Initiation ………...………...120 Table 6. Post Securitization Effect of Governance on Firm Risk, Leverage…………..121 and Value
ABSTRACT
Three Essays on Securitization Adi Mordel
Off-balance sheet financings and securitization in particular, are viewed by many as the culprits of the 2007 financial meltdown. In a securitization transaction, assets are sold to a special purpose entity that finances the acquisition by issuing debt securities at various seniority levels to investors. In theory, the transaction relies crucially on the assumption that the risks of owning the assets are truly separated from the securitizer and reside with investors. However, in reality financial institutions take advantage of accounting rules, regulatory capital requirements, and supervisors’ indecisive actions and create a plethora of asset-backed securities (ABS) that do not completely remove the risks of owning the assets.
In my dissertation I show that securitizations negatively affect their parents, that investors do not consider ABS-deals separately from their sponsors, and that these transactions are more akin to financings than sales. Furthermore, I document that securitizers of downgraded ABS-deals face significant market discipline, as investors clearly understand the relation between ABS sponsors and their off-balance sheet deals. In addition, I find that internal control mechanisms mitigate some of the negative effects associated with securitization.
In light of the ongoing debt on the future of financial intermediation in general and securitization in particular, my dissertation offers a unique perspective on some of the contested issues. First, transparent reporting requirements should focus on the level of
retained risk and translate into on-balance sheet capital requirements. Second, ABS downgrades can serve as a valuable signal to regulators and allow them to link both on- and off-balance sheet conditions in the supervisory process. And finally, efficient corporate governance mechanisms can complement the supervisory process and attenuate the risks associated with securitization.
CHAPTER I: INTRODUCTION
Securitization, the process by which non-tradable assets are transformed into liquid securities via cash-flow repackaging, is classified by both accounting and regulatory rules as a “sale” of assets, therefore allowing the issuer to remove the assets from its books. This “off-balance sheet” treatment relies crucially on the concept of “true” sale, such that the assets are bankruptcy remote from the parent/securitizer. However, I document that this concept is violated and that according to investors these assets are not really separated from their parents. The transaction, which resembles secure borrowing, adversely affects the parent, and since the typical securitizer is a bank, the role of regulators and their ability to mitigate those effects are questioned.
My dissertation also highlights the existence of market discipline, triggered by an asset-backed security (ABS) downgrade, and its importance in complementing the regulatory process. An ABS downgrade signals potential problems and allows regulators to incorporate both on-and off-balance sheet positions within the supervisory framework. Finally, my dissertation emphasizes the importance of having proper internal control mechanisms in dealing with the aftermath of securitization. Effective corporate governance not only facilitates the supervisory process but also limits securitizer’s risk and enhances firm value.
My first essay titled “Asset Sales, Recourse, and Investors’ Reactions to Initial Securitizations: Evidence why Off-balance Sheet Accounting Treatment does not Remove On-balance Sheet Financial Risk” (Higgins, Mason, and Mordel, 2009a) addresses the validity of both regulatory and accounting classification of securitization as a sale transaction, and provides empirical evidence against such treatment.
Securitization is based on the concept of a “true” sale. As originally envisaged under FASB140, the sale leaves no remaining link to the sponsor (or seller) whether through the possibility that the assets will be repurchased or guaranteed or that they will be available to general creditors of the firm in bankruptcy.
In practice, however, securitizations closely resemble typical firm financing arrangements. In the real world, sponsors of securitized assets maintain representations and warranties, servicing contracts, and repeated reliance on a relatively small market of buyers for future securitizations (monopsonistic qualities in a repeated game) that continually link buyer and seller, possibly precluding the sort of true sale originally envisaged under FASB140. Under such scenario, securitizations should be classified as financings. In a financing, the assets do not leave the firm’s books so the transaction is exclusively on-balance sheet. Important covenants related to the financing are disclosed and the assets used in the financing are always at risk of consolidation into the general estate by bankruptcy judges.
Both accounting and regulatory treatments classify securitizations as a sale of assets, allowing the issuer to remove the assets from its books and receive off-balance sheet treatment. But the debate continues regarding whether securitizations are sales or financings, and more fundamentally, whether they should be carried on- or off-balance
sheet. One way to distinguish whether securitizations are sales or financings from a financial-economics perspective is to examine how investors in the sponsor firm, themselves, react to securitizations. In such an exercise, the most important information about investors’ reactions lies in their reactions to firms’ first securitization announcements – follow-on transactions would confer little additional information.
This paper analyzes such investors’ reactions. The systematic negative short-term equity returns and negative long-term operating performance following securitization are evidence that securitizations are viewed by investors in the sponsor firms as more similar to financings than sales. Additional analysis shows that securitization is also associated with increased systematic risk at sponsor firms, suggesting that the rapid firm growth fueled by securitization is similar to taking on substantial additional leverage. The results are strongest for banks, suggesting that regulatory capital arbitrage may create the incentive for greater leverage, and therefore greater increases in risk. Again, such results suggest for banks and non-banks alike, securitization is more akin to a financing than a sale.
The findings have implications for accounting and regulatory recognition of securitizations. While it is easy to argue that securitizations are not true asset sales, it is more difficult to argue how they should be correctly accounted for on firm balance sheets. If expected loss remains on balance sheet through residual interests, firm capital should not be reduced significantly compared to on-balance sheet treatment. On the other hand, if firms can justify some risk transfer, i.e., of unexpected loss, they should be awarded capital relief by investors and regulators alike.
2. The Role of Market Discipline
The second essay of the dissertation titled “The Information Content of Asset Backed Securities Downgrades and The Motivation behind Them” (Higgins, Mason, Mordel, 2009b) provides additional evidence against the bankruptcy remoteness of off-balance sheet assets.
Credit rating agencies (CRAs) have played an important role in the development of the securitization market.1 Their intimate involvement in the financial engineering of ABS deals, coupled with investors’ requirement of a rating agency “approval” affected the marketability of the issued securities, and along the way made CRAs look more like underwriters than passive, credit-quality opinion providers (Mason and Rosner, 2007b). The opacity and complexity of the various instruments contributed to CRAs status as the de facto regulators of that market, and
There is no doubt that securitization transformed financial intermediation. Banks could obtain cheaper funding, improve balance sheet management, and focus on activities in which they posses a comparative advantage.2 Yet these benefits seem negligible in light of the 2007 panic, which was driven by the tremendous performance deterioration and the massive downgrades of numerous ABS deals. Voices criticizing securitization point out that it increases systemic risk in the financial system, due to banks’ habit of retaining the equity portion of securitized deals, without having the adequate capital
1 On the role of rating agencies see also Committee of Global Financial System (2005), and Lucchetti and
Ng (2007).
2
On the mechanisms and benefits of securitization, see Gorton and Souleles (2006), and Greenbaum and Thakor (2007). Calomiris and Mason (2004) provide evidence on the how securitization fosters efficient contracting.
levels on-balance sheet to support it.3 In addition, CRAs have also been criticized, particularly regarding their inability to measure risk and appropriately rate the issued securities.
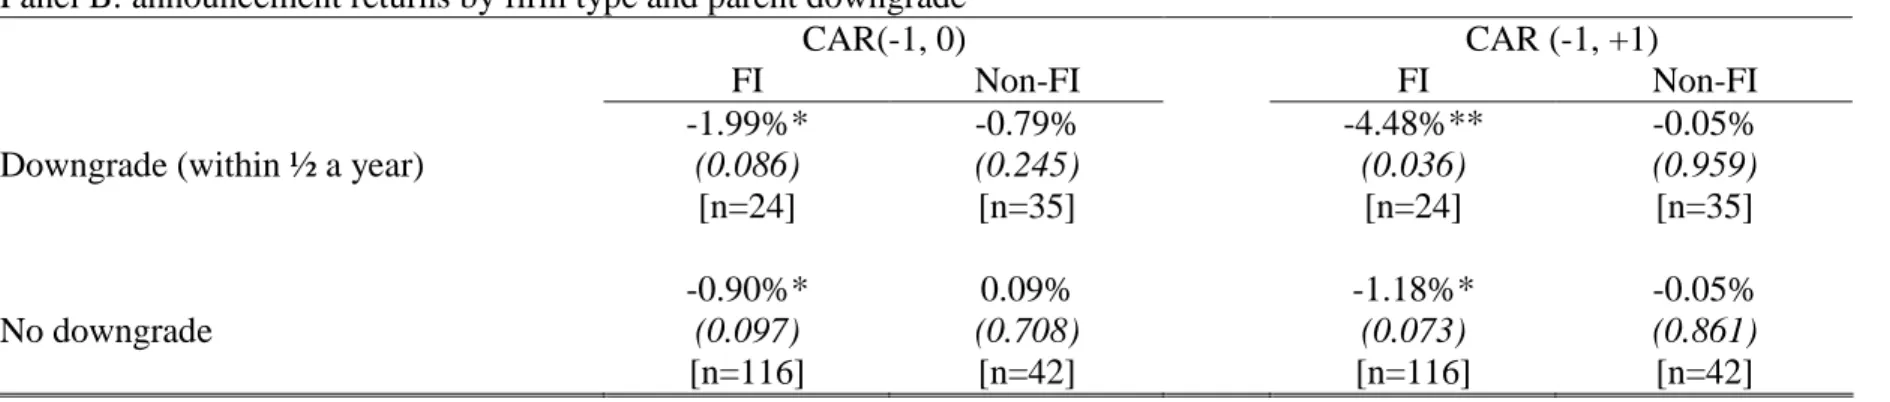
The negative sentiment on securitization raises important questions about markets functionality, discipline, and the CRAs’ downgrade motivation. To summarize our results, we show that the market reaction to an ABS downgrade is significantly negative, indicating that investors do not treat the deal independently from the ultimate parent, and that the securitization’s underlying “true sale” assumption was indeed violated. The most negative announcement returns are for downgraded ABS deals sponsored by troubled financial institutions (FIs), suggesting that investors are aware of sponsors’ ability to support poorly performing deals through implicit recourse. In addition, market discipline is not limited to a loss of market share. Ultimate parents of downgraded deals experience significant delays in their ABS issuance cycles post downgrade, suggesting that an originator’s ability to securitize depends on its credit quality. Such delays are not observed for “good” securitizers, those sponsors of ABS deals that did not suffer downgrades.
In light of the ongoing market turmoil that was driven by a myriad of complex securities (Gorton, 2008) and the numerous calls for comprehensive regulatory reforms, our results emphasize that markets were functioning even before the first signs of the upcoming panic in the summer of 2007. Investors incorporated new information promptly into a securitizer’s stock price, and accurately understood changes in its condition as the securitizer’s ability to issue ABS deals post-downgrade was sensitive to its credit quality.
3
Moreover, since under certain conditions banks are required to absorb the losses generated by their failed ABS deals, critiques question the transactions’ ability to truly separate assets from the originator and relocate risk (Stiglitz, 2008; Krugman, 2008).
Since an ABS downgrade provides valuable information on a securitizer’s relation with its off-balance sheet deal, and since the downgrade exposes the securitizer to the market’s disciplinary forces, regulatory reforms should consider incorporating such market signals into the supervisory process because any newly generated information can reduce uncertainty about a securitizer’s condition, leading to a quicker and effective response by supervisors (Flannery, 2001, Caprio, Kunt, and Kane, 2008).
With regards to credit rating agencies (CRAs), our results indicate that the consideration behind some of the ABS downgrades is not independent of the ultimate parent’s financial performance. Downgraded deals sponsored by non-FIs are associated with the sponsor’s poor pre-event stock returns and deteriorating operating performance, suggesting that CRAs, just like investors, treat ABS deals as an integral part of the ultimate parent/sponsor. That is not the case for deals sponsored by FIs. There, CRAs tend to downgrade deals irrespective of the sponsor’s pre-event performance, an indication of a downgrade driven by deal specific conditions, and potentially greater transparency.
3. Corporate Governance and Securitization
Finally, in my third essay titled “Governance and Firm Value: Evidence from Initial Securitization by Bank Holding Companies” (Mordel, 2009), I investigate the relation between various governance variables and the decision to securitized, in addition to studying whether governance mitigates any of the negative effects associated with off-balance sheet financing. To address this question, I study the governance mechanisms of
the largest most frequent securitizers, bank holding companies (BHCs), just prior to their first ever securitization transaction.
Based on my discussions with industry practitioners, it is assumed that if governance plays a role in a BHC’s decision to securitize, then it is most likely to be observable when the BHC initiates its securitization program. Once securitization is introduced, the BHC would typically issue an ABS deal once every few months, making securitization part of its ongoing operation and as a result limiting the board of directors’ involvement with successive deals.
I compare the governance characteristics of 44 BHCs prior to their first ever securitization transactions with those of a matching sample based on industry, size, and leverage. I show that securitizers have lower levels of insider stock ownership and that controlling for size, risk, and liquidity, BHCs with higher levels of insider ownership are less likely to securitize.
I also find that internal corporate control variables mitigate some of the negative effects caused by securitization. I show that post-securitization systematic risk tends to be higher for securitizers, yet it is lower for securitizers with higher levels of CEO equity based compensation. In addition, implied leverage obtained from the Hamada equation (being directly related to the amount securitized) is lower for BHCs with higher levels of insider ownership. Finally, post-event firm value (measured by Tobin’s q) is positively related to the proportion of outside directors serving on the boards of securitizers.
CHAPTER II: ESSAY I
Asset Sales, Recourse, and Investor Reactions to Initial Securitizations: Evidence Why Off-Balance Sheet Accounting Treatment Does Not Remove On-Balance Sheet
Financial Risk Eric J. Higgins, Ph.D. Joseph R. Mason, Ph.D.
Adi Mordel
1. Introduction
Securitization is based on the concept of a “true” sale. As originally envisaged under FASB140, the sale leaves no remaining link to the sponsor (or seller) whether through the possibility that the assets will be repurchased or guaranteed or that they will be available to general creditors of the firm in bankruptcy.
In practice, however, securitizations closely resemble typical firm financing arrangements. In the real world, sponsors of securitized assets maintain representations and warranties, servicing contracts, and repeated reliance on a relatively small market of buyers for future securitizations (monopsonistic qualities in a repeated game) that continually link buyer and seller, possibly precluding the sort of true sale originally envisaged under FASB140. Even the most fundamental concept of the “bankruptcy remoteness” principal by which the buyer has full title to the collateral has fared poorly before bankruptcy courts and now stands on the verge of being ruled irrelevant. In a financing, the assets do not leave the firm’s books so the transaction is exclusively on-balance sheet. Important covenants related to the financing are disclosed and the assets used in the financing are always at risk of consolidation into the general estate by bankruptcy judges.
Both accounting and regulatory treatments classify securitizations as a sale of assets, allowing the issuer to remove the assets from their books and receive off-balance sheet treatment. But the debate continues regarding whether securitizations are sales or financings, and more fundamentally, whether they should be carried on- or off-balance sheet.
One way to distinguish whether securitizations are sales of financings from a financial-economics perspective is to examine how investors in the sponsor firm, themselves, react to securitizations. In such an exercise, the most important information about investor reactions lies in investor reactions to firms’ first securitization announcements – follow-on transactions would confer little additional information.
The work that follows analyzes such investor reactions. The systematic negative short-term equity returns and negative long-term operating performance following securitization are classic evidence that securitizations are viewed by investors in the sponsor firms as more similar to financings than sales. Additional analysis shows that securitization is also associated with increased systematic risk at sponsor firms, suggesting that the rapid firm growth fueled by securitization is similar to taking on substantial additional leverage. Such results are again consistent with classifying securitizations as financings rather than sales, despite accounting and regulatory classifications to the contrary and off-balance sheet treatment.
The remainder of this paper first describes the kinds of recourse activities and bankruptcy events that have led analysts and policymakers to question the classification of securitizations as sales, rather than financings. Next, the paper shows how financings and sales differ, and why investors and regulators should therefore be concerned with
whether securitizations are sales of financings. The next section introduces out data sources and data construction, followed by empirical results. The final section summarizes and concludes.
2. Risk Transfer and Securitization
Early securitizations were limited by REMIC tax laws that maintained a strict boundary between the seller and the assets securitized. But as securitization was applied beyond Fannie Mae and Freddie Mac conforming mortgages to other assets like lease receivables, automobile loans, credit cards, and second-lien and non-conforming (subprime and Alt-A) first-lien mortgages in the early 2000s, those boundaries were relaxed significantly.
Some of the first relaxations came about in the credit card sector, which until 2004 was still the largest sector of securitizations outside of conforming mortgages. According to Higgins and Mason (2004), “…many loan sales (particularly those involving revolving collateral such as credit card loans) hinge upon an implicit understanding that recourse may be provided by the sponsor. Such understandings exist because sponsors wish to maintain their reputations for consistent credit quality over repeated sales (while still taking advantage of the ability, under a true sale, to remove the assets from the balance sheet).” (Higgins and Mason 2004, p. 858)
The 17 discrete recourse events examined by Higgins and Mason (2004) supported 10 different credit-card banks and propped up 89 domestic and three foreign securities issues with a combined value of about $35.5 billion, comprising almost 7.5% of
the $475 billion total public credit card asset-backed security domestic issuance reported on the Securities Data Corporation’s New Issues Database through May 2002, the ending date of the study. All Higgins and Mason’s (2004) events violate the true sale provision of GAAP and RAP, yet none of the events resulted in regulatory or accounting restatements that added loans back onto bank balance sheets as (supposedly) required under accounting and regulatory provisions.
The discreet recourse events in Higgins and Mason (2004) led analysts to question recourse practices as early as the mid-1990s. Lawrence Cohn, a Senior Vice President of Equity Research at PaineWebber, wrote that PaineWebber had already been of the opinion that:
…securitizations are financing mechanisms rather than bona fide sales of assets… Clearly the risks of ownership have not passed to buyers of securitized paper. In theory, every securitization is supposed to stand on its own….In fact, if buyers and sellers miscalculate, the seller has always made up the difference rather than expose the buyers to risk. Thus the putative seller in fact passes on none of the risks of ownership. We don’t know how long the fiction of sales treatment will last. (“Will Sales Treatment Survive a Recession?” 1997, p. 1)
The lack of risk transfer soon led to pressure for treating securitizations as financings in bankruptcy courts. On December 29, 2000, LTV Steel Corporation and its operating subsidiaries (LTV) filed for bankruptcy protection under Chapter 11 and requested the court allow LTV to use the cash generated from two of LTV’s securitizations in order to stay in business. In support of its motion, LTV itself argued that the asset transfers in fact had been disguised financings and thus remained in its bankruptcy estate, thereby challenging the “bankruptcy remoteness” of its own securitizations. (Nomura 2002, p. 23)
The court issued an interim order on the same day as LTV’s bankruptcy filing, granting LTV’s motion for the use of cash collateral – the securitizations – and marking a later date on its calendar for a final determination of whether the asset transfers had been true sales or secured financings (Moody’s 2001, p. 6). The Judge was loath to accept arguments that the securitized assets had truly been sold to the securitized pools. According to the Judge’s follow-up Memorandum Opinion of February 5, 2001:
[T]here seems to be an element of sophistry to suggest that Debtor does not retain at least an equitable interest in the property that is subject to the interim order. Debtor’s business requires it to purchase, melt, mold and cast various metal products. To suggest that Debtor lacks some ownership interest in products that it creates with its own labor, as well as the proceeds to be derived from that labor, is difficult to accept. Accordingly, the Court concludes that the Debtor has at least some equitable interest in the inventory and receivables, and that this interest is sufficient to support the entry of the interim cash collateral order (Memorandum Opinion).
Even in its February 5 Opinion, however, the court did not make a determination that a true sale had or had not occurred. (Moody’s 2001, p. 7) For better or worse, the controversy was settled without any judicial resolution of the issues. LTV withdrew its attack when the securitization investors agreed to supply replacement financing through another debtor-in-possession (DIP) loan. In essence, the securitization investors experienced a forced exchange of their securitization paper for DIP paper. (Nomura 2002, p. 23) Bankruptcy courts, therefore, have never ruled on the issue of true sale. Even regulators have left the issue open. In 2002, the FDIC announced only that they “may or may not” seize securitized pool assets in the event of a bank failure, which remains the policy stance today.
Without clear judicial or regulatory guidance, recourse became instituted in a more continuous fashion in the late 1990s and early 2000s. Most recently, recourse was
extended so that very little risk left sellers’ balance sheets through securitization. By 2004, regulators memorialized continuous recourse in regulatory rules, explicitly moving away from requiring a transfer of a “majority” of risk to merely requiring a transfer of “some” of the risk (See, for instance, Office of the Comptroller of the Currency and Board of Governors of the Federal Reserve System 2003, p. 7). Regulatory rules allowing recourse for “operational issues,” like failing to adhere to a homogenous set of underwriting standards, set the stage for the willful confounding of operational and credit risk and the present crisis when a preponderance of defaulted loans could be put back to the seller on the basis of subjectively-defined operational criteria. (See, for instance, comments from FannieMae and FreddieMac in Marra 2000 and Golding 2000)
Recourse is a continuing issue in today’s market meltdown. On April 30, 2009, Advanta Corp. announced that it expects its credit card securitizations to enter early amortization despite the availability of “…tools at its disposal which the company believes will prevent early amortization if used.”4 According to Fitch, such tools could include “…charge-off sales, a yield supplement account, or receivable discounting, as seen recently at other large card issuers, 5 all of which have been identified by bank regulators as recourse events that should result in the consolidation of securitizations on-balance sheet.
Even the bankruptcy-remoteness conditions are being tested. On May 14, 2009, General Growth Properties Inc., a mall developer, filed the biggest real-estate bankruptcy in U.S. history to date and won court approval of a $400 million debtor-in-possession loan collateralized by its securitizations. Like LTV, General Growth sought (and this
4
Advanta Corp 8-K filing, May 1, 2009.
time, won) court approval to use malls that it had securitized as cash collateral for a debtor-in-possession loan facility over objections from investors in the securitizations.
The investors in the securitizations argued that many of General Growth’s malls shouldn’t be in bankruptcy at all and the parent company shouldn’t have access to those properties’ cash flow. In an amicus brief filed with the U.S. Bankruptcy Court in New York on May 1, trade groups representing the commercial real-estate industry said allowing General Growth to include the special-purpose entities in its filing could set a dangerous precedent for securitization markets by calling into question the protection of the assets from other creditors – that is, calling into question true sale. As with LTV, commercial mortgage-backed securities (CMBS) market participants thereby view the court’s decision as a threat to sales treatment.
The non-contractual nature of recourse means that implicit recourse is just that: implicit. There are no contractual terms dictating that recourse will be provided nor can there be, or the securitization will never be allowed off-balance sheet in the first place! Furthermore, there also remains no guarantee that collateral rights transferred via sales treatment will survive bankruptcy. In short, securitization is often a “sale” with little risk transfer away from the seller or bankruptcy-remoteness. If risk is not transferred, however, securitization is really just a disguised financing.
The rest of this paper investigates the financial economic nature of securitizations inferred from sponsor firm investor reactions to embarking upon such a strategy. The empirical evidence suggests investors in the sponsor firms view securitizations more like financings than sales, confirming the conjectural view of the lack of risk transfer and
bankruptcy-remoteness and calling into question accounting policies that maintain off-balance sheet treatment.
3. Literature Review
The classical literature on asset sales and financings is that of Lang, Poulsen, and Stulz (1995) and Kose and Ofek (1995), as well as that of Hite, Owers, and Rogers (1987). Lang, Poulsen and Stulz (1995) introduce the difference between asset sales and financings. According to Lang, Poulsen, and Stulz (1995) asset sales benefit investors because they allow the firm to obtain funds unfettered by additional investors who could attempt to jump the creditor queue in financial distress situations. Financings increase leverage more directly while exposing investors to the risk of appropriation.
The common view of securitization, therefore, is that securitization is thought to benefit firm financing costs by replacing a contractual hypothecation of assets with a complete legal sale into a bankruptcy remote structure. That way, general creditors have no possibility of seizing assets in the event of default or bankruptcy (Gorton and Souleles 2007). Securitization also lowers financing costs for the firm because the structure of securities used to finance the loans are rated based on the financial engineering rather than the underlying asset creditworthiness or the firm’s own credit rating. Kose and Ofek (1995) illustrate similar benefits of asset sales in divestiture announcements. Hite, Owers, and Rogers (1987) postulate that operating asset sales promote efficiency by allocating assets to better uses. The analog to financial firms is selling assets with servicing rights attached.
Securitization is also thought to benefit firms, particularly, depository institutions, by reducing reserve and capital requirements (Rosenthal and Ocampo, 1988). Banks can also securitize long-term assets (such as mortgages), move them off-balance-sheet, and shorten the average maturity of their assets. Last, securitization enables firms to focus on activities in which they have comparative advantages such as originating, servicing, and monitoring.
Theoretical work focusing on information asymmetry reaches different conclusions. For instance, Greenbaum and Thakor (1987) introduce a model dealing with bank funding modes. Their initial assumption is that loans are funded either through emitting deposits (DFM) or selling the loans to investors (SFM). Due to asymmetric information relating to loan quality6, SFM emerges as a superior way of resolving the borrower/investor conflict. Under DFM, depositors and banks incur screening costs which are born by the borrowers, while under SFM borrowers are permitted to partially insure their credit.7 The choice of insurance coverage signals borrower’s quality, and those of higher quality will choose higher levels of insurance because the interest on their loans will be lower. The important conclusion is that with an appropriately underpriced deposit insurance and asymmetric information, the best assets are securitized while the worst ones are funded with deposits, because banks liabilities can be transferred to the FDIC. Note that while this result is contrary to the media coverage of the credit crisis, it is largely correct.
Follow-on work by Instefjord (2005), Krahnen and Wilde (2006), Franke and Krahnen (2005), and Hansel and Krahnen (2007) shows that since banks in their models
6
The common assumption is that borrowers posses private information not available to depositors, hence a natural conflict emerges.
retain the first-loss piece of securitizations, banks retain the expected default losses and only sell the unexpected losses.
Instefjord (2005) shows how such arrangements can destabilize the banking sector because of incomplete risk transfer (in this case, from credit derivatives use). Krahnen and Wilde (2006) model the potential risk transfer from a bank’s balance sheet through the use of collateralized debt obligations (CDOs), which replaced securitized residual and mezzanine debt holdings at US banks after 2002, when US banks were taxed on such arrangements with 100% capitalization of residual pieces and other remaining risky pieces of securitizations on their books. Franke and Krahnen (2005) show empirically that the lack of risk transfer corresponds with an increase in the bank’s beta, while Hansel and Krahnen (2007) conclude that increase in equity beta is more significant if the issuing bank is financially weak.
Of course, incomplete risk transfer has the same economic effect as replacing a sale with a financing, as per the classical literature above, but masking the condition can disrupt market flow when the terms of the deals are unilaterally altered, such as when non-contractual recourse support is withdrawn.
4. Data
Our initial sample is all available securitization transactions from the Securities Data Corporation (SDC) database from 1970-2002. The SDC data base includes deal specific data such as issuer/entity, ultimate parent, amount being securitized, underlying asset, type of security issued, underwriter/book runner, deal ratings and issuance date. We
omit issues associated with ADRs, REITs, SBIs, and closed-end funds. We also omit issues that are classified as CDO’s.
Our ultimate goal is to identify the first securitization transaction made by each unique issuing company in the SDC database. The identification of the first securitization transaction made by each unique issuer is crucial to our analysis. By identifying the first securitization transaction, we are able to isolate the market’s reaction to the “new” event of securitization for each issuer, allowing us decompose whether the market is associating securitization with financing or leverage. Also examining the first securitization should allow the specific financial and market changes that take place as firms begin the securitization process to be identified. Since subsequent securitizations are likely to be continuations of the issuing firms’ initial funding strategies, they are not likely to be informative.
Each transaction in the SDC database is primarily identified by its issuer. The issuer, however, is in most cases not the ultimate parent company but a bankruptcy-remote intermediate trust subsidiary created by the ultimate parent company.8
SDC provides information on the ultimate parent of each issuer but this information is not always complete. In some instances, the information is just missing. In other cases, the information refers to a publicly-traded parent subsidiary which must be tracked down and linked with the publicly-traded parent. In yet other instances, merger activity affects the meaningfulness of the first recorded securitization. For example, consider the takeover of First Republic Bank of Dallas by Bank of America (BOA) in 1988. If First Republic securitized for the first time following that merger, we discard the
8
Tax law dictates that securitized assets must be doubly-sold to sufficiently remove them from the sponsor firm and achieve bankruptcy remoteness sufficient to justify off-balance sheet treatment. Despite such provisions, relevant de facto bankruptcy treatment is covered above.
observation since BOA, which is the ultimate parent, securitized for the first time on September 21, 1977.
Once we have identified the first securitization transaction made by each unique ultimate parent company we then check the issuing firm’s data availability on CRSP and Compustat. Many of the sponsor firms in the SDC database are firms that do not trade publicly. SDC provides data fields for stock exchange of the ultimate parent, the ticker symbol of the ultimate parent, and the CUSIP of the ultimate parent. Observations that have valid entries for stock exchange and ticker are included in our data. Observations that only have CUSIP available are screened through the CRSP database to see if they have at some point in time been publicly traded. Those that are found on CRSP are included in our data. Those observations without CUSIPS, tickers, and stock exchanges are excluded from the sample.
Having identified those observations to be included in our data set, we search CRSP and Compustat for valid data for each observation. Observations that have no data available from either CRSP or Compustat on the observed first issuance date are excluded.
To ensure that we have identified the first securitization and to identify the actual announcement of the first securitization, all events in the final data set are double-checked on Factiva. We search for the earliest news story relating to securitization around the SDC issuance date for each issuing company. The date of the earliest news story is used as the announcement date for the securitization. We also search prior to the issue date for any news stories that contain words such as securitization and asset-backed to ensure that there were no prior securitizations that did not show up on the SDC data base.
We did not find any observations where there was a securitization related news story prior to the first identified issuance on SDC. If no news stories at all are found, the SDC issuance date is used as the announcement date.
Finally, we identify an issuer as a bank if its first 2-digit SIC code is 60, and discard any bank that was insolvent prior to the first securitization or failed within the time period of 1989-1995, as these transactions might be RTC related. Our final sample has 119 observations.9
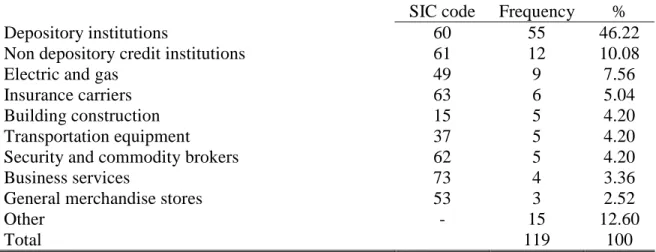
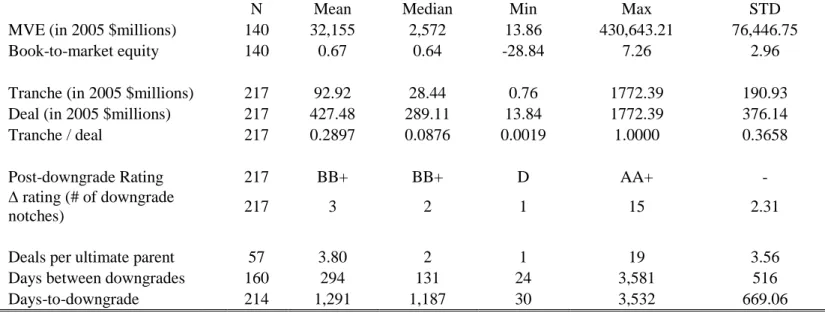
Table 1 contains summary statistics related to our final sample. Panel A of Table 1 introduces several facts regarding our sample. A typical firm that securitizes for the first time is large, with a median market capitalization just shy of $1 billion. The Compustat mean (median) size decile of our securitizers is 8 (9), and roughly 60% of our sample belongs to either decile 9 or 10.10
In addition, the first transaction appears to be an economically significant event, the average deal size being 71% of firm’s market value of equity (13% in terms of asset size). The descriptive statistics for our sub-samples are reported in Panels B and C of Table 1. Banks tend to be larger than non-banks in terms of asset size, yet their market capitalization is smaller. Furthermore, the average deal accounts for 93% of the banks market value of equity (7.15% of asset size), and 51% of non-banks market value of
9 While one might think that extending the sample beyond the end of 2002 might improve the sample size,
there is not much to be had by doing so. First, there are vastly fewer initial securitizations after 2002 because the industry is already well-established. Second, after 2002, firms – especially banks – began securitizing and re-securitizing residual interests in ways that are even less transparent than previously. Even is one might hypothesize there exists a structural shift in the effects of securitization after 2002, there are too few observations upon which to estimate meaningful results and the investigation lies beyond the scope of the present topic.
10
Size deciles are based on Compustat firms that report market value of equity one year prior to the transaction, where decile 10 is the largest and decile 1 the smallest.
equity (18% of asset size). In general, the sample’s descriptive statistics support the view that securitization is associated with large firms that securitize substantial amounts.
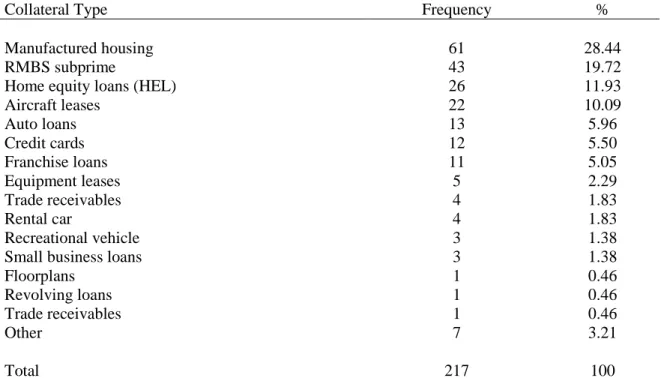
The deal distribution by industry is presented in Panel D of Table 1. Depository institutions are by far the most frequent first-time securitizers, accounting for over 46% of the sample. Non-depository credit institutions, those that engage in extending credit in the form of loans but do not offer deposit banking, are the second most frequent securitizers (10%), with utilities such as electric and gas being third (8%).
5. Empirical Evidence on the Effects of Securitization
5.1. Short term market reaction
To investigate the short term effect of securitization, we conduct an event study around the date on which firms announce their first transaction. The market model is used to estimate market model parameters for an event window of (-1, 1), with the CRSP value-weighted return as the market return. The estimation period runs for 200 days, and ends 11 days before the announcement. We use Factiva to make sure that there are no confounding events during the time of the announcement. From Table 2 we observe that the market reaction for the full sample is negative, but not statistically significant.11 Banks that securitize for the first time, however, experience on average a statistically significant decrease in shareholder’s wealth of 0.75% over the period (-1, 1).12 The short
11 The sample size for the event study is larger (145) because we include all observations with available
data on CRSP. However, in subsequent analyses we only include observations with data on CRSP and Compustat hence the sample size is smaller (118).
run market reaction is stronger if we consider the 54 banks with data availability on both CRSP and Compustat. For the average bank in the sample, the negative reaction of 0.88% (t=-2.07) decreases the market value of equity by almost $14 million over the three-day period.13
5.2. Matching-sample selection
To facilitate the long term market and operating performance analyses, we compare the performance of our securitizers with that of matched non-securitizers, starting one year before and ending three years after the event (-1, +3). Since banks are inherently different from non-banks, we perform a separate matching procedure for each group. For the banking group, we match on industry, asset size, and performance, namely return on equity. We obtain similar results when we use ROA or market-to-book value of equity (MBE) instead of ROE. From the Compustat universe of depository institutions (SIC code 60), we choose the peer with the closest sum of absolute percentage differences in size and ROE. For our non-bank securitizers, we use all the firms on Compustat that are not depository institutions as potential matches. We follow a similar procedure as Billet et al (2006). We identify all peers that trade on the same venue (NYSE/AMEX vs. NASDAQ) as our issuers, and whose market value of equity falls
13
While the documented results of a negative market reaction to the banks’ announcement of securitization is comparable to Lockwood et al. (1996), their sample’s time period of 1985-1992 is largely dominated by RTC transactions that they do not exclude from their data set (see Thomas 1999 for related criticism) and their sample includes repeat securitizations, making it difficult to test for any meaningful impact of
securitization. As noted above, our sample covers a more exhaustive period, 1970-2002, we drop any banks that might have been forced to securitize due to RTC resolution, and we consider only the first act
within 10% of the issuer’s (at year-end prior to the transaction)14. Finally, we choose the peer with the closest sum of absolute percentage differences in size and book-to-market value of equity. In addition to identifying a peer matched sample, we also construct an industry (2-digit SIC code) adjusted sample in which securitizers are excluded from their respective industry starting one year prior to securitization.
For both procedures, our peers are matched in the fiscal year before the transaction (i.e. year -1). We require any peer to show up in our matched sample only once, and that the peer did not securitize for up to three years following the matching. If a non-issuer is delisted from Compustat while the securitizer is still trading, the second-best nonissuing firm is added in on a point-forward basis. If the second peer is delisted, we continue with the third closest match, and so on. However, if the securitizer is delisted during any of the three years following the transaction, we terminate the performance adjusted computation during that year.
5.3. Long term market reaction
In order to investigate the long term market impact of securitization, we calculate the buy-and-hold return (BHR) for our first-time securitizers and their matched peers as
(
∏ 1(1+ )−1)
×100% = = it T t i R BHR i ,where Rit is the ith firm’s return on the tth day, and Ti is the number of trading days in the period following securitization. Once the BHR is calculated, we evaluate the difference between the two such that
14
Barber and Lyon (1997) find that substantial size differences between the event firm and its matched peer would cause both to differ significantly in their equity performance. Hence we limit our size match to 10% or better.
Peer i r Securitize i i BHR BHR DBHR = −
Table 3 presents the peer-adjusted BHR15 results. The full sample’s mean (-28.52%) and median (-9.42%) two-year DBHR are significantly negative, with 95% confidence. The underperformance, which is mainly driven by non-bank securitizers, persists to a lesser degree during the third year as well.
5.4. Long term operating performance
Next, we compare securitizers with non-securitizers in terms of ROA, equity to total assets (EQ/TA), equity to managed assets16 (EQ/MA), ROE, and MBE. We construct the ratio of equity to managed assets (Equity/MA) and follow it for three years (-1, +1). If the transaction took place before June 30th, we define MA0 as total assets in
year 0 plus the securitization proceeds. Similarly, we define MA1 as total assets in year 1
plus proceeds. If on the other hand the transaction took place after June 30th, MA0 equals
total assets, and MA1 equals total assets plus proceeds. Under both scenarios, MA-1
equals total asset in that year. The MA calculation is a conservative estimation since any issuer is likely to continue securitizing following the first event, and as a result have a higher amount of managed assets after year 1.
Table 4A reports the median peer-adjusted performance measures (securitizer’s performance minus peer’s). Overall securitizers perform poorly before and after the transaction, mainly due to the underperformance of non-banks. In Table 4B we report an
15 There are 118 observations in the event study because one of the banks, American Continental Corp, did
not trade on an exchange at the time it securitized.
industry-adjusted operating performance measure.17 We subtract the industry’s median from the securitizer’s ratio in order to obtain the industry-adjusted measure. The results for the full sample are similar to those presented in table 4B, yet this time the underperformance is attributed to banks. Their Equity/TA and Equity/MA are significantly lower then the industry’s median before, during, and after the transaction. While banks tend to have a superior ROE in the year leading to the event, it deteriorates thereafter. Finally, MBE provides some evidence on the level of financial distress that banks experience. In the two years leading to the first securitization, banks outperform their industry. However, in the two years following the event, signs of distress appear as the ratio of MBE deteriorates, before it improves back again in the third year following the event.
5.5. Securitization and risk
Up to this point, we have established that the initiation of securitization is associated with a negative market reaction along with poor long-term stock and operating performance. This section investigates the impact of securitization on the issuer’s level of risk. To this end, we compute three measures of firm risk as suggested by Anderson and Fraser (2000), and test whether they are significantly different following the transaction. We estimate each measure for a period of one year before and one year after the event, without including the 10-days surrounding the event. We define total risk as the standard deviation of the firm’s daily stock returns. Firm specific risk is measured as the standard
17
Cornett, Ors, and Teharanian (2002) examine industry-adjusted operating performance of BHC that established a Section 20 subsidiary to conduct investment banking activities. We include a similar industry-adjusted measure for comparison.
deviation of the residuals from the market model for each firm. Finally, systematic risk is the difference between firm’s total and specific risk. It measures the influence of underlying economic and financial conditions that affect all firms. Specifically, our risk measures are obtained as follows:
Total Risk = 1
∑
(x −x)2 =σ
n i (1)
where xi is the securitizer’s daily return and x is the expected market return. Following from (1),
Firm specific risk = 1
∑
(ε
i −ε
)2 =ε
n (2)
where
ε
’s are the residuals of the single-index market model, constructed using the CRSP equally-weighted returns so that:i
R =αi +βi(Rm)+εi
Firm systematic risk = Total risk – Firm specific risk (3) The systematic risk, however, still needs to take account of leverage. While securitizing firms’ accounting (on-balance sheet) leverage may not change (or may decline), the securitizing firm’s implicit leverage (as measured by total assets under management) increased. In order to obtain implicit leverage, we utilize the Hamada (1969) equation such that
(
)(
T)
E D D U U L =β
+β
−β
1−β
(4)First we use the standard market model to estimate
β
prior to securitization for a period of one year, without including the 10-days prior to the event. This is essentially an estimation of the levered beta, orβL,prior. Next, we obtain the unlevered beta, or βU, fromequation (4) by using the estimatedβL,prior, the book value of debt-to-equity, and the appropriate corporate income tax bracket (T). We assume debt is risk-less. Finally, we use the market model to estimate the one-year post-eventβL,post. We use equation (4) and the information onβL,post,βU and T to calculate the implied D/E ratio after securitization and compare it to the accounting D/E ratio. An implied D/E ratio higher than the accounting D/E ratio indicates that the increase in systematic risk is due to implicit leverage rather than other factors.
From panel A of Table 5 we observe that for all securitizers there is a significant increase in all three risk measures following the first securitization. The mean (median) increase in firm’s total risk is roughly 20% (7%), while the increase in systemic risk is more pronounced at about 35% (20%). The changes are highly significant in both the mean and median levels. The increase in systematic risk is even more profound for our banks sample. For the median bank that securitizes for the first time, systematic risk goes up by 66%, an increase that is highly significant at the 1% level. As an alternative measure of a change in systematic risk, we calculate the pre- and post- transaction beta for our securitizers using a standard market model, and test for the significance of the difference. The results for banks indicate that there is a significant increase in systematic risk, as proxied by the increase in their beta. Finally, non-banks exhibit a significant increase in total risk of 17% (6%), driven by an average increase in firm specific risk of 16%, yet neither their systematic risk nor their beta changes significantly.
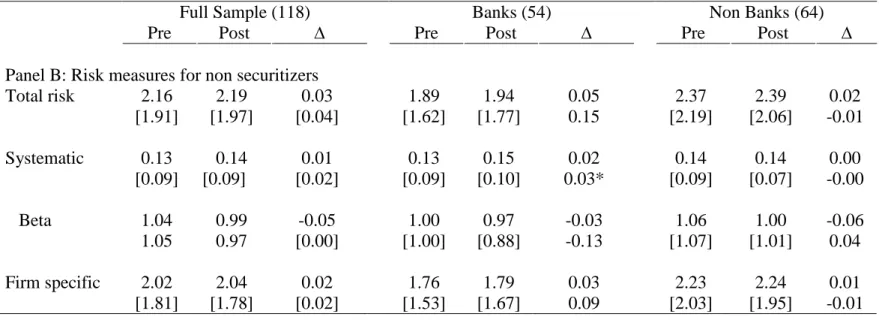
If the documented increase in banks’ systematic risk is due to securitization, then a natural prediction would be that systematic risk should remain unchanged for banks that do not securitize. To test this prediction, we perform similar analysis on our matched
non-securitizers. From panel B of Table 5 we learn that none of those risk measures changes during that time period.
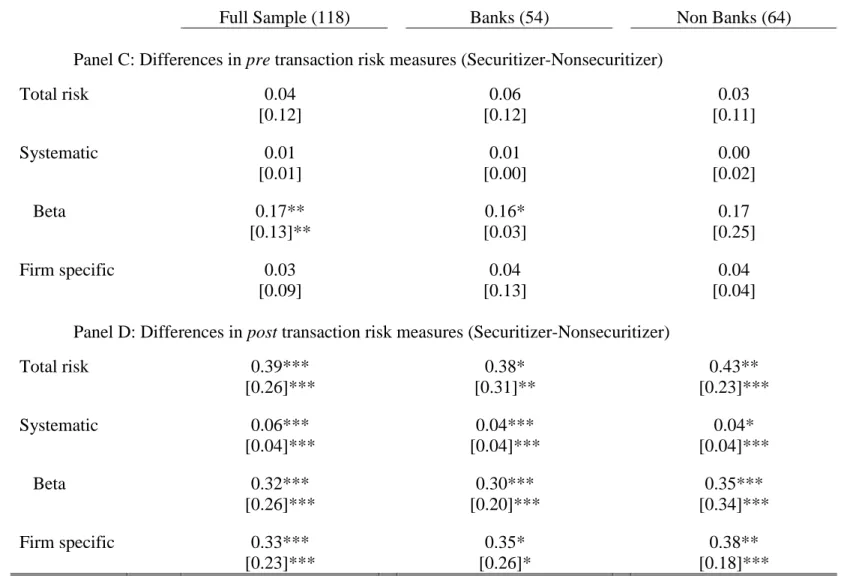
While the first part of Table 5 introduces the differences in performance measures within each group, the second part introduces the differences between securitizers and non-securitizers before and after the event. Overall, panel C illustrates that pre-event securitizers are not riskier than non-securitizers. However, after securitization there are big differences between the two. Following the event, we observe in panel D that securitizers exhibit a significant increase across all risk measures as compared with non-securitizers. Specifically, systematic risk is higher for banks that securitize, whereas both systematic and firm specific risks are higher for non-banks that securitize, as compared with non-banks that do not securitize.
The conclusion from Table 5 is that first-time securitizers, specifically banks, experience a significant increase in systematic risk after securitization. Table 6 relates that finding with implicit leverage. By using the Hamada equation, we show that implicit leverage is higher than accounting leverage for securitizing firms. Banks have the most dramatic difference, with implicit D/E ratios higher than accounting D/E ratios by an average of 20%. Hence we can conclude that the increase in systematic risk for banks is driven by an increase in implicit leverage. Hence, securitization is more like a financing than a sale.
6. Multivariate Analysis
So far results have indicated that securitization has a negative impact on first time securitizers. Banks experience negative market reaction, perform poorly relative to their industry, and suffer from a significant increase in total and systematic risk. Non-banks underperform in terms of long-term BHR and peer-adjusted measures, and experience an increase in firm specific risk. One question that comes into mind is whether any firm or deal characteristics can explain the above results. To that end, we use a multivariate setting to investigate any residual relationships.
6.1. Sample selection bias
A firm’s decision on whether to securitize may not be random. Sample selectivity bias can cause the error terms in a given model to be correlated, thus biasing the estimated parameters. We implement Heckman’s (1979) two-stage procedure to overcome self-selection bias created by a firm’s choice to securitize, by incorporating the securitization decision in to the econometric estimation. In the first stage the decision to securitize is estimated using a probit model. In the second stage we control for self selection by including the inverse Mill’s ratio, obtained from the probit model. The potential securitization determinants that we control for are firm type (dummy=1 if bank), the ratio of equity/assets, an interaction term bank*(equity/assets), the three year pre-transaction (t-3 to t-1) average growth rate in assets, an interaction term bank*(Growth rate), and year dummies.
Banks are more likely to securitize because it allows them to meet regulatory requirements (Rosenthal and Ocampo, 1988), reduce interest rate risk, and focus on activities in which they have a comparative advantage. Firm size is expected to be positively correlated with securitization as well. Given the large fixed costs associated with each transaction, larger firms are more likely to afford them. The growth rate in assets is also expected to be positively correlated with securitization. Banks are required to maintain an adequate capital ratio. Since capital is expensive, banks that experience growth in assets are more likely to move them off-balance-sheet through securitization (Calomiris and Mason, 2004). The positive relation is also expected to hold for non-banks. The reason is that through securitization, non banks can diversify their asset funding sources, and obtain funds cheaper than through straight debt or stock issuance.
The equity/assets ratio is expected to be inversely related with the decision to securitize. Poorly capitalized banks are likely to securitize so that they can meet regulatory capital requirements. The negative relation should hold for non-banks as well, as equity/assets can proxy for excessive risk taking. According to Hill (1996), securitization should be more valuable for riskier companies, for which other sources of funds are more expansive.
We combine each first-time securitizer with all public firms in its respective industry (2-digit SIC code) in year t-1, and report the first-stage probit estimations on the decision to securitize in Table 7 for the full and sub-samples (banks and non-banks). Size is the most prominent variable affecting the first-time decision to securitize. Furthermore, the growth rate in assets is a significant determinant for banks. The bank dummy variable
is negative but insignificant, while the capital ratio has the expected negative signs, but it is not a significant determinant of securitization initiation
6.2. OLS estimation
In the second stage we use OLS estimation to investigate the relation between the documented poor performance and any firm or deal characteristics. At the same time, we control for selection bias by including the inverse Mill’s ratio obtained in the first-stage probit model. The firm characteristics that we control for are firm type (bank or non-bank), the ratio of equity to total assets, the three-year average growth rate in assets, and firm size. We include the interaction term bank*(equity/assets) to control for the possibility that well capitalized banks perform better than others.
The deal characteristics that we control for are deal size, underwriter’s rank, deal’s rating, and the type of underlying asset. We use the natural log of the deal’s proceeds to control for deal size. Other measures such as proceeds scaled by assets or proceeds scaled by market value of equity yield similar results. We employ a dummy variable, prestigious underwriter, which controls for underwriter reputation. It takes the value of 1 if the underwriter’s rank is equal to or greater than the sample’s median.18 We use a dummy variable to control for the securitization’s highest rated bond by either S&P or Moody’s, which equals 1 for a triple-A rated senior tranche.19 Finally, the
18 We use Jay Ritter’s updated IPO underwriter reputation available on his website at http://bear.cba.ufl.edu/ritter .
19Converting credit rating by S&P (Moody’s) into a numerical number such that AAA (Aaa) corresponds to
a value of 23, AA+ (Aa1) is equal to 22, etc. and an unrated deal (NR) has a value of 1 does not change the results. We prefer the dummy indicator over the numerical specification because there is little rating variation. Almost 85% of our sample senior tranches are AAA rated.
related dummy controls for the type of transaction, specifically, if it relates to CMO, mortgage backed bond, or mortgage backed note.
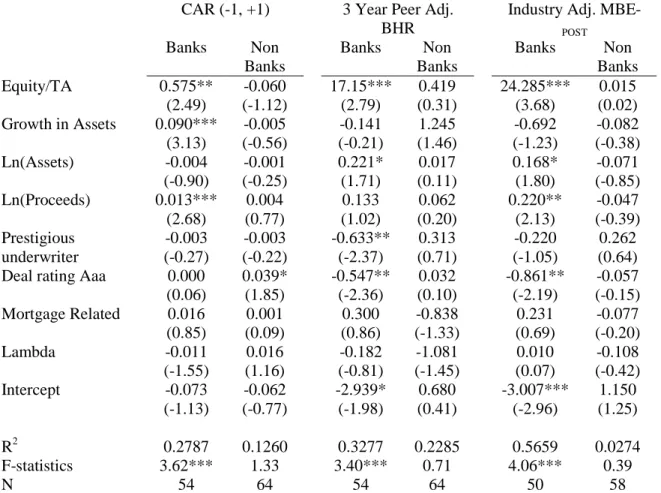
The first set of regressions presented in table 8 relates stock performance with the various firm and deal characteristics. Similarly to the univariate analysis, banks experience a negative three-day CAR to their first securitization announcement. The bank coefficient of -0.064 is significant at the 1% level. However, the positive coefficient on the interaction term bank*(equity/assets) of 0.518 (t = 2.22), suggests that investors are aware of a bank’s ability to engage in excessive risk taking, as the market reaction to the announcement by a well capitalized banks is more favorable. Furthermore, favorable market reactions are also associated with banks that exhibit higher growth rates (t=2.80), indicating the importance of capital relief for those banks.
There is also evidence that capital plays a significant role in the long-term stock performance of first-time securitizers, as observed in the 3 year peer-adjusted BHR results. Specifically, the coefficient on the bank*(equity/assets) term of 13.34 is significant at the 5% level (t=2.36). The coefficient’s economic significance indicates that a one standard deviation increase in the capital ratio of first-time securitizing banks is associated with a 28% improvement in their long-term stock performance, relative to similar banks that do not securitize20. It is interesting to note that the initial decision to securitize is negatively related to the 3-year peer adjusted BHR and the self-selection indicator, lambda, is negative and marginally significant at the 10% level. Finally, the 3-year average post transaction industry adjusted market-to-book value of equity (MBE) is significantly lower for banks, but higher for well-capitalized banks.
20
The standard deviation for our bank sample equity/assets is 0.021. Thus, the effect of a one standard deviation change in equity/assets ratio on the peer-adjusted BHR is 13.34*0.021=0.2803.
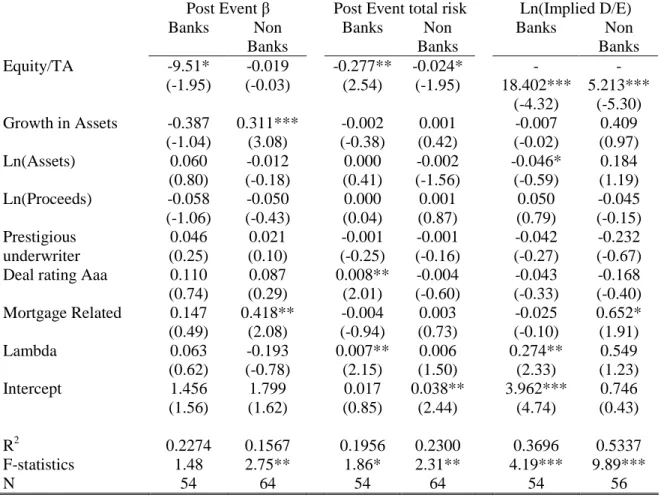
From the full sample regressions, it is obvious that the stock performance of banks differs significantly from that of non-banks. To better understand those differences, we run the same regressions on these sub-samples and report the results in panel B of table 821. Under this setup, the capital ratio for banks is directly related to stock performance. A one standard deviation increase in that ratio is associated with a 1.20% increase in the three-day CAR. Given that the average market capitalization of our bank sample is $1.55 billion, this translates into an $18.6 million three-day announcement gain. The 3-year peer-adjusted BHR is significantly stronger for well capitalized banks, but higher-rated securitizations hurt long-term performance. The coefficients on both the Aaa deal rating and prestigious underwriter dummies are significantly negative at the 5% level. The rating dummy suggests that sponsor performance deteriorates with greater credit enhancement. The significance on the prestigious underwriter dummy can be explained similarly, as prestigious underwriters are likely to be involved with transactions with greater credit enhancements. Finally, the long-term industry adjusted MBE is significantly higher for well capitalized banks.22
In Table 9 we investigate the implication of securitization on risk. Post event beta is higher for banks, overall, but lower for well capitalized banks yet neither coefficient is statistically significant. Surprisingly though, the decision to securitize is associated with a lower beta (lambda = -0.531, t=-3.72). The sub-sample settings in panel B reveals that beta is marginally lower for well capitalized banks (t=-1.95). For non-banks, the growth rate is positively correlated with beta. For either sub-sample, lambda has no effect on
21 For panel B in both tables 8 and 9 we use the self-selection indicator (lambda) that was estimated using
the sub-samples in table 7.
22
Using the peer-adjusted MBE instead of the industry adjusted ratio provides similar results regarding the importance of the capital ratio.