The Effect of Dollarization on the Growth of Non-Performing
Loans in the Zimbabwe Banking System: An Autoregressive
Distributed Lag (ARDL) Bound Test Approach
Paul GV Mukoki Alexander MapfumoGreat Zimbabwe University, Masvingo, Zimbabwe Abstract
This research evaluates the effect of dollarization and internal bank factors that caused unprecedented high levels of non-performing loans (NPLs) in the Zimbabwe banking system. In examining the surrounding issues, recommendations are made, which might resolve or at least ameliorate Zimbabwe’s NPLs problem. The study employed an autoregressive distributed lag (ARDL) bound test procedure by making use of the financial soundness indicator data for a Zimbabwe banking system for the period 2000-2014 on a quarterly basis. Empirical findings indicated that the dollarization has no influence on the growth of NPLs both in the short and long run. Among bank fundamentals, however, liquidity, return on equity, efficiency and interest rate spread proved to be prominent bank-specific determinants of NPLs. The findings also suggest that return on equity and NPLs from previous period are positively related to current levels of NPL. On the other hand, however, liquidity, cost efficiency and interest rate spread variables in the long-run were found to have a negatively significant impact on NPLs.
Keywords: banking system, non-performing loans, dollarization, ARDL, Zimbabwe INTRODUCTION
A well-developed banking system allows for competition that impacts on interest rates and has an undoubtedly positive effect on investment activities that generate economic growth (Sontakke and Tiwari, 2013). The importance of the banking systems in contributing to economic development has been magnified in recent studies, which has shown that banks' performance and profitability contribute to the countries' development (Levine, 1997).
The general view is that higher and sustainable real GDP growth usually translates into more income which, in turn improves the borrowers capacity to service the debt. There is, however, significant empirical evidence regarding the behaviour of the non-performing loans (NPLs) which are considered anti-cyclical. Conversely, when there is a slowdown in the economy the level of NPLs is likely to increase as unemployment rises and borrowers face greater difficulties to repay their debt (Fofack, 2005; Jimenez and Saurina, 2005; Rajan and Dhal, 2003;and Salas and Saurina, 2002).
NPLs have, therefore, often been related to bank failures and financial crises in the world and are part of the measurement of asset quality among lending institutions (Guy, 2011). The benchmarks used for identifying NPLs are more varied across Sub-Saharan Africa wherein some countries use quantitative criteria to distinguish between ‘‘good’’ and ‘‘bad’’ loans (for example, the number of days of overdue scheduled payments), while others rely on qualitative norms (such as the availability of information about the client’s financial status, management ratings and perspectives about future payments) (Fofack, 2005).
BACKGROUND
Banks’ main roles are to serve as the catalysts for savings mobilisation in the economy on the one hand and financing of investment and economic activity (both productive and consumptive) on the other, as well as being the platform of transmission of financial impulses across and among internal sectors, and propelling Zimbabwe’s interface with the rest of the world’s economic and financial systems (Makina, 2009).
Since the liberalization of the Zimbabwe economy in the late 1990’s, there have been significant changes in the structure of the banking sector (Chigumira et al. 2014). In the 1990s following liberalization of the financial sector, there was a credit boom in which loans were issued without proper risk assessment or appropriate valued collateral. As a tightening of monetary policy to curtail high bouts of inflation during the period there was a reduction in aggregate demand which caused a slowdown in economic activity.
The reduction in economic activity resulted in the poor servicing of loans which caused a spike in NPLs. NPLs/Loans ratio peaked to levels never seen before. In 2003-2005 at the crescendo of the Zimbabwean financial crisis, many commercial banks became insolvent. By end December 2004 NPLs reached a staggering 28.9 percent (RBZ, 2005). The dramatic expansion of the banking sector in the late 1990’s culminated with the financial sector crisis, leading to the closure of a number of banking institutions.
The turbulence in the Zimbabwean financial sector on the back of serious liquidity shortages during the last quarter of 2003, necessitated the introduction of the Troubled Banks Fund (TBF) in December 2003
with the aim of safeguarding and minimising disruptive medium-term liquidity mismatches, RBZ (2006). The TBF served as a contingent pool from where banks that faced liquidity challenges accessed funding to stabilise their operations.
The thrust was to ensure financial stability while the affected institutions put in place corrective and remedial measures to address the liquidity challenges. Banks that accessed the TBF were required to operate under close supervision by the Reserve Bank and also to provide a plan of measures to resolve their liquidity challenges
The monetary policy statement issued on 18 December 2003 marked a turning point for the Zimbabwean financial services sector. Amid fears of a deeper financial crisis to the whole banking industry through systemic risk, the Reserve Bank embarked on rigorous effort to instil discipline and bring sanity into the financial sector. Some banking institutions were found to be unsafe and unsound, such that NPLs rose from about 15% in 2000 to nearly 30% in 2004. Resultantly, in 2004 nine financial institutions were placed under curatorship (RBZ, 2004). From the period March 2005 to December 2008, the banking sector, however, witnessed a decline in NPLs from 22.84% to 5.695, respectively. Figure 1 shows how NPLs have evolved since 2000.
Figure 1: Evolution of NPLS from 2000 to 2014
Source: RBZ (2014)
After the adoption of the multicurrency system in February 2009 by the Zimbabwe Government, some measure of confidence was restored in the banking sector, as measured by the phenomenal increase in deposits from as low as US$300 million in 2009 to US$4 billion in 2013 (RBZ, 2014). During the same period, however, NPLs in Zimbabwe, increased significantly and rate of growth in loans also declined. The rate of NPLs increased from below 2% in March 2009 to above 20% by September 2014, in tandem with the decline in real economic growth from 11.4% recorded in 2010 to an estimate of 3.1% in 2014, (MOFED, 2014). The high levels of NPLs also reflect the lack of cooperation among banks in sharing customer information and the absence of a credit reference bureau, according to the RBZ (2014).
This study is motivated by the desire to fill a gap that exists in the literature on studies that examine the relationship between dollarization and banking sector performance and to establish a causal relationship. Literature relating to the causal relationship in Zimbabwe, is, however limited, as such, this study is expected to contribute to literature by providing insights into the effect of dollarization on banking sector performance using a quantitative approach. Recent studies using qualitative methods on the effect of dollarization on Zimbabwe banks performance were done by Chikoko (2012, 2013 and 2014) who investigated commercial banks’ credit process with the objective of understanding the fundamental causes of asset impairment and also the potential sources and determinants of liquidity risk after dollarization whilst Mabvure (2012) undertook to understand the causes of NPLs at a specific commercial bank.
LITERATURE REVIEW
There are three elements of literature on NPLs as noted by Tracey (2011). The first focuses on the role of macroeconomic performance, and the management quality and policy choices in explaining NPLs across banks. The second element of literature examines the impact of micro-financial conditions on NPLs by highlighting the positive impact of NPLs on the probability of banking crisis, supported by Kaminsky and Reinhart (1999) who established that a large increase in NPLs could be used to predict a crisis. Finally, the third branch of literature focuses on predicting NPL at the macroeconomic level from aggregate NPL ratios.
Louzis et al. (2011), pointed out that the unique features of the banking sector along with the specific policy choices by individual banks in respect with efforts to maximize efficiency and improve in its risk management are expected to exert a vital influence on the evolution of NPLs.
Khemraj and Pasha (2009) examined the determinants of NPLs for Guyana, using a panel dataset and a fixed model. They were interested in determining the relationship between NPLs and bank specific variables namely, loans to total assets ratio, bank size, real interest rate and annual growth in loans. Their findings indicated that banks which charge relatively higher interest rates and lend excessively are likely to incur higher levels of NPLs.
Messai and Jouini (2013) conducted a study to detect the determinants of NPLs for a sample of 85 banks in three countries (Italy, Greece and Spain) for the period of 2004 to 2008. They employed some bank specific variables to the bank in their study. The bank specific variables which were used include the return on assets, the change in loans and the loan loss reserves to total loans ratio. Their findings indicted that NPLs vary negatively with the profitability of banks’ assets and positively with the loan loss reserves to total loans.
Employing a balanced panel framework and utilizing quarterly data from six commercial banks in Barbados over the period 1996 to 2010, Guy and Lowe (2012) found that both macro and micro variables are critical to understanding the behaviour of NPLs. The research reviewed that the loan-deposit ratio, though insignificant, had a positive impact on NPLs in the same period, but has an alternating effect in later periods. Real GDP growth was proved to be significant in the model, with economic expansion reducing loan delinquency contemporaneously and with a lag of 1 year.
Tiffany and Kester (2011) also examined NPLs and bank stability in Barbados. They used a series of bank idiosyncratic variables to explain NPLs. The study employed a balanced panel framework, utilizing quarterly data from six commercial banks over the period 1996 to 2010. Using panel data techniques, the relationship between bank stability and NPLs was examined at the aggregate as well as the individual bank level. The idiosyncratic variables that were included in the study were the return on asset ratio, loans to deposit ratio and loan growth. Their findings suggested that micro variables are critical to understanding the behaviour of NPLs. The loan growth and loans to deposit ratio (risk appetite proxies) were considered to drive NPLs as more aggressive lending patterns attracted less qualified borrowers. These findings by Tiffany and Kester (2011) are in tandem with Guy and Lowe (2012) who found that the loan-deposit ratio, though insignificant, had a positive impact on NPLs.
Espinoza and Prasad (2010) using a dynamic panel estimated over 1995–2008 on around 80 banks in the Gulf Cooperative Council (GCC) region found that the NPL ratio worsens as economic growth becomes lower and interest rates and risk aversion increase. Also, firm-specific factors related to risk-taking and efficiency were also found to be related to future NPLs. Using panel VAR, the researchers noted that there could be a strong, albeit short-lived feedback effect from losses in banks’ balance sheets on economic activity.
Investigating the relationship between NPLs and bank efficiency in Malaysia and Singapore, Karim et al, (2010) estimated cost efficiency using the stochastic cost frontier approach assuming normal-gamma efficiency distribution model proposed by Greene (1990). The Tobit simultaneous equation regression was then used to determine the effect of NPLs on bank efficiency, incorporating the cost efficiency score. The results indicated that there was no significant difference in cost efficiency between banks in Singapore and Malaysia although banks in Singapore exhibit a higher average cost efficiency score. The Tobit simultaneous equation regression results, therefore, indicated that higher non-performing loan reduces cost efficiency. Likewise, lower cost efficiency increases NPLs. The result also supported the hypothesis of bad management proposed by Berger & DeYoung (1997) that poor management in the banking institutions results in bad quality loans, and therefore, escalates the level of NPLs. Bercoff et al. (2002) also showed that operating efficiency helps explain NPLs.
After controlling for macroeconomic factors, Sinkey et al. (1991), found that bank-specific variables such as loan return, volatile-fund ratio and loan to asset ratio positively impact credit risk in large commercial banks in the United States of America. Other studies have indicated that loan delinquencies are associated with rapid credit growth. Keeton (1997) who used data from commercial banks in the United States (from 1982 to 1996) and a vector auto regression model indicate this association between loan and rapid credit growth. Salas and Saurina (2002) who studied Spanish banks found out that credit growth is associated with NPLs. Study by Bercoff et al. (2002) also shows that asset growth explains NPLs.
A study by Warue (2013) on the effects of Bank specific and macroeconomic factors on NPLs in commercial banks in Kenya using a comparative panel data analysis found evidence that bank specific factors contribute to NPLs performance at higher magnitude compared with macroeconomic factors. Therefore, for effective management of NPLs, the study concluded that it is critical for commercial banks to understand and focus more on the management of bank specific factors which they have more control over and seek practical and achievable solutions to redress NPLs problems.
Chikoko et al. (2012) studied the gradual deterioration in asset quality as reflected by the NPLs in 15 commercial banks in Zimbabwe after the adoption of the multiple currency exchange rate regime using a survey
research design method. The research findings showed that due to poor credit analysis processes banks were housing a huge portion of nonperforming loans; bank clients were being given wrong products; lending based on balance sheet strength made up of illiquid assets instead of cash flow based lending; comfort in security tendered as collateral; moral hazard due to information asymmetry; economic environment and political influence.
MATERIALS AND METHODS
Data Sources and Type: Statistics on the banking sector in Zimbabwe will be collected from the Reserve Bank of Zimbabwe (RBZ)’s Bank Licensing, Supervision and Surveillance (BLSS) Quarterly Reports for the period March 2000 to September 2014. The International Monetary Fund (IMF) annual Article IV Consultation Reports on Zimbabwe covering the period 2009 to 2014 will also be used to supplement some of the missing information from the BLSS’s Quarterly Reports.
Model Specification: In this study we employ an autoregressive distributed lag (ARDL) econometric model that is similar to Jimenez and Saurina (2005) formulation to ascertain the effect of dollarization and bank specific determinants of NPLs in the Zimbabwe banking sector. The ratio of NPLs of the banking sector will be the dependent variable whereas bank capitalization, return on asset, loan provision, dollarization, expense to income ratio, liquidity, profitability, as well as interest rates spread will be the independent variables.
The derivation of the ARDL model follows the assumption by Pesaran et al. (2001) Case III with unrestricted intercept and no trend, and the statistical package to handle the investigation is E-views version 8. The bounds test seeks to determine whether or not there is a long run relationship amongst the variables by testing the F-statistic that is generated against the critical values that were stated by Pesaran et al. (2001). The estimated conditional ARDL model will be defined as follows:
Where represents the NPLs when all the explanatory variables are equal to zero, NPL represents
NPLs, LR represents the liquidity ratio, CAP represents capitalization, ROE, the return on equity represents profitability, SPD represents the interest rate spread, EFF, bank efficiency proxies the expense to income ratio and PROV represents the loan loss provision coverage ratio. DLD is the dummy variable representing dollarization. Its values are zero for the period before dollarization and one for the period with dollarization. All variables are expressed in their natural logarithms, except for the dummy variable.The short run dynamics are reflected by the variables with summation signs.
These short run variables represent the significant lags of the explanatory variables. The long run effects are represented by the explanatory variables with βs. The Greek symbols ∆ represent the change in the dependent variable due to a percentage change in the explanatory variables. εt represent those changes in NPLs
that are explained by other random and immeasurable effects.
Therefore, firstly, equation (1) is estimated using the ordinary least squares (OLS). Then the test for a long run relationship amongst the variables is conducted using the Wald test for the joint significance of the coefficients of the lagged level variables (H0: β1= β2= β3= β4= β5= 0). The computed F-statistic value is then
evaluated against the critical values tabulated by Pesaran et al. (2001).
If the generated F-statistic is greater than the upper bound critical value, this means that the variables are co-integrated, that is, they are related in some way or are moving together in the long-run. If the generated statistic is lower than the lower critical value it shows that the variables are not co-integrated. However, if the F-statistic is in-between the critical bound, then the result is inconclusive and other co-integration tests may need to be used. If the variables are found to be co-integrated, hence a long run relationship exists and an Error Correction Model (ECM) can then be estimated.
The ECM will be stated as follows:
Variables used in the Model
In this study, the NPLs of the banking sector is the dependent variable, measured using the ratio of gross loan provisions to total loans. Table 1 below presents the variable concepts, expected signs and data measurement.
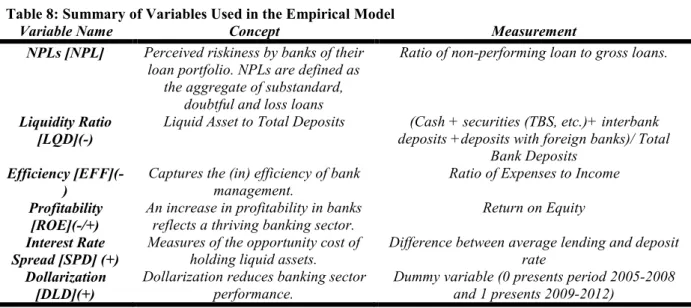
Table 8: Summary of Variables Used in the Empirical Model
Variable Name Concept Measurement NPLs [NPL] Perceived riskiness by banks of their
loan portfolio. NPLs are defined as the aggregate of substandard,
doubtful and loss loans
Ratio of non-performing loan to gross loans.
Liquidity Ratio [LQD](-)
Liquid Asset to Total Deposits (Cash + securities (TBS, etc.)+ interbank deposits +deposits with foreign banks)/ Total
Bank Deposits
Efficiency [EFF](-)
Captures the (in) efficiency of bank management.
Ratio of Expenses to Income
Profitability [ROE](-/+)
An increase in profitability in banks reflects a thriving banking sector.
Return on Equity
Interest Rate Spread [SPD] (+)
Measures of the opportunity cost of holding liquid assets.
Difference between average lending and deposit rate
Dollarization [DLD](+)
Dollarization reduces banking sector performance.
Dummy variable (0 presents period 2005-2008 and 1 presents 2009-2012)
Source: International Monetary Fund (2004), Financial Soundness Indicators – Concepts and Definitions; and Staikouras, C. K. and Wood, G. E (2003): “The Determinants of European Bank Profitability.”
Non-Performing Loans [NPL]: The presence of credit risk requires the bank to put a risk premium in the interest rates charged on the credit extended (Fernandez de Guevara and Maudos, 2004). Staikouras and Wood (2003) state that an ideal measure for credit risk is the value of NPLs as the numerator and the total gross value of the loan portfolio as the denominator. This is used as a proxy for asset quality and is intended to identify problem with asset quality in the loan portfolio
Profitability [ROE]: The European Central Bank (ECB, 2010) defines bank performance in terms of its capacity to generate sustainable profitability. In this study, return on equity (ROE) will be used as a measure of profitability and is intended to measure how well a bank’s management is deploying the shareholders' capital. Therefore, ROE is more than a measure of profit; it's a measure of efficiency. A rising ROE suggests that a bank is increasing its ability to generate profit without needing as much capital. In other words, the higher the ROE the better and falling ROE is usually undesirable.
Efficiency [EFF]: The efficiency ratio is defined as ratio of bank’s operating expenses to its income and measures the (in) efficiency of bank management. In their seminal paper, Berger and DeYoung (1997) investigated the existence of causality among loan quality, cost efficiency and bank capital. In their study, two hypotheses were formulated as follows:
‘Bad management’ hypothesis: low cost efficiency is positively associated with increases in future NPLs. The proposed justification links ‘bad’ management with poor skills in credit scoring, appraisal of pledged collaterals and monitoring borrowers.
‘Skimping’ hypothesis: high measured efficiency causes increasing number of NPLs. According to this view, there exists a trade-off between allocating resources for underwriting and monitoring loans and measured cost efficiency. In other words, banks which devote less effort to ensure higher loan quality will be more cost-efficient, however, there will be a burgeoning number of NPLs in the long-run. Dummy Variable - Dollarisation [DLD]: According to Levine et al. (1997), there are variables that can play a very important role in the explanation of an econometric model that are not numerical or easy to quantify. Thus, a dummy or indicator variable is an artificial variable created to represent an attribute with two or more distinct categories or levels. Therefore, a dummy independent variable (also called a dummy explanatory variable) which for some observation has a value of 0 will cause that variable's coefficient to have no role in influencing the dependent variable, while when the dummy takes on a value 1 its coefficient acts to alter the intercept. In this study, the time period with dollarisation, March 2009 to September 2014 is represented by 1s and 0s otherwise. Interest Rate Spread [SPD]: This represents the difference between the average deposit rate and the average lending rate. Interest rate spread is also an indication of earnings and underlying profitability of bank and can also be used as a gauge of competitiveness within the banking sector. According to Collins et al. (2011) interest rate spread affect performing assets in banks as it increases the cost of loans charged on borrowers. Nampewo (2012) also found that NPLs significantly and positively affect the interest rate spreads.
Liquidity Ratio [LQD]: The liquidity ratio is the ratio of liquid assets to total deposits. Quispe-Agnoli and Whisler (2006), highlight that some of the prudential norms in dollarized banking systems to reduce liquidity risk entail maintaining higher liquidity reserve requirements. These in turn reduce banks’ profits since banks have to hold more liquid assets which earn little to no return. Thus the liquidity ratio is expected to be negatively related to NPLs.
RESULTS
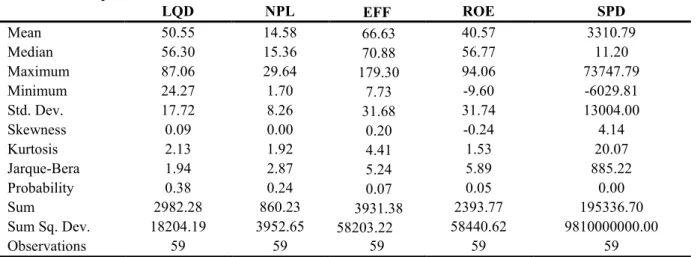
Descriptive statistics: These are used to describe the basic features of a sample one is working with, and can also show data anomalies as well as any patterns emerging from the data. The descriptive statistics include mean, standard deviation, the measures of skewness and kurtosis. These statistics enables the analysis of normality of the variables. Table 2 below shows the descriptive statistics for the variables used in the study:
Table 9: Descriptive Statistics
LQD NPL EFF ROE SPD Mean 50.55 14.58 66.63 40.57 3310.79 Median 56.30 15.36 70.88 56.77 11.20 Maximum 87.06 29.64 179.30 94.06 73747.79 Minimum 24.27 1.70 7.73 -9.60 -6029.81 Std. Dev. 17.72 8.26 31.68 31.74 13004.00 Skewness 0.09 0.00 0.20 -0.24 4.14 Kurtosis 2.13 1.92 4.41 1.53 20.07 Jarque-Bera 1.94 2.87 5.24 5.89 885.22 Probability 0.38 0.24 0.07 0.05 0.00 Sum 2982.28 860.23 3931.38 2393.77 195336.70 Sum Sq. Dev. 18204.19 3952.65 58203.22 58440.62 9810000000.00 Observations 59 59 59 59 59
Source: Eviews 8.0 – Own Calculations
The Jarque-Bera test, tests whether the distribution that the data comes from is a normal distribution. The null hypothesis for this test is that the data is normally distributed.From table 2 above, the Jarque-Bera statistics for the variables under study show that efficiency, return on equity ratio and interest rate spread variables are not normally distributed at 5% level of significant. This may reflects the presence of outliers such that the average spread in the period 2000 to 2007 was about 220%, in 2008 the spread averaged above 50 000% and then after the adaptation of multi-currency system the average interest rate spread is about 4.5%. The non-normality of these variables will be dealt with by transforming the data into logarithmic form.
Even though the average NPL ratio for the period under consideration is 14.85%, the variance of NPLs is very high at 68.23%, which implies that good banks fare better but bad banks are in worse position. These banks, whilst very few have the most serious and sticky bad loan problems, which if left unattended are likely to become much worse impacting adversely the whole banking sector through systemic risk.
Unit Root Test: For this study, the unit root test used was the ADF test. Engle and Granger (1987) contends that a reasonable regression can only be done only when all variables are stationary. The ARDL approach, however, does not require unit root tests of variables but, unit root testing may show the order of integration for each variable. The Augmented Dickey Fuller (ADF) test was used to test the variables for the presence of a unit root. Table 3 below shows the results of the unit root test.
Table 10: Unit Root Test for Stationarity
Variable ADF t-Statistic Overall Decision Rule
In Levels First Difference
EFF -2.109176 -11.64273*** Stationary @ I(1)
LQD -0.804409 -4.242952*** Stationary @ I(1)
NPL -1.299947 -2.031398** Stationary @ I(1)
ROE -0.954366 -7.317347*** Stationary @ I(1)
SPD -3.365743*** Stationary @ I(0)
*(**) [***] Statistically significant at a 10 (5) [1] % level
The unit root test above reflects that all the variable except the interest rate spread variable are stationary after first difference, that is they are integrated of first order, I(1). The interest rate spread is stationary at level, that is I(0). Therefore, the study will employ an ARDL approach to co-integration because unlike the Johansen and Julius (1990) co-integration method, which requires that all variables be integrated of the order one, bounds testing is more flexible as it allows I(0) and I(1) variables to be combined. This technique is also suitable for small and finite sample sizes (Pesaran, et al. 2001), which is ideal for our sample of 59 observations.
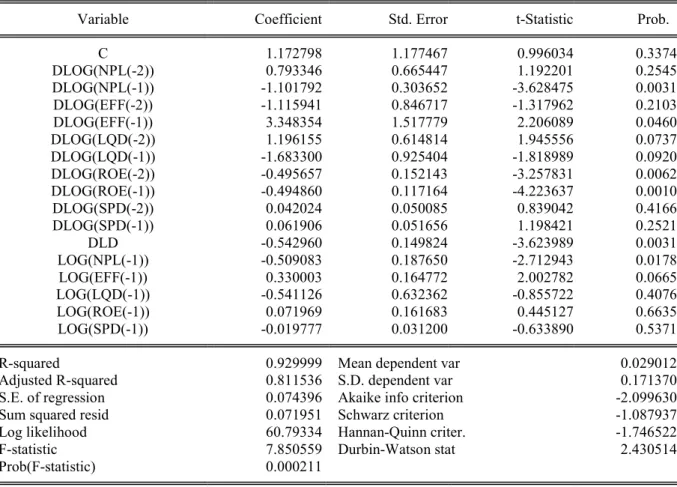
The estimation of equation 1 using the ARDL model is reported in table 4. The robustness of the model has been definite by model diagnostic tests such as ARCH test, Jacque-Bera normality test and Ramsey RESET specification test and Breusch-Godfrey serial correlation LM test. The ARDL model was tested for stability using the cumulative sum of the recursive residuals test (CUSUM test, Brown et al. 1975). All the tests disclosed that the model has the aspiration econometric properties, such as correct functional form, and the model residual are serially uncorrected, homoscedasticity and normally distributed. The results are therefore
valid for reliable interpretation.
Table 11: Estimated Results for the ARDL Model Based on Equation 1
Variable Coefficient Std. Error t-Statistic Prob.
C 1.172798 1.177467 0.996034 0.3374 DLOG(NPL(-2)) 0.793346 0.665447 1.192201 0.2545 DLOG(NPL(-1)) -1.101792 0.303652 -3.628475 0.0031 DLOG(EFF(-2)) -1.115941 0.846717 -1.317962 0.2103 DLOG(EFF(-1)) 3.348354 1.517779 2.206089 0.0460 DLOG(LQD(-2)) 1.196155 0.614814 1.945556 0.0737 DLOG(LQD(-1)) -1.683300 0.925404 -1.818989 0.0920 DLOG(ROE(-2)) -0.495657 0.152143 -3.257831 0.0062 DLOG(ROE(-1)) -0.494860 0.117164 -4.223637 0.0010 DLOG(SPD(-2)) 0.042024 0.050085 0.839042 0.4166 DLOG(SPD(-1)) 0.061906 0.051656 1.198421 0.2521 DLD -0.542960 0.149824 -3.623989 0.0031 LOG(NPL(-1)) -0.509083 0.187650 -2.712943 0.0178 LOG(EFF(-1)) 0.330003 0.164772 2.002782 0.0665 LOG(LQD(-1)) -0.541126 0.632362 -0.855722 0.4076 LOG(ROE(-1)) 0.071969 0.161683 0.445127 0.6635 LOG(SPD(-1)) -0.019777 0.031200 -0.633890 0.5371
R-squared 0.929999 Mean dependent var 0.029012
Adjusted R-squared 0.811536 S.D. dependent var 0.171370
S.E. of regression 0.074396 Akaike info criterion -2.099630
Sum squared resid 0.071951 Schwarz criterion -1.087937
Log likelihood 60.79334 Hannan-Quinn criter. -1.746522
F-statistic 7.850559 Durbin-Watson stat 2.430514
Prob(F-statistic) 0.000211
Since the model passed the serial correlation and the stability tests, the existence of a long run relationship was then tested using the Wald test. This test for a long run relationship amongst the variables was conducted using the Wald test for the joint significance of the coefficients of the lagged level variables. The calculated F-statistic for the model is 6.65, which is greater than the upper bound of 3.94 for the chosen explanatory variables, thus indicating that there is a long-run relationship amongst the variables in the model. Table 12: Bound Test for Co-integration Analysis
K 95% Level of Significant
I(0) I(1) F-Statistic
5 2.78 3.94 6.65
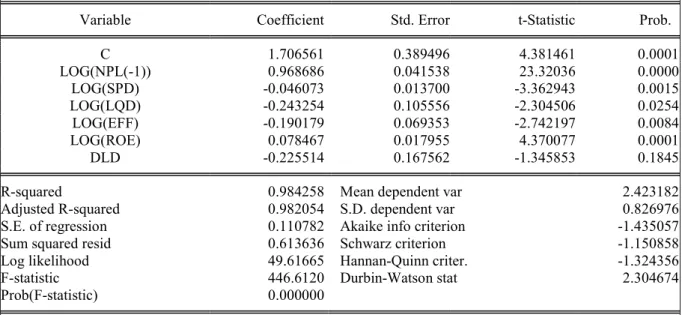
Long-run Relationship: Table 6 shows the outcome of long run estimates. The results shows that dollarization does not have an impact on the banking sector’s NPLs because dollarization’s P-value is greater than 0.05 and a t-statistic of less than 2. With the passage of time, banks adapt to the changed environment and adjust their credit policies. According to Belgrave, et al. (2001), Panama has experienced several major shocks that caused economic disruptions, however, due to dollarization the banking system has held up after domestic banks has established lines of credit with foreign banks with branches in Panama and has been able to draw on them during liquidity crunches. In contrast, a study by De Nicolo et al. (2003) found that dollarized economies have a great chance of experiencing financial instability. Quispe-Agnoli (2002), also noted that under full dollarization, the economy is shielded from a currency or balance-of-payments crisis, but the risk of a banking crisis is real and that financial instability is endemic to this system.
Return on equity, interest rate spread, efficiency and liquidity ratio variables were found to be statistically significant, since the p-values are less than 5% level of significant and the t-statistics are above 2. According to the model, return on equity has a positive influence on the level of NPLs, whilst liquidity, interest rate spread and efficiency have a negative impact on NPLs in the long-run. These results are in line with our initial assumptions. The positive impact on NPLs by the return on equity variable are in tandem with the pro-cyclical credit policy’ hypothesis, which states that past earnings may be positively linked with future increases in NPLs, as it reflects liberal credit policy on the part of the bank, Louzis et al. (2011). On the issue of liquidity impact on NPLs, Kochebey et al. (2014) also found a negative a highly significant impact on risk as measured by NPLs, suggesting that banks lowers their riskiness by increasing their liquidity position.
In the case of efficiency which was estimated to be negatively related to NPLs, this result is in line with the bad management hypothesis suggested by Berger & DeYoung (1997). This suggests that after measured cost efficiency declines, NPLs increase, possibly because of poor loan portfolio management as predicted by the bad management hypothesis. In support of this result, Karim et al. (2010) also found out that bank efficiency is negatively related to NPLs in Malaysia and Singapore banking systems.
According to the long-run results the interest rate spread is negatively related to NPLs, which is inconsistence with the view that banks tend to shift the risk associated with NPLs to customer (Barajas et al.
1999). This result could be the result of inadequate provisioning for loan losses that is, higher NPLs would reduce banks’ income, thereby lowering the spread in the absence of adequate loan loss reserves. The result could also reflect the fact that a banking system with a high proportion of bad loans may lower spreads (raise deposit rates and lower loan rates) as a way of trying to grow out of their troubles. This result is in line with the findings by Brock and Suarez (2000) who established that NPLs in Argentina and Peru were associated with smaller spreads.
Finally, lagged effects of NPLs were found to be positively and highly significant in influencing current levels of NPLs in the long-run as shown in the model. That is, an increase in past NPLs will almost double the current NPLs level. The results confirms the findings by Rinaldi et al. (2006) who suggested that in the long-run, an increase in household indebtedness to income is associated with higher levels of arrears on the previous loans.
Table 13: Estimated Long-run Model
Variable Coefficient Std. Error t-Statistic Prob.
C 1.706561 0.389496 4.381461 0.0001 LOG(NPL(-1)) 0.968686 0.041538 23.32036 0.0000 LOG(SPD) -0.046073 0.013700 -3.362943 0.0015 LOG(LQD) -0.243254 0.105556 -2.304506 0.0254 LOG(EFF) -0.190179 0.069353 -2.742197 0.0084 LOG(ROE) 0.078467 0.017955 4.370077 0.0001 DLD -0.225514 0.167562 -1.345853 0.1845
R-squared 0.984258 Mean dependent var 2.423182
Adjusted R-squared 0.982054 S.D. dependent var 0.826976
S.E. of regression 0.110782 Akaike info criterion -1.435057
Sum squared resid 0.613636 Schwarz criterion -1.150858
Log likelihood 49.61665 Hannan-Quinn criter. -1.324356
F-statistic 446.6120 Durbin-Watson stat 2.304674
Prob(F-statistic) 0.000000
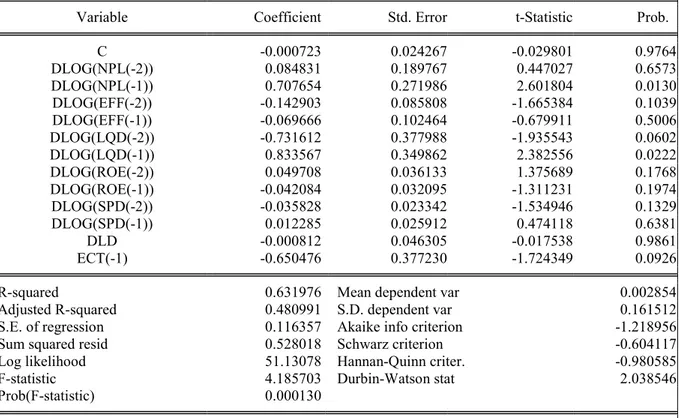
Short-Run Dynamics: A short run adjustment model can be constructed according to an Error Correction Mechanism (ECM) - that is, taking into account deviations from long run relationships.Similar to the long-run results, dollarization was also found not to have any impact on the level or growth of NPLs in the short-run as shown in table 11 above. This result is in contrast to Ozsoz (2007) who found that dollarization puts a downward pressure on the quality of loans in the banking sector resulting in higher loan defaults. Ozsoz (2007), further suggested that dollarization could result in fragility in financial intermediation in dollarized economies. de Nicoló, et al. (2003) also noted that dollarization is predictive of the share of non-performing loans.
The rate of adjustment is the coefficient of the variable ECT(-1), which is about -0.65. This means that about 65% of the shock clears the system in the next quarter and it takes about one and half quarters (4.5 months) for the system to adjust back to long-run equilibrium after the initial shock. This speed of adjustment can be evidenced by the continued slow decline in bank profitability and total loans in the banking sector which has stagnated since 2012 (RBZ, 2014) due to the fact that when the banking system started to experience an increase in NPLs the banks curtailed credit to the private sector. In other words, as assets (and accompanying income) upon which loans were created started to deplete, banks grew edgy and got worried about recouping their loans. They demanded higher interest rates and stringent requirements to lend out any further loans.
Table 14: Estimated Error Correction Model (ECM)
Variable Coefficient Std. Error t-Statistic Prob.
C -0.000723 0.024267 -0.029801 0.9764 DLOG(NPL(-2)) 0.084831 0.189767 0.447027 0.6573 DLOG(NPL(-1)) 0.707654 0.271986 2.601804 0.0130 DLOG(EFF(-2)) -0.142903 0.085808 -1.665384 0.1039 DLOG(EFF(-1)) -0.069666 0.102464 -0.679911 0.5006 DLOG(LQD(-2)) -0.731612 0.377988 -1.935543 0.0602 DLOG(LQD(-1)) 0.833567 0.349862 2.382556 0.0222 DLOG(ROE(-2)) 0.049708 0.036133 1.375689 0.1768 DLOG(ROE(-1)) -0.042084 0.032095 -1.311231 0.1974 DLOG(SPD(-2)) -0.035828 0.023342 -1.534946 0.1329 DLOG(SPD(-1)) 0.012285 0.025912 0.474118 0.6381 DLD -0.000812 0.046305 -0.017538 0.9861 ECT(-1) -0.650476 0.377230 -1.724349 0.0926
R-squared 0.631976 Mean dependent var 0.002854
Adjusted R-squared 0.480991 S.D. dependent var 0.161512
S.E. of regression 0.116357 Akaike info criterion -1.218956
Sum squared resid 0.528018 Schwarz criterion -0.604117
Log likelihood 51.13078 Hannan-Quinn criter. -0.980585
F-statistic 4.185703 Durbin-Watson stat 2.038546
Prob(F-statistic) 0.000130
CONCLUSION
This study has estimated the effect of dollarization and bank-specific determinants of non-performing loans in the Zimbabwe banking system using quarterly time series data from 2000 to 2014 by employing Bound Testing approach. The analysis demonstrates that in both the short-run and the long run, dollarization has no effect on NPLs growth, although they were found to be negatively related but statistically insignificant. Higher ratios of NPLs from previous period were found to be more likely to carry them out to the following periods according to both the short-run and long-run results, since the relationship were positive and highly significant, revealing the persistence of problem loans in the Zimbabwean banking system. Liquidity was found to have a negative impact on NPLs on both the short-run and long-run, contrarily to Chikoko (2013) who found a positive relationship between NPLs and liquidity. The negative relationship, according to Kochubey et al. (2014) means that liquidity shortages induces an increase in bank riskiness as measured by NPLs and vice versa and also that banks that face higher risk (NPLs) tend to decrease their liquidity buffer.
The return on equity variable which is a measure of profitability was found to have a positive relationship with the occurrence of problem loan conforms to the pro-cyclical credit policy’ hypothesis, which states that past earnings may be positively linked with future increases in NPLs, as it reflects liberal credit policy, Louzis et al. (2011). In other words, bank managers’ behaviour may be motivated by incentives to convince the market of bank’s profitability in the short-run. Finally, the negative relationship between the level of NPLs and efficiency meets our initial expectations. This suggests that after measured cost efficiency declines, NPLs increase, possibly because of poor loan portfolio management as predicted by the bad management hypothesis (Berger and DeYoung, 1997).
The policy implication of this research would be that the Zimbabwe banking sectors NPLs can be impacted by liquidity, return on equity, efficiency and interest rate spread factors. These results imply that policy-makers have to evaluate liquidity as an integral part of the banking activity. Regulatory authorities through the imposition of liquidity thresholds would be able to affect the growth of NPLs. This suggests that bank liquidity is an important coordination tool and supports an implementation of the stable funding ratios in line the new Basel III regulations in addition to capital requirements as argued by Kochubey et al. (2014). The banking system regulatory authorities should also focus on managerial performance in order to detect banks with cost inefficiencies which might lead to potential NPLs increases. According to the bad management hypothesis by Berger and DeYoung (1997), the major risks facing financial institutions are caused internally. Therefore, this also suggests that regulatory authorities’ bank supervision should consider cost efficiency along with other traditional predictors of troubled banks such as loan losses and credit risk.
REFERENCES
Barajas, A., Steiner, R. and Salazar, N. (1999): Interest Spread in Banking in Colombia, 1974-96. Staff Papers, International Monetary Fund, vol. 46(2) pp. 196-224
Bercoff, J., Giovanni, J. and Grimard, F. (2002): Argentinean Banks, Credit Growth and the Tequila Crisis: A Duration Analysis” (Unpublished)
Berger A. N. and R. De Young. (1997): Problem Loans and Cost Efficiency in Commercial Banks. Journal of
Banking and Finance, 21: 849‐870.
Belgrave, A., Campbell, T., Greenridge, K. and Straughn, R. (2001): Official Dollarisation: A realistic option for
CARICOM? 22nd Annual Review Seminar.
Brock, P. L. and Suarez, L. R. (2000): Understanding the Behaviour of Bank Spreads in Latin America. Journal of Development Economics Vol. 63 _2000. 113–134
Brown, R. L., Durbin, J. and Evans, J. M. (1975): Techniques for Testing the Constancy of Regression Relationships over Time. Journal of the Royal Statistical Society B, 37:149–163.
Chigumira, G. and Makochekanwa, A. (2014): Financial Liberalization and Crisis: Experience and Lesson for
Zimbabwe. Zimbabwe Economic Analysis and Research Unit Working Paper Series
Chikoko, L. (2014): Potential Sources of Zimbabwe Commercial Banks Illiquidity After Dollarisation, Journal of Contemporary Issues in Business Research
Chikoko, L. (2013): Zimbabwean Commercial Banks Liquidity Risk Determinants after Dollarisation, Journal of Applied Finance & Banking, vol. 3, no. 6, 2013, 97-114
Chikoko, L., Mutambanadzo, T. and Vhimisai, T. (2012): Insights On NPLs: Evidence From Zimbabwean
Commercial Banks in A Dollarised Environment (2009-2012),Journal of Emerging Trends in
Economics and Management Sciences (JETEMS) 3(6): 882-886
Collins, N. J. and Wanjau, K. (2011): The effects of interest rate spread on the level of non-performing assets: A
case of commercial banks in Kenya. International Journal of Business and Public Management (ISSN:
2223-6244) Vol. 1(1): 58-65
De Nicolo, Gianni, Honohan, P. and Ize, A. (2003): Dollarization of the Banking System: Good or Bad?
Working Paper 3116, World Bank Policy Research Working Paper.
Engle, R. and Granger, C. (1987): Co-integration and Error Correction: Representation, Estimation and Testing.
Econometrica, 55(2), 251-78. http://dx.doi.org/10.2307/1913236
Espinoza. R, and Prasad A. (2010): Nonperforming Loans in the GCC Banking System and their
Macroeconomic Effects.IMF Working Paper, WP/10/224.
European Central Bank (2010): Beyond ROE – How to Measure Bank Performance. Appendix to the Report on EU Banking Structure, Eurosystem, September 2010.
Fofack, H. (2005): NPLs in sub-Saharan Africa: Causal Analysis and Macroeconomic Implications. World Bank
Policy Research Working Paper No. 3769, November.
Greene, W. H. (1990): A Gamma-distributed Stochastic Frontier Model. Journal of Econometrics, 46, pp. 141-163.
Guy, K. and Lowe, S. (2012): Non-Performing Loans and Bank Stability in Barbados, Central Bank of Barbados,
Economic Review, Vol. 37, no. 1
Guy, K. (2011): Non perfoming loans. The Central Bank of Barbados, Economic Review Volume XXXVII, Number 1.
International Monetary Fund. (2004): Compilation Guide on Financial Soundness Indicators; International Monetary Fund; July 30, 2004 http://www.imf.org/external/np/sta/fsi/ eng/2004/guide/index.htm
Jimenez, G. and Saurina, J. (2005): Credit cycles, credit risk, and prudential regulation. Banco de Espana, January
Johansen, S. and Julius, K. (1990): Maximum Likelihood Estimation and Reference Co-integration with an Application to the Demand for Money. Oxford Bulletin of Economics and Statistics 52:169-210
Kaminsky, G. L. and Carmen M. Reinhart, C. M. (1999). The Twin Crises: The Causes of Banking and Balance of Payments Problems. American Economic Review, Vol. 89 No. 3, 473–500.
Karim, M. Z. A., Chan, S. G. and Hassan, S. (2010): Bank Efficiency and Non-Performing Loans: Evidence From Malaysia and Singapore
Keeton, W. R. (1997): The Effects of Mergers on Farm and Businesses Lending at Small Banks: New Evidence From Tenth District States. Working Paper, Federal Reserve Bank of Kansas City.
Khemraj, K. and Pasha, S. (2009): The Determinants of Non-performing Loans: An Econometric case for Guyana. University of Guyana: New College.
Kochubey, T. and Kowalczyk, D. (2014): The relationship between capital, liquidity and risk in commercial
banks. The Ninth Young Economist Seminar, Croatian National Bank
Levine, R. (1997): Financial Development and Economic Growth: Views and Agenda, Journal of Economic Literature Vol. XXXV (June 1997), pp. 688–726.
Levine, D., Berenson, M. L. and Stephan, D. (1997): Statistics for Managers Using Microsoft Excel.
Louzis, P., Vouldi A., T and Metaxas, V. L. (2011): Macroeconomic and bank-specific determinants of non-performing loans in Greece: A comparative study of mortgage, business and consumer loan portfolios.
Journal of Banking & Finance, 10.1016(j.jbankfin.2011.10.012), pp. 1-16.
Mabvure, T. J., Gwangwava, E., Faitira, M., Mutibvu, C., and Kamoyo, M. (2012): Non Performing loans in
Commercial Banks: A case of CBZ Bank Limited In Zimbabwe, Interdisciplinary Journal Of
Contemporary Research In Business Copy Right © 2012 Institute of Interdisciplinary Business Research, Vol. 4, No 7
Makina, D. (2009): Recovery of the Financial Sector and Building Financial Inclusiveness. UNDP,
Comprehensive Economic Recovery in Zimbabwe, Working Paper Series
Messai, S. and Jouini, F. (2013): Micro and macro determinantsof Non-performing loans. International journal of economics and financial issues, 3(4), pp. 852-860.
Ministry of Finance and Economic Development (2014): The 2015 National Budget Statement Presented to the
Parliament of Zimbabwe on 27th November 2014.
Nampewo, D. (2012): What Drives Interest Rate Spreads in Uganda’s Banking Sector? International Journal of
Economics and Finance; Vol. 5, No. 1; 2013
Ozsoz, E. (2007): Bank Performance in Dollarized Economies, 7th Global Conference on Business & Economics Pesaran, M. H., Shin, Y. and Smith, R. J. (2001): Bounds Testing Approaches to the Analysis of Level
Relationships. Journal of Applied Econometrics J. Appl. Econ. 16: 289–326 (2001)
Quispe-Agnoli, M. (2002): Costs and Benefits of Dollarisation.
https://www.frbatlanta.org/~/media/.../quispedollarization revised.ashx
Quispe-Agnoli, M. and Whisler, E. (2006): Official Dollarisation and the Banking System in Ecuador and El
Salvador, Federal Reserve Bank of Atlanta Third Quarter Economic Review.
Rajan, R. and C. Dhal, S. C. (2003): NPLs and Terms of Credit of Public Sector Banks in India: An Empirical Assessment. Occasional Papers, 24:3, pp. 81-121, Reserve Bank of India
Reserve Bank Zimbabwe (2004, January): Monetary Policy Statement Issued in Terms of The Reserve Bank of
Zimbabwe Act Chapter 22:15, Section 46
Reserve Bank Zimbabwe (2005, January): Monetary Policy Statement Issued in Terms of The Reserve Bank of
Zimbabwe Act Chapter 22:15, Section 46
Reserve Bank Zimbabwe (2006, January): Monetary Policy Statement Issued in Terms of The Reserve Bank of
Zimbabwe Act Chapter 22:15, Section 46
Reserve Bank Zimbabwe (2014, January): Monetary Policy Statement Issued in Terms of The Reserve Bank of
Zimbabwe Act Chapter 22:15, Section 46
Reserve Bank of Zimbabwe (2014, August): Monetary Policy Statement Issued in Terms of The Reserve Bank
of Zimbabwe Act Chapter 22:15, Section 46
Rinaldi, L. and Sanchis-Arellano, A. (2006): Household Debt Sustainability What Explains Household
Non-Performing Loans? An Empirical Analysis. European Central Bank, Working Paper Series, No. 570.
Salas, V. and Saurina, J. (2002): Credit Risk in Two Institutional Regimes: Spanish Commercial and Savings Banks. Journal of Financial Services Research, 22:3, pp. 203-224.
Sinkey, J. Fowler, M. and Greenwalt, B. (1991): Loan-Loss Experience and Risk-Taking Behavior at Large Commercial Banks. Journal of Financial Services Research, 5: 43-59.
Sontakke, R. N. and Tiwari C. (2013): Trend Analysis of Nonperforming Asset in Scheduled Commercial Banks in India; International Journal of Application or Innovation in Engineering &Management (IJAIEM); ISSN 2319 – 4847
Staikouras, C. K. and Wood, G. E. (2003): The Determinants of European Bank Profitability. International Business and Economics Research Journal.
Tiffany, G. and Kester, G. (2013): A Regime Switching Approach to Analyzing Bank Non-Performing Loans in
Barbados.Central Bank of Barbados; CBB Working Paper No. WP/13/7.
Tracey, M. (2011): The Impact of Non-performing Loans on Loan Growth: An Econometric Case Study of
Jamaica and Trinidad and Tobago. Presented at the Bank of Jamaica Applied Research Conference in
Jamaica September 2011.
Warue, B. N. (2013): The Effects of Bank Specific and Macroeconomic Factors on Nonperforming Loans in Commercial Banks in Kenya: A Comparative Panel Data Analysis. Advances in Management & Applied Economics, vol.3, no.2, 2013, 135-164