econ
stor
www.econstor.eu
Der Open-Access-Publikationsserver der ZBW – Leibniz-Informationszentrum Wirtschaft
The Open Access Publication Server of the ZBW – Leibniz Information Centre for Economics
Nutzungsbedingungen:
Die ZBW räumt Ihnen als Nutzerin/Nutzer das unentgeltliche, räumlich unbeschränkte und zeitlich auf die Dauer des Schutzrechts beschränkte einfache Recht ein, das ausgewählte Werk im Rahmen der unter
→ http://www.econstor.eu/dspace/Nutzungsbedingungen nachzulesenden vollständigen Nutzungsbedingungen zu vervielfältigen, mit denen die Nutzerin/der Nutzer sich durch die erste Nutzung einverstanden erklärt.
Terms of use:
The ZBW grants you, the user, the non-exclusive right to use the selected work free of charge, territorially unrestricted and within the time limit of the term of the property rights according to the terms specified at
→ http://www.econstor.eu/dspace/Nutzungsbedingungen By the first use of the selected work the user agrees and declares to comply with these terms of use.
zbw
Leibniz-Informationszentrum Wirtschaft Leibniz Information Centre for Economics Fertő, ImreWorking Paper
Spatial developments of Hungarian agriculture in
the transition: the case of crop productionSpatial
developments of Hungarian agriculture in the
transition: the case of crop production
Discussion paper // Leibniz Institute of Agricultural Development in Central and Eastern Europe, No. 107
Provided in cooperation with:
Leibniz Institute of Agricultural Development in Central and Eastern Europe (IAMO)
Suggested citation: Fertő, Imre (2007) : Spatial developments of Hungarian agriculture in the transition: the case of crop production, Discussion paper // Leibniz Institute of Agricultural Development in Central and Eastern Europe, No. 107, urn:nbn:de:gbv:3:2-4734 , http:// hdl.handle.net/10419/28495
S
PATIAL DEVELOPMENTS OFH
UNGARIAN AGRICULTURE IN THE TRANSITION:
T
HE CASE OF CROP PRODUCTION IMRE FERTŐDISCUSSION PAPER NO. 107
2007
DISCUSSION PAPER
Leibniz Institute of Agricultural Development
in Central and Eastern Europe
Theodor-Lieser-Straße 2, 06120 Halle (Saale), Germany Phone: +49-345-2928 110
Fax: +49-345-2928 199 E-mail: iamo@iamo.de Internet: http://www.iamo.de
Imre Fertő is a researcher at the Institute of Economics, Hungarian Academy of Sciences, Budapest, Hungary.
E-mail: ferto@econ.core.hu
This paper has been presented to the IAMO Forum 2007 "Sustainable rural development: What ist the role of the agri-food sector" held in Halle (Saale), June 27 to 29, 2007.
Discussion Papers are interim reports on work of the Leibniz Institute of Agricultural Development in
Central and Eastern Europe (IAMO) and have received only limited reviews. Views or opinions ex-pressed in them do not necessarily represent those of IAMO. Comments are welcome and should be addressed directly to the author(s).
The series Discussion Papers is edited by: Prof. Dr. Alfons Balmann (IAMO) Prof. Dr. Gertrud Buchenrieder (IAMO) Prof. Dr. Thomas Glauben (IAMO) ISSN 1438-2172
ABSTRACT
The paper investigates spatial changes in cultivation and land use of wheat, maize and oilseed in Hungarian agriculture using different methods to measure these changes. The results suggest that spatial structure of crop productions has remained fairly stable during analysed period. The spatial concentration increased significantly for wheat and maize production and maize land use, whilst the changes were not significant for other cases. Estimates confirm the presence of spatial autocorrelation for all cases. The degree of spatial autocorrelation has no unambiguous pattern over time, except for maize production. Finally, we have not found significant relation-ship measured by PSE index between agricultural support and spatial concentration, but estimates show positive and significant effects of the share of private farms in the production of certain crops on spatial concentration.
JEL: Q13, Q18
Keywords: Agricultural production, land use, spatial analysis, Hungary.
ZUSAMMENFASSUNG
RÄUMLICHE ENTWICKLUNGEN DER UNGARISCHEN LANDWIRTSCHAFT IM
TRANSFORMATIONSPROZESS AM BEISPIEL DER PFLANZENPRODUKTION
Diese Arbeit untersucht räumliche Veränderungen des Anbaus und der Bodennutzung von Weizen, Mais und Ölsaat in der ungarischen Landwirtschaft, wobei verschiedene Methoden für die Messung dieser Veränderungen genutzt werden. Die Ergebnisse zeigen, dass die Raum-struktur der Pflanzenproduktion über den untersuchten Zeitraum relativ stabil war. Die räumliche Konzentration der Weizen- und Maisproduktion und der Bodennutzung für Mais erhöhten sich signifikant, während die Veränderungen in den anderen Fällen nicht signifikant waren. Die Untersuchungen belegen weiterhin eine räumliche Autokorrelation zwischen den verschiedenen Fällen. Gleichzeitig kann man aber kein eindeutiges Muster bei der räumlichen Autokorrelation über den Zeitverlauf erkennen. Eine Ausnahme stellt die Maisproduktion dar. Weiterhin haben wir keinen signifikanten Zusammenhang zwischen einer Unterstützung der Landwirtschaft und räumlicher Konzentration gefunden (gemessen durch den PSE Index), aber die Berechnungen zeigen einen positiven und signifikanten Effekt des Anteils von privaten Firmen an der Produktion von bestimmten Saaten auf die räumliche Konzentration.
JEL: Q13, Q18
CONTENTS Abstract ... 3 Zusammenfassung... 3 List of tables... 6 List of figures ... 6 1 Introduction ... 7 2 Methodology... 8 3 Results... 9 4 Conclusions ... 13 Acknowledgements... 14 References ... 14
Imre Fertö 6
List of tables
Table 1: Gini coefficients for production and land use between 1990 and 2005... 9 Table 2: Changes in spatial concentration for production and land use between
1990 and 2005 ... 10 Table 3: Spearman coefficients for production and land use between 1990
and 2005 ... 10 Table 4: Markov matrices of the county rank for production and land use
between 1990 and 2005 ... 11 Table 5: Moran’s I statistics for production and land use between 1990
and 2005 ... 12 Table 6: Changes in spatial autocorrelation for production and land use
between 1990 and 2005 ... 12 Table 7: The effects of PSE index and share of private farms on spatial
concentration for production and land use ... 13
List of figures
1 INTRODUCTION
There is a continuously growing literature on the agricultural transformation in Central an Eastern European countries (see survey BROOKS and NASH, 2002; ROZELLE and SWINNEN, 2004).
The research has focused on various aspects of transition, including land reform, farm restruc-turing, price and trade liberalisation and etc. However, until now the spatial aspects of the change in agricultural production in CEE countries were neglected. Last decade the Central European countries have been considerable transformed, including transition from planned economy to market economy, increasing trade openness, FDI etc. The Central European agri-culture was also a subject a profound transformation affecting by land reform, trade and price liberalisation. Therefore, it is reasonable assume that powerful changes in the agriculture should have effects on the evolution of spatial pattern of agricultural production. The aim of the investi-gation of regional development of agricultural production is to finding out which regions have been able to grow their share in the production, and which regions lost their positions. Regions with increasing share may or may not be neighbours suggesting that the results based on regional perspective may be different from the estimations employing spatial framework. When agri-cultural production is highly concentrated in certain regions, it may be a considerable difference whether these regions are adjacent or spread across the space.
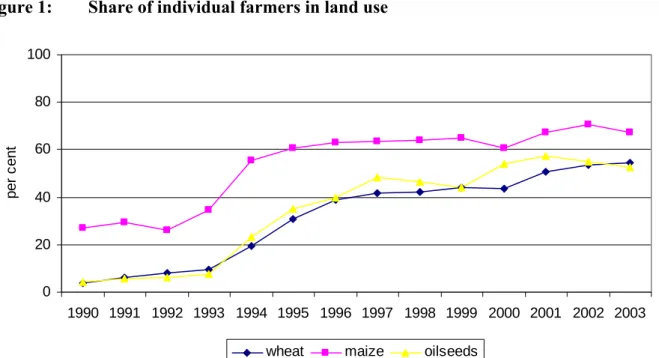
In this paper, spatial changes in cultivation and land use of wheat, maize and oilseed are analysed in Hungarian agriculture using different methods to measure these changes. The Figure 1 illustrates the changes in land use by organisations form. The share of individual farmers in land use has increased rapidly in the first half of nineties. Their proportion for wheat has exceeded the 60 percent already in 1995.
Figure 1: Share of individual farmers in land use
0 20 40 60 80 100 1990 1991 1992 1993 1994 1995 1996 1997 1998 1999 2000 2001 2002 2003 p e r c ent
wheat maize oilseeds
Source: Own calculations based on various issues of Statistical Yearbook of Agriculture, Central Statistical Office.
The analysis based on a dataset on agricultural production and land use covering 19 counties of Hungary during 1990 and 2005. Following ELHORTS and STRIJKER (2003) we apply various
methods to analyse the spatial changes in Hungarian agriculture. First, we employ the Gini coefficients to identify the degree of regional concentration of agricultural production and land use. Second, whether or not a position of the counties has changed can be analysed by the Spearman
Imre Fertő
8
correlation coefficient. In addition, we use transition mobility matrix and related mobility indices to check the mobility of ranking of the counties. Third, to detect spatial patterns or trends in the regional values, we use Moran’s I statistic for spatial correlation. Finally, we check the dynamics of spatial changes using regression analysis.
2 METHODOLOGY
The Gini coefficient is a widely used measure to identify the degree of regional concentration of a particular activity. Lets describe X the size of an agricultural activity and Y is the size of agricultural land whithin a county, n denotes the number of counties being investigated. The Gini coefficient G of the agricultural activity can be defined as follows:
∑ ∑
∑
= = = + − = n i n j Y n i X Y Xi Si S iS i S G 1 1 1 ) ( 2 1 (1), where∑
= = n j j i X X X S i 1 ,∑
= = n j j i Y Y Y Si 1 , (i=1,…,n) and n Y X Y X ⎟ ⎠ ⎞ ⎜ ⎝ ⎛ ≤ ≤ ⎟ ⎠ ⎞ ⎜ ⎝ ⎛ ... 1 ,that is, counties are ranked according to increasing intensity. The Gini coefficient equals zero when activity is evenly distributed over the regions, and equals one if the activity is fully concen-trated in one county. The changes in Gini coefficient over time provide information on the extent to which activity has become regionally more concentrated or less concentrated.
The Gini coefficient yield information only about the degree of regional concentration. However, if two counties switch positions, the Gini coefficient remains the same. For the investigation of changes in ranking of counties can be employed by ranking order correlation coefficient, such as the Spearman coefficient:
∑
= − − = n i i s n n D r 1 2 2 1) ( 6 1 (2),where Di is the difference in ranking number of county i between two periods. The value of rs is one if the ranking of the counties remains the same, and minus one if the ranking in the end period is the opposite of the ranking in the beginning period.
In addition, we employ transition probability matrices to identify the persistence in the ranking of each county. We classify counties into quartiles and then we investigate the chance of moving of a county from one quartile to another one. The degree of mobility in patterns of ranking can be summarised using indices of mobility. These formally evaluate the degree of mobility throughout the entire distribution of ranking and facilitate direct cross-commodity comparisons. The Markov index (M1), following Shorrocks (1978), evaluates the trace (tr) of the Markov transition probability matrixThis index thus directly captures the relative magnitude of diagonal and off-diagonal terms, and can be shown to equal the inverse of the harmonic mean of the expected duration of remaining in a given cell.
1 K ) P ( tr K 1 M − − = (3), where K is the number of cells, and P is the transition probability matrix. In M1 indices, a higher value indicates greater mobility, with a value of zero indicating perfect immobility.
We calculate Moran’s I statistics for spatial autocorrelation to evalute of spatial patterns in the regional values. Data (zi) are spatially autocorrelated if neighbouring values are more alike than those further apart. If data shows spatial autocorrelation, the locations of the counties provide information about the spatial pattern of variation in these data. Moran’s I statistics is defined as follows: ⎟⎟ ⎠ ⎞ ⎜⎜ ⎝ ⎛ − − − =
∑
∑ ∑
∑∑
= = = ≠ = = n i n i n i j j ij i n i n j j i ij w z z z z z z w n I 1 1 1, 2 1 1 ) ( ) ( ) )( ( (4),where wij is the (i,j)th element of the matrix W, describing the spatial arrangement of the counties in this study.
3 RESULTS
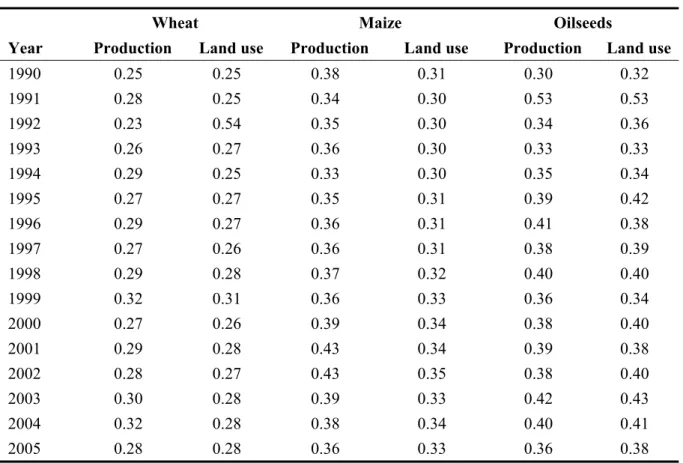
Table 1 shows the Gini coefficients for the production and land use of wheat, maize and oilseeds. In general, the values of both Gini coefficients are relatively low for all products (mostly below 0.4) indicating that crops cultivation widely spread over the counties. In other words, regional concentration of crops production is low. The difference between coefficients for production and land use is small without unambiguous trend. The degree of regional concen-tration is somewhat higher than that of land use for wheat and maize, while the picture is mixed for oilseeds.
Table 1: Gini coefficients for production and land use between 1990 and 2005
Wheat Maize Oilseeds Year Production Land use Production Land use Production Land use
1990 0.25 0.25 0.38 0.31 0.30 0.32 1991 0.28 0.25 0.34 0.30 0.53 0.53 1992 0.23 0.54 0.35 0.30 0.34 0.36 1993 0.26 0.27 0.36 0.30 0.33 0.33 1994 0.29 0.25 0.33 0.30 0.35 0.34 1995 0.27 0.27 0.35 0.31 0.39 0.42 1996 0.29 0.27 0.36 0.31 0.41 0.38 1997 0.27 0.26 0.36 0.31 0.38 0.39 1998 0.29 0.28 0.37 0.32 0.40 0.40 1999 0.32 0.31 0.36 0.33 0.36 0.34 2000 0.27 0.26 0.39 0.34 0.38 0.40 2001 0.29 0.28 0.43 0.34 0.39 0.38 2002 0.28 0.27 0.43 0.35 0.38 0.40 2003 0.30 0.28 0.39 0.33 0.42 0.43 2004 0.32 0.28 0.38 0.34 0.40 0.41 2005 0.28 0.28 0.36 0.33 0.36 0.38
Imre Fertő
10
The changes in regional concentration do not exhibit a clear trend. To evaluate more formally the changes in regional concentration in crop production we regress the log of the Gini coeffi-cients on a simple time trend (see, for example, AMITI, 1998). Our results suggest that there is
a significant growth in regional concentration of production for wheat and maize and for the land use of maize. Calculations also indicate that there are no significant changes in regional concentration of oilseeds.
Table 2: Changes in spatial concentration for production and land use between 1990 and 2005
Constant Year Adjusted R2 n
Wheat Land use 5.602 -0.003 -0.0359 16
Production -4.803** 0.003** 0.2644 16
Maize Land use -5.259*** 0.003*** 0.6075 16
Production -5.770* 0.003** 0.2092 16
Oilseeds Land use -1.604 0.001 -0.0622 16
Production -1.577 0.001 -0.0622 16
Source: Own calculations based on various issues of Regional Statistical Yearbooks, Central Statistical Office.
Table 3: Spearman coefficients for production and land use between 1990 and 2005
Wheat Maize Oilseeds Year Production Land use Production Land use Production Land use
1991 0.9754 0.9912 0.8662 0.9860 0.9030 0.9298 1992 0.8907 0.8719 0.7907 0.9772 0.9443 0.9614 1993 0.8895 0.9596 0.8504 0.9807 0.8993 0.9632 1994 0.9333 0.9684 0.6713 0.9719 0.9443 0.9228 1995 0.9632 0.9719 0.7222 0.9386 0.8741 0.9018 1996 0.9684 0.9632 0.7907 0.9667 0.8890 0.8982 1997 0.9526 0.9649 0.7758 0.9632 0.9014 0.8807 1998 0.9228 0.9719 0.7626 0.8947 0.9422 0.9298 1999 0.7825 0.8614 0.8135 0.9544 0.7971 0.8667 2000 0.8754 0.9491 0.8056 0.9281 0.8204 0.8333 2001 0.9421 0.9667 0.8469 0.9561 0.8473 0.8088 2002 0.8491 0.9456 0.7073 0.9614 0.8596 0.8877 2003 0.8211 0.9088 0.7442 0.9368 0.8535 0.8719 2004 0.9246 0.9544 0.8355 0.9368 0.8906 0.8982 2005 0.9140 0.9456 0.7073 0.9140 0.8741 0.8912
Source: Own calculations based on various issues of Regional Statistical Yearbooks, Central Statistical Office.
The Spearman coefficients are very high (>0.85) for land use of all crops, meanwhile corre-sponding values are somewhat lowest for production, but they are still relatively high (>0.8) indicating a fairly stable pattern in the ranking of counties over time (Table 3).
Table 4: Markov matrices of the county rank for production and land use between 1990 and 2005
Wheat Production Land use
Quartiles 1 2 3 4 1 2 3 4 1 0.80 0.20 0.00 0.00 0.80 0.20 0.00 0.00 2 0.25 0.50 0.25 0.00 0.25 0.50 0.25 0.00 3 0.00 0.20 0.60 0.20 0.00 0.20 0.60 0.20 4 0.00 0.00 0.20 0.80 0.00 0.00 0.20 0.80 M1 0.43 0.43
Maize Production Land use
1 0.60 0.40 0.00 0.00 0.67 0.17 0.17 0.00
2 0.33 0.33 0.33 0.00 0.33 0.67 0.00 0.00
3 0.17 0.17 0.33 0.33 0.00 0.20 0.40 0.40
4 0.00 0.00 0.40 0.60 0.00 0.00 0.40 0.60
M1 0.71 0.56
Oilseeds Production Land use
1 0.80 0.20 0.00 0.00 0.80 0.20 0.00 0.00
2 0.25 0.50 0.25 0.00 0.25 0.50 0.00 0.25
3 0.00 0.20 0.60 0.20 0.00 0.20 0.80 0.00
4 0.00 0.00 0.20 0.80 0.00 0.00 0.20 0.80
M1 0.43 0.37
Source: Own calculations based on various issues of Regional Statistical Yearbooks, Central Statistical Office.
The transition matrices in Table 4 suggest that ranking of counties are fairly persistent for first and last quartiles from 1990 to 2005. The diagonal elements for these classes are 0.80 for wheat and oilseed, indicating a high probability that a county being in the lowest or highest quartiles at the start of the period will have that same status at the end of the period. The per-sistence is relatively strong of these classes for maize; the value of cells is 60 per cent. This suggests that once obtaining a low or high rank they will likely maintain it over time. Note, that the values relative to the ends of the distribution on the main diagonal is larger than those in the middle of distribution for all crops. In other words, it is easier maintaining low or high ranks than a weak or medium one. Furthermore, our results suggest that the probability of an observation moving to a lower value cell (a weakening of rank) is much higher than the reverse case. Estimations show that mobility is the highest for maize both in terms of production and land. The values mobility indices are the same for production of wheat and oilseeds, but corre-sponding value is lower for the land use of oilseeds. This suggests that mobility is the lowest for the land use of oilseeds.
Table 5 reports Moran’s I statistics for all crops. First striking feature is that all results signifi-cantly differ from zero. For wheat, the degree of spatial autocorrelations of land dropped sud-denly in 1992 than stabilised between 0.3 and 0.4 with a slightly decreasing trend. Results show a similar fashion for production with a larger fluctation after the random shock. The estima-tions indicate that in the second half of analysed period the land use and production of wheat has become less concentrated in contiguous counties.
Imre Fertő
12
Table 5: Moran’s I statistics for production and land use between 1990 and 2005
Wheat Maize Oilseeds Year Production Land use Production Land use Production Land use
1990 0.391 0.378 0.421 0.387 0.401 0.390 1991 0.421 0.404 0.413 0.381 0.038 0.044 1992 0.164 -0.102 0.431 0.414 0.344 0.385 1993 0.263 0.335 0.422 0.393 0.283 0.372 1994 0.403 0.353 0.481 0.361 0.347 0.345 1995 0.299 0.357 0.440 0.343 0.372 0.274 1996 0.420 0.382 0.407 0.389 0.447 0.395 1997 0.354 0.386 0.402 0.378 0.369 0.431 1998 0.383 0.394 0.434 0.405 0.387 0.381 1999 0.334 0.309 0.336 0.323 0.292 0.332 2000 0.221 0.294 0.361 0.350 0.288 0.346 2001 0.373 0.374 0.394 0.381 0.452 0.403 2002 0.292 0.336 0.412 0.352 0.370 0.399 2003 0.248 0.330 0.302 0.379 0.334 0.378 2004 0.356 0.341 0.379 0.358 0.355 0.364 2005 0.251 0.299 0.417 0.381 0.320 0.354
Source: Own calculations based on various issues of Regional Statistical Yearbooks, Central Statistical Office.
The degree of spatial autocorrelations of land use and production of maize show a continuously declining trend. This suggests that during the analysed period the land use and production of maize has become less concentrated in adjacent counties. Moran’s I statistics for oilseeds shows that the degree of spatial autocorrelations of land use and production decreased suddenly in 1991 than fluctuated between 0.27 and 0.45 with a slightly increasing trend. It implies that the land use and production of oilseeds has become more concentrated in contiguous counties.
Table 6: Changes in spatial autocorrelation for production and land use between 1990 and 2005
Constant Year Adjusted R2 N
Wheat Land use 7.929 -0.004 -0.0127 16
Production -6.662 0.003 -0.0502 16
Maize Land use 3.719 -0.002 0.0482 16
Production 9.791** -0.005** 0.2224 16
Oilseeds Land use -12.320 0.006 0.0519 16
Production -10.546 0.005 0.0041 16
Notes: Significance levels are* 10 per cent; ** 5 per cent; ***1 per cent.
Similarly to Gini coefficients, we regress the log of the Moran’s I statistics on a simple time trend to evaluate the changes in spatial autocorrelation. The estimations show a decline in spatial autocorrelation for maize productions and land use, but just former one is significant (Table 6). This confirms our a priori expectations based on previous informal analysis. The coefficients for
oilseeds are positive, without significance. For wheat, the results report the opposite signs for land use and production of wheat, but coefficients are not significant.
Next step we try to explain the changes in spatial concentration for various crops. We focus on the possible factors. First, the structural changes in production and land use. The share of private farms increased considerably period in question. So, we expect that this development may affect on the spatial concentration of crops. However, we have no a priori expectations on the direction of impacts. Second concern is the changes in agricultural policy measures. Before 1990 Hungarian agricultural policy supported with special measures the crop production in less favoured areas. These interventions were eliminated during the transition period that may also have impacts on the spatial concentration. To evaluate the effects of these possible factors, we estimate the following simple models:
Spatconcit=α1+ α2PSEit+ α3Privshareit (5),
Where Spatconc is the Gini coefficient for land use or production, PSE denotes PSE index, and Privshare describes the share of private farms in land use or production, i denotes the product and t is the time.
Table 6 shows the results of our estimations. Interestingly, we have not found significant relation-ship measured by PSE index between agricultural support and spatial concentration for any cases. But estimates show positive and significant effects of the share of private farms in the production of wheat and maize on spatial concentration. In addition, we also find a positive and significant relationship between the share of private farms in land use of maize and spatial concentration.
Table 7: The effects of PSE index and share of private farms on spatial concentration for production and land use
Constant PSE Privshare R2 N
Production Wheat 0.2609*** 0.0002 0.0554** 0.3821 14 Maize 0.3185*** 0.0003 0.1019** 0.2364 14 Oilseeds 0.3869*** 0.0005 0.0079 0.4964 14 Land use Wheat 0.3137*** -0.0003 -0.0822 0.7865 14 Maize 0.2796*** 0.0002 0.0732*** 0.4092 14 Oilseeds 0.3963*** 0.0006 -0.0088 0.5529 14
Notes: Significance levels are* 10 per cent; ** 5 per cent; ***1 per cent.
4 CONCLUSIONS
The paper investigates the spatial development of crop production in Hungary between 1990 and 2005. Our results based on Gini coefficients suggest that the spatial concentration of production and land use was nearly the same for wheat and oilseeds, while the spatial concentration of pro-duction was higher than land use for maize. Furthermore, the spatial concentration was lower for wheat than other crop products. The coefficients of Spearman correlation were very high for all crops production and land use. It implies that spatial structure of crop productions has remained fairly stable during analysed period. However, transition probability matrices show a higher mobi-lity across quartilies in the ranking of counties. The chances remaining the lowest or highest quartiles are high, while the probability of an observation moving to a lower rank is much higher
Imre Fertő
14
than the reverse case. The spatial concentration increased significantly for wheat and maize production and maize land use, whilst the changes were not significant for other cases. Moran I statistics confirm the presence of spatial autocorrelation for all cases. The estimations show a decline in spatial autocorrelation for maize productions indicating a less concentrated production in contiguous counties. Finally, we have not found significant relationship measured by PSE index between agricultural support and spatial concentration, but estimates show positive and significant effects of the share of private farms in the production of certain crops on spatial concentration. In sum, despite of significant changes in Hungarian agriculture the spatial structure of crop production shows a fairly stable pattern in last sixteen years.
ACKNOWLEDGEMENTS
The author gratefully acknowledges financial support from the Hungarian Scientific Research Fund No. 46882 "The Competitiveness of Regional Clusters in the Food Economy".
REFERENCES
AMITI, M. (1998): New trade theories and industrial location in the EU, Oxford Review of Economic
Policy,Vol. 14 (2), pp. 45-53.
BROOKS, K., NASH, J. (2002): The rural sector in transition economies, in: GARDNER, B., RAUSSER, G. C.
(eds.): Handbook of Agricultural Economics, Vol. 2A, Amsterdam: North-Holland, pp. 1547-1592. CLIFF, A. D., ORD, J. K. (1981): Spatial processes: Models and applications, London: Pion.
ELHORST, J. P., STRIJKER, D. (2003): Spatial developments of EU agriculture in the post war period:
The case of wheat and tobacco, Agricultural Economics Review, Vol. 4. (1), pp. 63-72.
ROZELLE, S., SWINNEN, J. F. M. (2004): Success and failure of reform: Insights from the transition of
agriculture, Journal of Economic Literature, Vol. 42 (2), pp. 404-456.
D
ISCUSSIONP
APERSDES
L
EIBNIZ-I
NSTITUTS FÜRA
GRARENTWICKLUNG INM
ITTEL-
UNDO
STEUROPA(IAMO)
D
ISCUSSIONP
APERSOF THE
L
EIBNIZI
NSTITUTE OFA
GRICULTURALD
EVELOPMENT INC
ENTRAL ANDE
ASTERNE
UROPE(IAMO)
No. 1 FROHBERG, K., HARTMANN, M. (1997):
Promoting CEA agricultural exports through association agreements with the EU – Why is it not working? –
No. 2 FROHBERG, K., HARTMANN, M. (1997):
Comparing measures of competitiveness: Examples for agriculture in the Central European Associates
No. 3 POGANIETZ, W. R., GLAUCH, L. (1997):
Migration durch EU-Integration? Folgen für den ländlichen Raum No. 4 WEINGARTEN, P. (1997):
Agri-environmental policy in Germany – Soil and water conversation – No. 5 KOPSIDIS, M. (1997):
Marktintegration und landwirtschaftliche Entwicklung: Lehren aus der Wirtschafts-geschichte und Entwicklungsökonomie für den russischen Getreidemarkt im Trans-formationsprozeß
No. 6 PIENIADZ, A. (1997):
Der Transformationsprozeß in der polnischen Ernährungsindustrie von 1989 bis 1995
No. 7 POGANIETZ, W. R. (1997):
Vermindern Transferzahlungen den Konflikt zwischen Gewinnern und Verlierern in einer sich transformierenden Volkswirtschaft?
No. 8 EPSTEIN, D. B., SIEMER, J. (1998):
Difficulties in the privatization and reorganization of the agricultural enterprises in Russia
No. 9 GIRGZDIENE, V., HARTMANN, M., KUODYS, A., RUDOLPH, D., VAIKUTIS, V.,
WANDEL, J. (1998):
Restructuring the Lithuanian food industry: Problems and perspectives
No. 10 JASJKO, D., HARTMANN, M., KOPSIDIS, M., MIGLAVS, A., WANDEL, J. (1998):
No. 11 SCHULZE, E., NETZBAND, C. (1998):
Ergebnisse eines Vergleichs von Rechtsformen landwirtschaftlicher Unternehmen in Mittel- und Osteuropa
No. 12 BERGSCHMIDT, A., HARTMANN, M. (1998):
Agricultural trade policies and trade relations in transition economies No. 13 ELSNER, K., HARTMANN, M. (1998):
Convergence of food consumption patterns between Eastern and Western Europe No. 14 FOCK, A., VON LEDEBUR, O. (1998):
Struktur und Potentiale des Agraraußenhandels Mittel- und Osteuropas No. 15 ADLER, J. (1998):
Analyse der ökonomischen Situation von Milchproduktionsunternehmen im Oblast Burgas, Bulgarien
No. 16 PIENIADZ, A., RUDOLPH, D. W., WANDEL, J. (1998):
Analyse der Wettbewerbsprozesse in der polnischen Fleischindustrie seit Trans-formationsbeginn
No. 17 SHVYTOV, I. (1998):
Agriculturally induced environmental problems in Russia No. 18 SCHULZE, E., TILLACK, P., DOLUD, O., BUKIN, S. (1999):
Eigentumsverhältnisse landwirtschaftlicher Betriebe und Unternehmen in Russland und in der Ukraine – Befragungsergebnisse aus den Regionen Nowosibirsk und Shitomir
No. 19 PANAYOTOVA, M., ADLER, J. (1999):
Development and future perspectives for Bulgarian raw milk production towards EU quality standards
No. 20 WILDERMUTH, A. (1999):
What kind of crop insurance for Russia?
No. 21 GIRGZDIENE, V., HARTMANN, M., KUODYS, A., VAIKUTIS, V., WANDEL, J. (1999):
Industrial organisation of the food industry in Lithuania: Results of an expert survey in the dairy and sugar branch
No. 22 JASJKO, D., HARTMANN, M., MIGLAVS, A., WANDEL, J. (1999):
Industrial organisation of the food industry in Latvia: Results of an expert survey in the dairy and milling branches
No. 23 ELSNER, K. (1999):
Analysing Russian food expenditure using micro-data No. 24 PETRICK, M., DITGES, C. M. (2000):
Risk in agriculture as impediment to rural lending – The case of North-western Kazakhstan
No. 25 POGANIETZ, W. R. (2000):
Russian agri-food sector: 16 months after the breakdown of the monetary system No. 26 WEBER, G., WAHL, O., MEINLSCHMIDT, E. (2000):
Auswirkungen einer EU-Osterweiterung im Bereich der Agrarpolitik auf den EU-Haushalt
(Steht nicht mehr zur Verfügung – Aktualisierte Version DP 42) No. 27 WAHL, O., WEBER, G., FROHBERG, K. (2000):
Documentation of the Central and Eastern European Countries Agricultural Simulation Model (CEEC-ASIM Version 1.0)
No. 28 PETRICK, M. (2000):
Land reform in Moldova: How viable are emerging peasant farms? An assessment referring to a recent World Bank study
No. 29 WEINGARTEN, P. (2000):
Buchbesprechung: BECKMANN, V. (2000): Transaktionskosten und institutionelle
Wahl in der Landwirtschaft: Zwischen Markt, Hierarchie und Kooperation No. 30 BROSIG, S. (2000):
A model of household type specific food demand behaviour in Hungary No. 31 UVAROVSKY, V., VOIGT, P. (2000):
Russia’s agriculture: Eight years in transition – Convergence or divergence of regional efficiency
No. 32 SCHULZE, E., TILLACK, P., GERASIN, S. (2001):
Eigentumsverhältnisse, Rentabilität und Schulden landwirtschaftlicher Großbetriebe im Gebiet Wolgograd
No. 33 KIELYTE, J. (2001):
Strukturwandel im baltischen Lebensmittelhandel No. 34 ШУЛЬЦЕ, Э., ТИЛЛАК, П., ГЕРАСИН, С. (2001):
Отношениясобственности, рентабельностьидолгикрупныхсельскохозяйст
-венныхпредприятийвВолгоградскойобласти No. 35 FROHBERG, K., HARTMANN, M. (2002):
Konsequenzen der Integration im Agrar- und Ernährungssektor zwischen Beitritts-ländern und EU-15
No. 36 PETRICK, M. (2001):
Documentation of the Poland farm survey 2000
No. 37 PETRICK, M., SPYCHALSKI, G., ŚWITŁYK, M., TYRAN, E. (2001):
Poland's agriculture: Serious competitor or Europe's Poorhouse? Survey results on farm performance in selected Polish voivodships and a comparison with German farms
No. 38 HOCKMANN, H., KASHTANOVA, E., KOWSCHIK, S. (2002):
Lage und Entwicklungsprobleme der weißrussischen Fleischwirtschaft No. 39 SCHULZE, E., TILLACK, P., PATLASSOV, O. (2002):
Einflussfaktoren auf Gewinn und Rentabilität landwirtschaftlicher Großbetriebe im Gebiet Omsk, Russland
No. 40 ШУЛЬЦЕ, Э., ТИЛЛАК, П., ПАТЛАССОВ, О. (2002):
Факторы, влияющиенаприбыльирентабельностькрупныхсельскохозяйст
-венныхпредприятийвОмскойобластивРоссии
No. 41 BAVOROVÁ, M. (2002):
Entwicklung des tschechischen Zuckersektors seit 1989 No. 42 FROHBERG, K., WEBER, G. (2002):
Auswirkungen der EU-Osterweiterung im Agrarbereich No. 43 PETRICK, M. (2002):
Farm investment, credit rationing, and public credit policy in Poland – A microeconometric analysis –
No. 44 KEDAITIENE, A., HOCKMANN, H. (2002):
Milk and milk processing industry in Lithuania: An analysis of horizontal and vertical integration
No. 45 PETRICK, M. (2003):
Empirical measurement of credit rationing in agriculture: A methodological survey No. 46 PETRICK, M., LATRUFFE, L. (2003):
Credit access and borrowing costs in Poland’s agricultural credit market: A hedonic pricing approach
No. 47 PETRICK, M., BALMANN, A., LISSITSA, A. (2003):
Beiträge des Doktorandenworkshops zur Agrarentwicklung in Mittel- und Osteuropa 2003
No. 48 SCHULZE, E., TILLACK, P., MOSASHWILI, N. (2003):
Zur wirtschaftlichen Situation georgischer Landwirtschaftsbetriebe No. 49 ЛИССИТСА, А., БАБИЧЕВА, Т. (2003): Теоретическиеосновыанализапродуктивностииэффективности cельскохозяйст -венныхпредприятий No. 50 ЛИССИТСА, А., БАБИЧЕВА, Т. (2003): AнализОболочкиДанных (DEA) – Современнаяметодикаопределения эффективностипроизводства No. 51 ЛИССИТСА, А., ОДЕНИНГ, М., БАБИЧЕВА, Т. (2003): 10 летэкономическихпреобразованийвсельскомхозяйствеУкраины – Анализэффективностиипродуктивностипредприятий
No. 52 LISSITSA, A., STANGE, H. (2003):
Russischer Agrarsektor im Aufschwung? Eine Analyse der technischen und Skalen-Effizienz der Agrarunternehmen
No. 53 VALENTINOV, V. (2003):
Social capital, transition in agriculture, and economic organisation: A theoretical perspective
No. 54 BORKOWSKI, A. (2003):
Machtverteilung im Ministerrat nach dem Vertrag von Nizza und den Konvents-vorschlägen in einer erweiterten Europäischen Union
No. 55 KISS, P., WEINGARTEN, P. (2003):
Cost of compliance with the acquis communautaire in the Hungarian dairy sector No. 56 WEINGARTEN, P., FROHBERG, K., WINTER, E., SCHREIBER, C. (2003):
Quantitative analysis of the impacts of Croatia’s agricultural trade policy on the agri-food sector
No. 57 БОКУШЕВА, Р., ХАЙДЕЛЬБАХ, О. (2004):
Актуальныеаспектыстрахованиявсельскомхозяйстве
No. 58 DERLITZKI, R.,SCHULZE, E. (2004):
Georg Max Ludwig Derlitzki (1889-1958) No. 59 VŐNEKI, E. (2004):
Zur Bewertung des Ungarischen SAPARD-Programms unter besonderer Berücksichtigung der Investitionen im Milchsektor
No. 60 ЧИМПОЕШ, Д., ШУЛЬЦЕ, Э. (2004):
Основныеэкономические проблемысельскогохозяйстваМолдовы No. 61 BAUM, S., WEINGARTEN, P. (2004):
Interregionale Disparitäten und Entwicklung ländlicher Räume als regionalpolitische Herausforderung für die neuen EU-Mitgliedstaaten
No. 62 PETRICK, M. (2004):
Can econometric analysis make (agricultural) economics a hard science? Critical remarks and implications for economic methodology
No. 63 SAUER, J. (2004):
Rural water suppliers and efficiency – Empirical evidence from East and West Germany
No. 64 PETRICK, M., BALMANN, A. (2004):
Beiträge des 2. Doktorandenworkshops zur Agrarentwicklung in Mittel- und Osteuropa 2004
No. 65 BOJNEC, S., HARTMANN, M. (2004):
Agricultural and food trade in Central and Eastern Europe: The case of Slovenian intra-industry trade
No. 66 GLITSCH, K., EERITS, A. (2004):
Der slowakische Markt für Milch und Milchprodukte – Vom Beginn der Transformation bis zum EU-Beitritt
No. 67 FISCHER, C. (2004):
Assessing Kosovo's horticultural potential – The market for fruit and vegetables on the balkans
No. 68 PETRICK, M., SCHREIBER, C., WEINGARTEN, P. (2004):
Competitiveness of milk and wine production and processing in Albania No. 69 ШТАНГЕ, Г., ЛИССИТСА, А. (2004):
АграрныйсекторРоссиинаподъеме?! Анализтехническойэффективностиаг
-рарныхпредприятий
No. 70 SAUER, J. (2004):
Die Ökonomie der (Ländlichen) Wasserversorgung No. 71 HAPPE, K., BALMANN, A., KELLERMANN, K. (2004):
The Agricultural Policy Simulator (Agripolis) – An agent-based model to study structural change in agriculture (Version 1.0)
No. 72 BAUM, S., TRAPP, CH., WEINGARTEN, P. (2004):
Typology of rural areas in the Central and Eastern European EU new member states No. 73 PETRICK, M. (2004):
Governing structural change and externalities in agriculture: Toward a normative institutional economics of rural development
No. 74 RODIONOVA, O., SCHULZE, E., UERKOV, E., KARPOVA, G. (2004):
Zur Besteuerung von Agrarholdings in Russland
No. 75 HEIDELBACH, O., BOKUSHEVA, R., KUSSAYINOV, T. (2004):
Which type of crop insurance for Kazakhstan? – Empirical results No. 76 BOKUSHEVA, R. (2004):
Crop insurance in transition: A qualitative and quantitative assessment of insurance products
No. 77 RAMANOVICH, M., LAJTOS, I. (2004):
Milchproduktion und -verarbeitung in Weißrussland: Eine Analyse der Wettbewerbsfähigkeit
No. 78 LUKA, O., LEVKOVYCH, I. (2004):
Intra-industry trade in agricultural and food products: The case of Ukraine No. 79 EINAX, CH., LISSITSA, A., PARKHOMENKO, S. (2005):
Getreideproduktion in der Ukraine – Eine komparative Analyse von Produktionskosten No. 80 ИВАХНЕНКО, О., ЛИССИТСА, А. (2005):
Информационно-консультационнaяслужбa ваграрно-промышленном
No. 81 ROTHE, A., LISSITSA, A. (2005):
Der ostdeutsche Agrarsektor im Transformationsprozess – Ausgangssituation, Entwicklung und Problembereich
No. 82 РОТЭ, A., ЛИССИТСА, А. (2005):
Аграрный секторВосточнойГерманиивпереходном периоде – Исходная
ситуация, развитиеиосновныепроблемы
No. 83 CURTISS, J., PETRICK, M., BALMANN, A. (2004):
Beiträge des 3. Doktorandenworkshops zur Agrarentwicklung in Mittel- und Osteuropa 2005
No. 84 SVETLOV, N., HOCKMANN, H. (2005):
Technical and economic efficiency of Russian corporate farms: The case of the Moscow region
No. 85 МЕЛЬНИЧУК, В., ПАРХОМЕНКО, С., ЛИССИТСА, А. (2005):
Процессформированиярынкa сельскохозяйственныхземельвУкраине No. 86 MELNYCHUK, V., PARKHOMENKO, S., LISSITSA, A. (2005):
Creation of agricultural land market in Ukraine: Current state of development No. 87 ROTHE, A., LISSITSA, A. (2005):
Zur Wettbewerbsfähigkeit der ostdeutschen Landwirtschaft – Eine Effizienzanalyse landwirtschaftlicher Unternehmen Sachsen-Anhalts und der Tschechischen Republik No. 88 BROSIG, S., YAHSHILIKOV, Y. (2005):
Interregional integration of wheat markets in Kazakhstan No. 89 GRAMZOW, A. (2005):
Experience with Endogenous Rural Development Initiatives and the Prospects for Leader+ in the Region "Dolina Strugu", Poland
No. 90 GRAMZOW, A. (2006):
Local partnership as an incubator for rural development: The case of Dębrzno, North-western Poland
No. 91 ЧИМПОЕШ, Д., ШУЛЬЦЕ, Э. (2006):
ЭкономическоесостояниесельскохозяйственныхпредприятийРеспублики
Молдова
No. 92 ЛИССИТСА, A., ЛУКА, O., ГАГАЛЮК, Т., КВАША, С. (2006):
ЕдинаяаграрнаяполитикаЕвропейскогоСоюза – Путьстановленияипринципы функционирования
No. 93 SCHMITZ, S., BROSIG, S., DEGTIAREVICH, J., DEGTIAREVICH, I., GRINGS, M. (2006):
Grodno household survey – Sources and utilization of foodstuffs in Belarusian households
No. 94 RUNGSURIYAWIBOON, S., LISSITSA, A. (2006):
No. 95 GRAMZOW, A. (2006):
Endogenous initiatives as a chance to improve rural livelihood? Results of a case study in Bałtów, South-eastern Poland
No. 96 DUFHUES, T., BUCHENRIEDER, G., FISCHER, I. (2006):
Social capital and rural development: Literature review and current state of the art No. 97 WOLZ, A., FRITZSCH, J., PENCÁKOVÁ, J. (2006):
Social capital among agricultural producers in the Czech Republic: Its impact on economic performance
No. 98 BOKUSHEVA, R., BUCHENRIEDER, G.(2006):
Contributions to the 4th Young Scientists Workshop on agricultural development in Central and Eastern Europe – YSW-2006
No. 99 HOCKMANN, H., RAMANOVICH, M. (2006):
Zur Wettbewerbsfähigkeit der weißrussischen Milchwirtschaft: Eine Anwendung des Porterschen Diamanten
No. 100 GRAMZOW, A. (2006):
Doświadczenia oddolnych inicjatyw rozwoju regionalnego oraz perspektywy dla programu leader+ w regionie Doliny Strugu w Polsce
No. 101 GRAMZOW, A. (2006):
Partnerstwo Lokalne jako inkubator rozwoju terenów wiejskich: Przypadek Debrzna, północno-zachodnia Polska
No. 102 XIANGPING, J., BUCHENRIEDER, G. (2007):
Documentation of a multi-topic questionnaire-based survey on sustainable resource use in rural China
No. 103 GRAMZOW, A. (2007):
Oddolne inicjatywy jako szansa poprawy jakości życia na wsi? Wyniki studium przypadku w Bałtowie (Południowo-Wschodnia Polska)
No. 104 RUNGSURIYAWIBOON, S., WANG, X. (2007):
Agricultural efficiency and productivity in China: A metafrontier approach
No. 105 TREFFLICH, A., UETRECHT, I., EFKEN, J., SCHÄFER, M., STEINBAUER, C., WENDT, H.
(2007):
Support scheme of food processing firms: A driving force for rural development? No. 106 BOJNEC, Š., FERTŐ, I.(2007):
Comparative advantages in agro-food trade of Hungary, Croatia and Slovenia with the European Union
No. 107 FERTŐ, I.(2007):
Spatial developments of Hungarian agriculture in the transition: The case of crop production
Die Discussion Papers sind erhältlich beim Leibniz-Institut für Agrarentwicklung in Mittel- und Osteuropa (IAMO) oder im Internet unter http://www.iamo.de.
The Discussion Papers can be ordered from the Leibniz Institute of Agricultural Development in Central and Eastern Europe (IAMO). Use our download facility at http://www.iamo.de.