F
EDERALR
ESERVEB
ANK OFS
T.L
OUISS
UPERVISORYP
OLICYA
NALYSISW
ORKINGP
APERWorking Paper 2005-03
Consumer-Finance Myths and Other Obstacles to Financial
Literacy
William R. Emmons Senior Economist and Manager Federal Reserve Bank of St. Louis
This draft: April 2005
The views expressed in this paper are those of the author(s), not necessarily those of the Federal Reserve Bank of St. Louis or the Federal Reserve System.
CONSUMER-FINANCE MYTHS AND OTHER OBSTACLES TO FINANCIAL LITERACY
WILLIAM R. EMMONS*
The consumer-finance market for middle and upper-income households in the United States is characterized by a wide range of choices, both in terms of financial-services providers and the specific products and services available.1 Prices generally are determined in competitive
markets. Consumer-protection regulation is extensive. Why then is there so much
dissatisfaction with the U.S. consumer-finance market, even for prime-quality customers? This paper focuses not on inadequate choices, inadequate competition or regulation, but on the difficulty many middle and upper-income households encounter in making good financial decisions—that is, a low average level of financial literacy. Millions of households are unable to make wise financial decisions even when adequate information is available. Low levels of financial skills provide a fertile environment for consumer-finance myths to arise and gain widespread acceptance.
The first section of this paper describes some basic financial decision-making skills and their prevalence in the general population. The purpose of this section is to demonstrate how low the level of basic financial literacy is in the United States. The discussion in this section is based on a large nationwide survey of households regarding their actual financial behaviors and their use of various financial products. The second section of the paper discusses more complex financial concepts needed to see through some of the most common consumer-finance myths.
The third section of the paper explores seven consumer-finance myths—beliefs, rules of thumb, or marketing pitches that are misleading or untrue. The myths I discuss generally fall into three categories, relating to interest rates, the risks of borrowing, and the home ownership decision. The first two consumer-finance myths persist because of an inadequate understanding of interest rates. The third and fourth myths stem from a poor understanding of debt contracts.
*
Federal Reserve Bank of St. Louis, P.O. Box 442, St. Louis MO 63166-0442, 314-444-8844,
William.R.Emmons@stls.frb.org. Paper presented at the Saint Louis University School of Law conference, “Consequences of the Consumer Lending Revolution.” The views expressed in this paper are not necessarily those of the Federal Reserve Bank of St. Louis or the Federal Reserve System.
Myths number five and six are perpetuated because the financial implications of home ownership are complicated. The seventh consumer-finance myth afflicts not just consumers but also those scholars, policy-makers, regulators, and consumer advocates who believe that just a little more time, or money, or education, or financial-literacy training will create a financially literate population once and for all.
The paper’s fourth section discusses obstacles to attaining widespread financial literacy. For those who are not financially savvy now—that is to say, most of the population—the perpetuation of these myths is especially likely. The final section concludes.
I. BASIC FINANCIAL LITERACY IN THE UNITED STATES
Consumers must make many financial decisions, from the most basic cash-flow
management to complex investment choices and retirement planning. It would not be surprising if a large number of people find complex financial decision-making difficult. However, existing evidence suggests that even basic financial literacy is by no means common among U.S.
households. Some types of basic consumer financial decision-making are more problematic than others.
What does one need to do or know to be financially literate? At a minimum, consumers must be able to keep track of their cash resources and all payment obligations, know how to open an account for saving and how to apply for a loan, and have a basic understanding of health and life insurance. A financially savvy consumer compares competing offers and can plan for future financial needs such as buying a house, sending a child to college, and retirement.
Unfortunately, financial knowledge is in short supply. A survey conducted in 2002 by the JumpStart Coalition found that 12th graders could correctly answer only 50% of the questions on a basic financial-skills quiz.2 Adults sometimes do better on tests like this, but still show gaps in their financial knowledge as well as in their actual financial behaviors. The lack of basic
financial knowledge correlates with poor financial management, including such behaviors as using payday lenders or check-cashing services, incurring late fees on credit cards, failing to maintain precautionary savings balances, passing up employer matching contributions to retirement accounts, and being chronically under-insured.
1
There are many other problems that are unique to low-income households in the consumer-finance market. This paper does not address those difficulties specifically.
Tables 1 and 2 summarize a recent study of adult consumers’ financial behaviors and their use of basic financial products.3 A study of specific financial behaviors is likely to be more informative and reliable than a study of financial knowledge because knowledge alone does not guarantee that households will act wisely when making actual financial decisions. After all, some (much?) financial advertising is designed to confuse consumers or reinforce bad habits (for example, impulse shopping), inhibiting the translation of knowledge into action.
The survey questions were asked as part of the November and December 2001 waves of the University of Michigan Survey Research Center’s monthly “Surveys of Consumers.”4 This survey has been conducted monthly since 1940 and occasionally contains special questions to investigate topics such as household financial management. The sample included 1,004
randomly selected households from across the country. Interviews were conducted by telephone. Table 1 summarizes the percentage of the sampled households that reported engaging in specific financial behaviors that typically are associated with basic financial literacy. The sample households were not told that financial literacy was being investigated. The four main consumer-finance categories included cash-flow management, savings, investment, and credit management.
One general conclusion one can draw from Table 1 is that U.S. households do not
consistently demonstrate the basic skills of financial literacy. To be sure, some households are very savvy financially, but the overall picture is of a mediocre level of financial literacy. Of the eighteen specific financial behaviors listed in the table, a majority of the sampled households did
not demonstrate that behavior in eleven cases—that is, for most of the behaviors investigated (eleven out of eighteen), a majority of households did not demonstrate them. Another way to say this is that the median (or typical) percentage of households demonstrating one of the desirable financial behaviors was only 47.5%.
Among the various types of financial behaviors summarized in Table 1, the highest average level of financial skill was in cash-flow management. A clear majority of households reported that they had a checking account, paid bills on time, kept financial records, and balanced their
2
Marianne A. Hilgert et al., Household Financial Management: The Connection between Knowledge and Behavior, 89 FED.RES.BULL.309,311(2003).
3
Id. at 309-22; See also Sandra Braunstein & Carolyn Welch, Financial Literacy: An Overview of Practice, Research, and Policy, 88 FED.RES.BULL. 445, 453-55 (2002).
4
General information about the survey can be accessed at the University of Michigan Survey of Consumers web page, available at http://www.sca.isr.umich.edu (last visited Mar. 26, 2005).
checkbooks monthly. (No attempt was made to verify if households’ responses to these or any other questions were accurate.) The lowest level of financial literacy was in the area of
investment—perhaps not surprising given the complexity of the task, as well as the inherent “avoidability” of learning about or making investment decisions. A bare majority of sampled households practiced diversification across investment categories, and only a third or fewer participated in some kind of retirement investment plan (not counting Social Security, which is involuntary).
Credit appears to be reasonably well managed according to the survey results—at least compared to the other types of consumer-finance tasks. However, the act of “reviewing credit report,” which is done by 58% of households, may not be as important for financial well-being as paying credit-card bills on time to avoid finance charges (49%) or comparing credit-card offers (35%). Moreover, various data sources suggest that a significantly larger number of households actually may run balances on their credit cards than admit doing so in surveys.5
Thus, it is safe to say that a clear majority of U.S. households with credit cards do not shop around when applying for a card and end up paying finance charges on the cards they use. These facts alone might support the conclusion that credit management is poor in the average U.S. household. Another indication of poor credit management is the fact (not shown in the table) that virtually all households that are paying high rates of interest on credit-card balances simultaneously hold balances in low-yielding assets, such as checking or savings deposits or money-market mutual funds, or have housing equity against which they could borrow at a lower rate.6 These balances sometimes are substantial and could be used to pay down or eliminate
5
Only 44.4% of households reported running a balance on credit cards in the Federal Reserve’s 2001 Survey of Consumer Finances, with a median reported value of $1,900. See Ana M. Aizcorbe et al., Recent Changes in U.S. Family Finances: Evidence From the 1998 and 2001 Survey of Consumer Finances, 89 FED.RES.BULL. 1, 23 (2003). Meanwhile, banks and other financial institutions reported an average of $722.3 billion of outstanding revolving lines of consumer credit (mostly credit cards) during 2001. If only 44.4% of the approximately 108 million households at that time had outstanding balances, then the average balance would be $15,630, or almost eight times the median reported by consumers. One plausible explanation for the discrepancy is that a larger fraction of households actually had outstanding balances than said they did in the survey. See Statistical Release, U.S. Federal Reserve, Federal Reserve Statistical Release G.19: Consumer Credit, available at
http://www.federalreserve.gov/releases/g19/current/default.htm (Mar. 7, 2005). 6
For example, 33% of households that were borrowing on their credit cards had liquid assets (cash, checking or savings accounts, or money-market mutual funds) greater than one month’s income. Moreover, 69% of households borrowing on their credit cards had positive housing equity, against which they could borrow at lower cost than with credit cards. This anomalous behavior is not due solely to low-income households. In fact, among credit-card borrowing households with more than $50,000 of income during 1995 (equivalent to about $62,000 in 2004 inflation-adjusted dollars), 34% had more than one month’s income in liquid assets and 86% had positive home
credit-card balances, resulting in meaningful savings to the household. Perhaps the clearest evidence of U.S. households’ poor credit-management skills is the more than 13 million non-business bankruptcy filings in the United States during the ten years ending Sept. 30, 2004—a period of generally falling interest rates and low unemployment rates.7 A high rate of
bankruptcy filings suggests that a large segment of the population lacks adequate credit-management skills.8
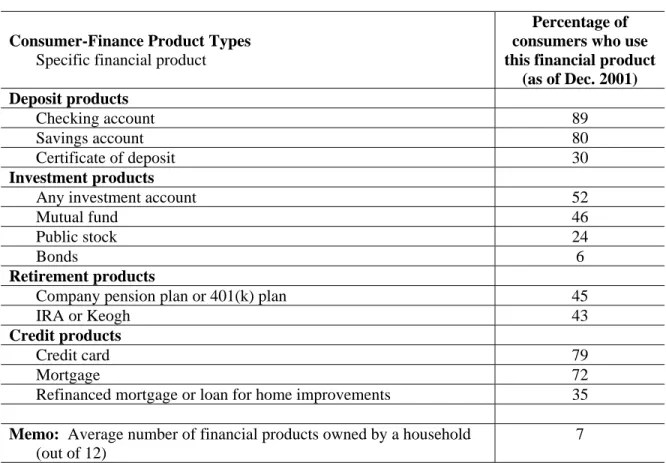
Table 2 summarizes the percentage of the sampled households that owned or used specific financial products from among the categories of deposit, investment, retirement, and credit products. As was the case in Table 1, it is apparent in Table 2 that households are more actively engaged in cash and credit management while being less actively engaged in investment and retirement decisions. As before, households’ use of credit products is difficult to interpret without further information. More than 70% of households have a credit card and a mortgage, but are these credit instruments being used wisely? As discussed previously, we have reasons to believe many households do not use credit cards wisely. As we will discuss later, a poor
understanding of the costs and risks of mortgage debt also may inform households’ mortgage borrowing decisions.
In sum, U.S. households’ average level of basic financial literacy is moderate at best. Cash management is done reasonably well by most households, while long-term investment decision-making—including retirement planning—is done poorly by the average household (in some cases by doing nothing at all). Credit-management skills lie somewhere in-between cash-management and investment-planning abilities. Most U.S. households are active users of
mortgage credit and other forms of credit.9 There are reasons to believe many households’ credit decisions could be improved, as the rest of the paper discusses.
equity. David B. Gross & Nicholas S. Souleles, Do Liquidity Constraints and Interest Rates Matter For Consumer Behavior? Evidence From Credit Card Data, 117 Q.J.ECON. 149, 178 (2002).
7
News Release, Administrative Office of the U.S. Courts, Bankruptcy Filings Down in Fiscal Year 2004 (Dec. 3, 2004), available at http://www.uscourts.gov/Press_Releases/archive2004.html.
8
To put 13 million non-business bankruptcy filings in perspective, there were about 99 million households in the U.S. in 1995, and there are about 112 million households today. Thus, even if there were some repeat filers and multiple members of single households among the 13 million, roughly one in ten U.S. households has filed for bankruptcy during the last decade.
9
Three fourths of U.S. families surveyed had some debt outstanding. Among families headed by someone between 35 and 44 years old, more than 85 percent have some debt. Aizcorbe, supra note 5, at 23.
II. ADVANCED CONSUMER-FINANCE CONCEPTS
A review of recent consumer-finance surveys indicates that basic financial literacy is only moderate in the average U.S. household.10 Some subtle and complex financial concepts are widely misunderstood by many people. A clear example from the survey discussed in the previous section is the lack of retirement planning by two thirds of the population (Table 1). Apparently it is difficult for many to appreciate how important early and consistent saving is for financial security in retirement, despite ample saving options, advice, and tax benefits for doing so.
To set the stage for the discussion of some consumer-finance myths in the next section, I discuss three advanced consumer-finance concepts here: 1) interest rates, 2) the risks of borrowing, and 3) the housing decision.
A. Real Interest Rates and Duration
Two fundamentally important concepts in financial theory are real interest rates and
duration. The first draws a distinction between the stated, or nominal, rate of interest on a debt and the equivalent hypothetical rate of interest that would prevail if there were no inflation expected over the life of the obligation. The concept of duration summarizes both the sensitivity of a fixed-income obligation’s fair value to changes in interest rates and, more importantly for our purposes, the amount of time until half of the debt has been repaid (i.e., the average maturity of repayments). Duration takes into account the fact that interest and principal are paid at various points in time, not just at maturity, and that the level of interest rates affects the distribution of the repayment burden over time.
1. Real Interest Rates
The true cost of borrowing—the wealth you will give up later to obtain cash today—is best expressed as a real (after-inflation) interest rate.11 What is the cost of a 30-year fixed mortgage rate at 6%? If the inflation rate is expected to be 6% annually during the period you hold the mortgage, the real interest rate, or cost of borrowing, is expected to be zero. In this case, borrowing is essentially “free”—in terms of purchasing power, the total number of dollars you
10
See generally Braunstein, supra note 3; Hilgert, supra note 2. 11
The concepts of nominal and real interest rates are discussed in every basic finance textbook. On-line information is also available. See, e.g., Mike Moffat, What’s the Difference Between Nominal and Real?, at
repay will buy no more than the dollars you borrowed. If inflation is expected to be about 2% annually (as is currently the situation), the real interest rate is expected to be 4%. In this case, borrowing is relatively expensive because the lender will be able to buy 4% per year more goods and services with the dollars you repay than you can buy with the money you borrowed.12
The mathematical relationship between nominal (actual) and real interest rates was summarized by Irving Fisher more than a century ago.13 The so-called Fisher equation distinguishes between the dollars a debtor must repay and the purchasing power those dollars represent. The Fisher equation is (except for a small rounding error):
rr = nr – i, or
Real interest rate = Nominal interest rate — Expected inflation rate.
That is, one should subtract the loss of purchasing power expected due to inflation from the stated nominal rate paid on any debt to approximate the true economic cost of borrowing or, conversely, the economic gain from lending.
The rationale for making an inflation adjustment to interest rates is based on the historical evidence that wages, prices, and incomes tend to rise or fall together over time in ways that are unrelated to the economic transactions people are willing (or unwilling) to enter. That is, the “general price level” seems to move up and down over time, creating inflation or deflation. Suppose, for example, that the market value of your house doubles, but your income and the prices of all houses and everything else you buy also doubles. You are no better or worse off than before and you have no reason to engage in any transactions in response to the price changes. The doubling of your house price reflects nothing but a doubling of the general price level, or inflation of 100%.
Another example more clearly related to the Fisher equation is a decline in mortgage rates— say, from 8% to 6%—that occurs when the expected inflation rate declines by the same two percentage points—from 4% to 2%. The expected real interest rate was, and remains, 4%. Nominal rates fell, but real rates remained the same—so should you change your financial
12
Although there were frequent periods of deflation in the U.S. lasting a year or more before the 1950s, there have been none since 1955. During the last fifty years, annual inflation rates in the U.S. have been as high as 13.5% (1980) and as low as 1.0% (1961). U.S. Dept. of Labor, Bureau of Labor Statistics, Consumer Price Index: All Urban Consumers, available at ftp://ftp.bls.gov/pub/special.requests/cpi/cpiai.txt (Mar. 23, 2005).
13
See generally IRVING FISHER,APPRECIATION AND INTERESTin MATHEMATICAL INVESTIGATIONS IN THE THEORY OF VALUE AND PRICE &APPRECIATION AND INTEREST (Augustus M. Kelley 1961), 333-442 (1896).
behavior, for example, by refinancing your mortgage? The answer to this question is complex and is the subject of later sections of the paper.
2. Duration
Understanding the idea of duration (if not its mathematical definition) is important because people may be fooled by one financial contract that appears identical to another except that their durations differ. A recent illustration is presented by falling mortgage interest rates. The
important point is that, as a matter of mathematics, the duration of a mortgage (or any other fixed-rate debt instrument) increases as nominal interest rates decline.
To illustrate the issue this creates, consider a simple example. A two-year, 8%, $100,000 mortgage with annual payments requires two equal payments of $56,077 at the end of the first and second years. A two-year, 6%, $100,000 mortgage with annual payments requires equal payments of $54,543.50 at the end of the first and second years. The first annual payment represents 52% of the 8% mortgage’s economic value, but only 51% of the 6% mortgage’s economic value. In other words, the lower interest rate reduces each (nominal) payment and allows the borrower to push some of the burden of repayment (in financial terms, the present discounted value) into the future. That is, the duration of the 6% mortgage is greater than the duration of the 8% mortgage.
The duration-increasing effects of declining interest rates are much larger with 30-year mortgages. A household that replaces a year, 8%, $100,000 fixed-rate mortgage with a 30-year, 6%, $100,000 fixed-rate mortgage effectively has pushed the real burden of repaying the loan more than a year into the future, on average. The 8% mortgage has a duration of 9.6 years, while the 6% mortgage has a duration of 10.8 years. In other words, half of the 8% mortgage (in economic terms) will be paid off after 9.6 years, but it will take 10.8 years to pay off half of the 6% mortgage. The real amount of the two mortgages–$100,000–remains the same.
Most borrowers probably do not realize that the duration of their debt increases as the interest rate declines and, if they did, would not object. However, failure to understand duration makes consumers vulnerable to marketing pitches for “cash-out refinancing” transactions that increase the household’s principal balance while keeping monthly payments the same or even lower than before. A larger mortgage principal balance combined with a greater mortgage
duration unambiguously increases a household’s vulnerability to future economic shocks that could result in future financial distress or even default.
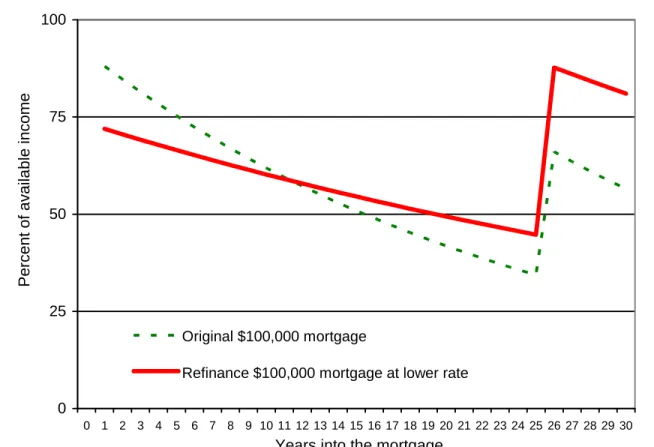
Figure 1 illustrates the effect of increasing duration on a mortgage borrower. The example is for a moderate-income homeowner who begins with a 30-year, 8% mortgage for $100,000. The fraction of the borrower’s income available to pay the mortgage (after taxes and other living expenses) in the first year is assumed to be 88%. As the borrower’s income increases with inflation of 4% per year, the burden of repaying the fixed-rate mortgage declines. The declining burden is shown by the dashed line in Figure 1. This borrower is expected to retire after twenty-five years, at which time her available income falls by half. Because inflation has pushed up her income over time, the burden of repaying the mortgage in retirement is manageable—only 66% of his available retirement income is needed to cover mortgage payments during year twenty-six. The downward slope of the repayment-burden schedule is known as the “tilt” of the mortgage.
The solid line in Figure 1 illustrates the effect of a once-and-forever decline in the inflation rate at the very beginning of this example from 4% to 2%, resulting in a decline of the mortgage rate from 8% to 6%. After refinancing, the homeowner’s new schedule of repayment burden is flatter than before. That is, the tilt has decreased and the duration has increased (because more of the burden has been shifted into the future). The borrower faces a lower repayment burden in the early years (through year ten), but a greater repayment burden in the later years compared to the original mortgage. The greatest stress over the lifetime of the mortgage now occurs during the borrower’s retirement, when the repayment burden peaks at about 88 percent of available income. We return to this example in a later section of the paper.
B. The Risks of Borrowing
1. Secured vs. Unsecured Loans
One crucial feature of a debt agreement is whether the borrower pledges any collateral to the lender. That is, can the lender seize valuable property or other assets of the borrower if the debt is not repaid in full on time? A mortgage is an example of a secured or collateralized loan, while a credit-card loan is an example of unsecured or uncollateralized debt. From the lender’s
perspective, a secured loan is less risky than an unsecured loan if the borrower has pledged valuable assets, such as a house. It stands to reason, therefore, that the interest rate on a secured loan will be lower than the rate on an unsecured loan to the same borrower. The difference in
rates, therefore, reflects differences in risk. There may be other factors that affect the spread between mortgage and credit-card loan rates, but risk differences are likely to be the most important.
The borrower’s perspective is the opposite of the lender’s perspective. To a borrower, an unsecured loan is less risky than a secured loan. This is because a homeowner can lose her house if she defaults on a mortgage, while no collateral is at risk with a credit-card debt.
2. Cash-out Refinancing
Millions of Americans have refinanced mortgages in recent years. In a refinancing, a homeowner takes out a new mortgage and uses the proceeds to pay off the old mortgage. If the new mortgage is larger than the old mortgage, the difference goes to the borrower as cash. In the example of Figure 1, the homeowner benefited immediately from lower required repayments on the new mortgage—albeit at the cost of a higher repayment burden later.
Freddie Mac (a government-sponsored enterprise that supports the mortgage market)
reported recently that 46% of all refinanced mortgages during 2004 were cash-out refinancings.14 Freddie Mac estimates that, for 2004 as a whole, the total amount of cash received by
homeowners refinancing into a larger principal balance was about $135 billion. In other words, the “new mortgages” amounted to $135 billion more than the “old mortgages” they replaced. Federal Reserve Chairman Alan Greenspan has discussed this trend toward “extraction” or “liquification” of home equity at the time of mortgage refinancing in several recent speeches.15
In contrast to its recently popularized pseudonyms with favorable connotations—“cash-out refinancing” and “extraction” or “liquification” of home equity—the practice of taking on a new mortgage larger than the one it replaces is nothing more than additional borrowing. The practice could just as accurately be termed “levering up” as “cashing out.” Ironically, the cash-out refi boom has been portrayed as a revolutionary new financial technique—monetary magic—when, in fact, it is simply a decision by a household to go deeper into debt.
C. The Housing Decision
1. Housing Wealth
14
This is equivalent to about 1.5% of total household disposable income for 2004. See Freddie Mac, Cash-Out Refi Report: 4Q2004, at http://freddiemac.com/news/finance/docs/annual_censusrefi.xls (last visited Mar. 28, 2005). 15
See, e.g., Alan Greenspan, Remarks at America’s Community Bankers Annual Convention, available at
To an economist, the fundamental value of a financial asset is determined by the future cash flows it produces for its owner. To determine the value of a bond or a stock, an economist specifies (for a bond) or estimates (for a stock) the cash flows it will generate in the future. Each future cash flow then is “discounted” to reflect its riskiness and how far into the future it will occur. Riskier payments and those that will occur further in the future are discounted more because an investor prefers safe payments that occur soon. The sum of all the expected discounted present values an asset will generate is its fundamental value.
Expected capital gains or losses play no part in this asset-pricing framework because any future gain or loss on the sale of a stock or bond merely reflects differences of opinion between the buyer and the seller of what the asset’s future cash flows (or appropriate discount rate) will be. Said another way, the seller’s capital gain or loss reflects nothing more than the buyer’s optimism or pessimism about the future of the asset. The mere sale of an asset cannot generate economic value to the economy as a whole; rather, fundamental value is created by the cash flows of the asset itself.
Determination of the fundamental value of a house is no different. The benefits a house produces are what economists call “housing services,” typically measured as the rent that could be charged if the house were placed in the rental market. Taxes, repairs, and maintenance costs should be subtracted from rental payments to arrive at a net yield. The fundamental value of the house therefore is the sum of the present discounted value of all future rental payments after expenses.
As with stocks and bonds, a capital gain or loss incurred by a household when it sells a house is meaningless from the perspective of the economy as a whole. The mere fact of selling a house does not create any new housing services to rent out. To be sure, rising house prices represent higher future rental payments—but this means only that renters will be paying more to their landlords for the same housing services. Tenants lose every dollar that landlords gain, and vice versa. For an owner-occupier, the rising value of one’s house is cancelled out by the higher rental payments she is foregoing by living in the house rather than renting it out. For the
economy as a whole, therefore, capital gains and losses on existing houses are, by definition, always exactly zero.16
16
For an extended discussion of this point, see Do House Price Increases Add to Net Wealth, in ORGANISATION FOR
2. Renting vs. Buying
Households may purchase housing services in two different ways—by renting a housing unit from someone else or by purchasing a housing unit for their own use. In becoming an owner-occupier, a household effectively is a landlord renting a house to itself. This characterization of the dual nature of homeownership is useful for three purposes—1) the government tracks these two distinct functions of owner-occupiers exactly this way for the purposes of economic
statistics; 2) it clarifies the current tax treatment of owner-occupied housing; and 3) it helps shed light on the consumer-finance aspects of homeownership—including the consumer-finance myths discussed in the next section.
The rent-vs.-buy decision is one of the most important and complicated financial decisions any household will make. The rational determinants of this decision include:
The household’s wealth, income, and access to financing;
The availability of the desired type of housing unit for rent and/or purchase (including number of rooms, quality, amenities, location, etc.);
The expected length of time one expects to stay in this housing unit;
Tax considerations, such as local property-tax rates and the household’s income-tax rate; and
Expectations about future increases in one’s income and housing prices and rents. Table 3 illustrates several relevant criteria for households facing the rent-or-buy decision. Each of these criteria should be interpreted under the assumption of “all other things being equal.” The point of the illustration is to suggest that the rent-vs.-buy decision is multi-dimensional and does not always come out in favor of buying. Some of the relevant criteria include:
A household with a steady income may be more suited to homeownership because it is better able to undertake the fixed financial commitment represented by a mortgage. A household with highly variable income, on the other hand, may need to reduce housing expenses relatively rapidly if income declines precipitously. For this household, the flexibility afforded by renting may be preferred.
A household with a large amount of wealth may be better suited for homeownership than a poor household because the idiosyncratic price risk of a house can be
diversified within a portfolio of other assets, such as stocks and bonds.
A household that has well-defined preferences for a certain type of housing unit—for example, a strong preference for a single-family home in good condition with four bedrooms, a two-car garage, and a large yard—may be better served by owning because there may be few or no rental units available with the desired characteristics.
Because the transactions costs involved in selling a house and moving to a new residence are high—likely around 10% of the value of the house, including sales commissions, financing-related fees, and moving expenses—it is better for a
household that expects to move within a short period of time to rent rather than own.
Households compete for housing units and, because there are tax preferences available to homeowners (both with and without mortgages), a household with a higher
marginal tax rate will find a given house cheaper to own on an after-tax basis than another household with a lower tax rate, all else equal. Some studies suggest that households in relatively low tax brackets (i.e., those facing marginal tax rates of less than 25 to 30%) may be better off financially by renting rather than buying under most circumstances, holding other factors constant.17
Owning a house provides a hedge against unexpected future increases in the rental price of housing. A household that has a low tolerance for bearing the risk of future “rent shocks” will benefit more from owning a house than a household that is more tolerant of such risk.
III. SEVEN CONSUMER-FINANCE MYTHS
Armed with a better understanding of some complicated financial topics, it is possible to puncture several myths of consumer finance. These myths (and others) persist both because it is not readily apparent to most consumers what the truth of the matter is, and because those who could destroy these myths face insufficient incentives to do so. Financial-services providers benefit from financial illiteracy in some cases, while other knowledgeable and respected public
17
figures often are focused on short-term imperatives that conflict with prudent long-run consumer behavior.18
The seven consumer-finance myths discussed in this section are: 1. “Interest rates have never been lower.”
2. “All that matters is your monthly payment.”
3. “Always pay off high-rate debt with lower-rate debt.” 4. “Cash-out refinancing is a source of spendable income.” 5. “Rising house prices make us all richer.”
6. “All Americans’ dream is to own their own homes.”
7. “All we need to do to solve the financial-illiteracy problem is dedicate more time/money/information/training, etc., etc.”
A. Myth #1: “Interest rates have never been lower”
It simply is not true that interest rates during the last few years are at their lowest level ever. Thirty-year fixed mortgage rates and the yield on high-quality corporate bonds (Aaa rated) have averaged slightly below six percent since the beginning of 2003. To be sure, this is the first sub-six percent period for these long-term interest rates since 1967—making current yields the lowest in more than thirty-five years.19
We don’t have reliable data on long-term mortgage yields much before the early 1960s, but corporate bonds issued by strong companies (Aaa or equivalent) carried yields below 6%
continuously from 1800 through 1967. In other words, when considering the 205-year span between 1800 and 2004, the anomalous episode was the thirty-five year period 1968-2002, when long-term yields were above 6%. Between 1880 and 1960, corporate bond yields generally were below 4 percent (with the exception of the aftermath of World War I).20
Moreover, the claim that current long-term rates are exceptionally low is not true, even during the last forty years, if we consider real (after-inflation) rates. The average expected real
18
For example, Federal Reserve and other economic policymakers rarely admonish the public and businesses to borrow and spend less in order to save more. This is because reduced borrowing and spending would slow the economy’s growth in the short run, even though it might improve long-term growth prospects.
19
Federal Reserve Bank of St. Louis, Moody’s Seasoned Aaa Corporate Bond Yield, at
http://research.stlouisfed.org/fred2/series/AAA/119/Max (last visited Mar. 28, 2005). 20
30-year mortgage rate during 1963-2003 was 4.06%.21 If CPI inflation remains in the range of 2% to 2.5% (as the Federal Reserve intends), a 5.75% mortgage contracted today will represent about a 3.5% real rate of interest—not far below the average real rate for the 1963-2003 period. Those fortunate enough to have borrowed when nominal mortgage rates briefly fell to 5.25% in June 2003 may experience about a 3% real rate. However, most of the mortgage debt incurred during the last few years likely will turn out to bear real interest rates of 3% to 4%. Higher inflation would result in lower realized real rates, and vice versa.
The danger of this myth is that borrowers may believe the cost of borrowing is at “once-in-a-lifetime” low levels and therefore borrow large amounts of money they later regret. If inflation remains relatively low, the true cost of mortgage borrowing today will turn out to be near its long-run average.
B. Myth #2: “All that matters is your monthly payment”
A typical context in which this consumer-finance myth might appear is a mortgage or auto-loan closing. The smiling banker reassures the nervous borrower that, despite the staggering sum of total interest payments to which she is about to commit herself, there is really nothing to worry about. “Can you make that monthly payment?” the lender asks, pointing to the amount on the contract. Before waiting for her answer, he purrs, “Of course you can—and that’s all you need to know. Just sign right here.”
Your monthly payment is not all you need to know about your loan, of course. The effective annual rate you are paying, the fees, the term to maturity, myriad contract contingencies, and other details also matter a great deal.
Another key characteristic of the loan that even the lender may not understand is its duration (see previous discussion for an explanation of duration). Lower nominal interest rates produce a lower monthly payment, but they also increase the duration of the debt. In other words, more of
21
Cf. Federal Reserve Bank of St. Louis, 30-Year Conventional Mortgage Rate, at
http://research.stlouisfed.org/fred2/series/MORTG/114/Max (last visited Mar. 28, 2005) (graphically demonstrating the 30-year conventional mortgage rate from 1970 to 2005); Federal Reserve Bank of St. Louis, Consumer Price Index For All Urban Consumers: All Items, at http://research.stlouisfed.org/fred2/series/CPIAUCNS/9/Max (last visited Mar. 28, 2005) (graphically demonstrating the consumer price index from 1945 to 2005). Expected real mortgage rates were calculated as the nominal mortgage rate during a given month minus the twenty-four month centered average annualized CPI inflation rate. That is, expected inflation at any point in time is assumed to be the geometric average of last year’s and next year’s inflation rates. This approach reflects the empirical fact that inflation expectations are slow-moving, so last year’s inflation is relevant; and that expectations about next year’s inflation rate may be approximately rational (unbiased).
the real burden of repayment is pushed into the future. It will take longer to pay off any given fraction of the loan than before, increasing the potential repayment stress later in the loan term.
Figure 1 illustrates the duration-increasing effect of a decline in nominal interest rates that is due entirely to a decline in expected inflation. The real interest rate remains the same. The tilt (slope) of the schedule of repayments relative to available income declines (becomes less steep). This means that earlier payments become less burdensome while later payments become more burdensome than under a contract with a higher inflation and interest rate. Of course, the total amount to be repaid remains the same.
The danger of this myth is that borrowers may not understand the trade-off they are
accepting between less-burdensome early payments and more-burdensome later payments. The immediate attraction of a lower monthly payment may obscure the risk of later payments that remain larger in real terms because inflation has not eroded them as much as would be the case with higher inflation and interest rates.
C. Myth # 3: “Always pay off high-rate debt with lower-rate debt”
This strategy should save the borrower money in the short run, but it involves risks down the road. This is because the lower-rate debt invariably requires the borrower to pledge some valuable collateral to secure the loan.
An example of a high-interest rate loan is credit-card debt. A mortgage is a lower-rate loan. As discussed previously, the primary reason the loan rates differ is that the lender faces different exposures to loss. The credit-card lender has no claim on the borrower’s collateral to mitigate losses, while the mortgage lender can take the borrower’s house. Thus, a consumer who lowers her interest rate is probably giving a security interest to the lender in some of her assets. For the borrower—especially a distressed one who may need to file for bankruptcy in the future— secured debt is riskier than unsecured.
The danger of this myth is that borrowers may not realize the trade-off they are accepting. The borrower pays a lower interest rate but puts some of her property at risk of foreclosure.
D. Myth #4: “Cash-out refinancing is a source of spendable income”
Cash-out refinancing is the strategy of paying off one mortgage by taking out a larger mortgage and then pocketing the difference in cash. Described in these terms, it is clear that “cash-out refinancing” simply means increasing your debt. Cash raised from borrowing is not
income, even though the cash received from the transaction can be spent freely as if it were income.
A recent financial column in the Washington Post describing the cash-out refinancing craze may illustrate the extent of the public’s misunderstanding of the process—even among intelligent observers of financial affairs such as financial journalists.22 The article mentions several times that a homeowner who carries out a cash-out refinancing transaction receives cash “tax-free.” But raising cash by borrowing is never taxed—so why should a debt increase in the context of a cash-out refinancing incur a tax liability? Only income (from wages, dividends, interest, or capital gains) is taxed, while increasing debt is not a taxable event. The article also uses phrases such as “tap[] rapidly accumulating home real estate wealth,” “convert[] . . . real-estate equity into spendable cash,” “cash out . . . home equity,” “borrow[] money from your home piggy bank,” and “equity sitting frozen in your home.” These images might convince a gullible reader that some sort of financial alchemy is being conjured out of bricks and mortar. To be fair to the columnist, however, the risks to borrowers of increasing debt are mentioned—but only near the end of the article.
Figure 2 illustrates an example of a cash-out mortgage refinancing. As in the example illustrated in Figure 1, the expected inflation rate falls from 4% to 2%, bringing mortgage rates down from 8% to 6%. Real interest rates remain unchanged, but the duration of any mortgage increases. It is the failure to appreciate this fact that can lead borrowers into risky situations they do not understand.
The borrower chooses to increase her loan amount from $100,000 to $122,386, generating $22,386 of cash to be pocketed “tax-free.” This new larger mortgage was chosen to maintain the borrower’s payment exactly as it was before the refinancing. A borrower who believes that “all that matters is your monthly payment” will be tempted to think the $22,386 of cash she takes home from the mortgage closing is income of some sort (a capital gain, she may wonder?) or even “free money” conjured out of thin air.
The truth is that the borrower faces a significantly increased burden of repayment over the life of the mortgage—as is wont to happen when increasing one’s debt. The solid line in Figure 2 lies above the dashed line representing the burden of scheduled repayments of the original
22
Kenneth R. Harney, Cashing Out Equity May Be Tempting, But the Risk is High, WASH.POST, Dec. 4, 2004, at F1.
mortgage everywhere except at the very beginning. In this example, the borrower’s new projected repayment burden peaks in retirement at more than 100% of her available income. In other words, the cost of the $22,386 cash-out refinancing today is probable default later. Thus, the cash-out refinancing craze clearly represents a danger to consumers—albeit one that very few borrowers or lenders likely understand.
E. Myth #5: “Rising house prices make us all richer”
Everyone knows someone who made a killing from selling a house that appreciated several-fold in value, or someone who has not sold but said: “The value of my house has gone up X thousand dollars in just the last three years!” Individual households’ actual and unrealized capital gains (and occasional capital losses) are so vivid to most of us that it is difficult to accept that, for the economy as whole, “housing wealth” does not exist.
To see the myth of housing wealth most clearly, imagine a simple economy with exactly two homeowning households. Suppose the “market value” of each of their houses was $200,000 yesterday. Today, both households believe their houses have doubled in value. One household sells its house to the other, pocketing a $200,000 capital gain—an apparent increase in the economy’s housing wealth. But the first household needs somewhere to live, and the second household has an extra, empty dwelling. So household one buys from household two—but at the inflated price of $400,000, generating a $200,000 capital gain for household two. Neither
household has any more cash or other assets than they had before, and they each own one house as before. What has changed? We can say the housing wealth of the economy has doubled, but it has no economic significance—it is a myth.
To draw the obvious analogy to the real world, suppose every homeowner in the United States tried to sell his or her house to turn their imagined appreciated values into cash. To whom would we all sell, and at what price? After selling, where would we live? Even if we just bought each others’ houses at higher prices than we paid for them, our attempt to realize our supposed “housing wealth” would be frustrated by the fact that our gains on sale would be dissipated by the high prices we must pay to buy our neighbors’ houses.
Another analogy may help illustrate the point. Most consumers own cars, which are valuable, long-lasting assets. Like a house, the value of a car is based on the services it will provide—in this case, transportation. Do we feel richer when all automobile prices rise (for both
new and used vehicles)? Probably not; in fact, many of us would feel poorer because we know we’ll have to spend more to buy our next car. Strictly speaking, the effect of rising car prices on those consumers who own cars should be nil, as in the case of owner-occupying households. The increased market value of your car is cancelled out by the increasing cost of transportation services—either those you enjoy from your own car, or those you could obtain from an auto-rental company.
The point is that the value of a house is derived solely from the housing services it provides (equivalently, the rent foregone). A higher house price therefore represents a higher cost of future housing services. A homeowner is hedged against changes in the cost of housing services by the corresponding change in the value of the house that provides them.
To be sure, some people gain and others lose when house prices change. Who are the winners when house prices fluctuate? Older, wealthier households in regions with higher incomes potentially benefit from rising house prices if they downsize or move out of their high-priced cities or regions entirely. Losers include the younger, less wealthy households in lower-price cities or regions who might want to move into areas with higher housing lower-prices.
Why then do consumers appear to spend more when house prices are rising, as during recent years? Isn’t this evidence for a housing wealth effect? Rising house prices increase the (risky) value of collateral a borrower has available to pledge to a lender. A household that previously felt liquidity-constrained may be able to borrow and spend more when the value of its collateral increases. But being able to borrow more does not, by itself, make any of us richer.
F. Myth #6: “All Americans’ dream is to own their own homes”
A historically high homeownership rate often is trumpeted as an unambiguous sign of economic and social progress. National housing policy (and mortgage lenders and
homebuilders) seem to recognize no natural upper limit on the homeownership rate short of 100%.
Yet homeownership is not appropriate for everyone. Table 3 summarizes several relevant factors in a rational decision to buy or rent. These include the level and volatility of the
household’s income, a household’s wealth, a household’s need for specific kinds of housing units, the need or desire to move frequently, a household’s marginal income-tax rate, and the willingness of a household to bear the risk of unexpected future rent increases. Potential housing
bubbles in some parts of the U.S. today also reduce the attractiveness of homeownership for first-time buyers, as declining collateral values in the future could leave them over-indebted.
G. Myth #7: “All we need to do to solve the financial-illiteracy problem is dedicate more time/money/information/training, etc., etc.”
The last consumer-finance myth affects scholars, regulators, policymakers, and consumer advocates as much as consumers themselves. The problem of low financial literacy is likely to prove quite intractable, as the next section discusses.
IV. OBSTACLES TO WIDESPREAD FINANCIAL LITERACY
Widespread financial literacy might be defined as something like 75% of the adult
population being able to answer correctly 75% of the questions on a financial-literacy quiz. The obstacles to achieving widespread financial literacy are threefold—inadequate basic skills, conflicts of interest at financial-services providers, and the increasing complexity of consumer finance itself.
A. Basic Skills
The first obstacle to widespread financial literacy is the underdevelopment in much of the U.S. adult population of the basic technical and emotional skills needed in financial decision-making. In particular, math and economics training is poor in many elementary and secondary schools. This matters because most financial decisions require consumers to make choices between subtly different quantitative alternatives. At the same time, good financial management requires an armory of emotional skills—including self-discipline, resilience to occasional
financial reversals, and the ability to resist the siren calls of friends, family members, and the prevailing consumer culture of instant gratification.
Technical skills can be improved, at least in theory. Decades have passed since we realized that we were a “nation at risk” from a deficient educational system, however; and it still is not clear that we have turned around the slow drift toward mediocrity in public education. This is particularly true in technical subjects, in which U.S. secondary-school students consistently perform worse than students in other high-income countries.23 Improving emotional skills
23
For example, average scores for U.S. fifteen year olds placed them in a tie for 27th place out of thirty-nine countries in a recent Program for International Student Assessments (PISA) comparison of mathematics literacy. U.S.DEPARTMENT OF EDUCATION,NATIONAL CENTER FOR EDUCATION STATISTICS,INTERNATIONAL OUTCOMES OF
necessary for making good financial decisions probably is less amenable to formal education. The strong dislike of deferred gratification (what economists call a “high personal discount rate”) so evident among so many people in the U.S., for example, may be deeply ingrained in our basic attitudes or culture. It is unlikely those things can be changed quickly, if at all.
B. Conflicts of Interest
The second obstacle to widespread financial literacy is the U.S. financial-services sector itself. Most U.S. consumer-finance providers are permeated by an inherent conflict of interest with their clients.24 All financial-services providers claim they have their clients’ best financial interests at heart, but this clearly cannot be true for stockholder-owned banks, insurance
companies, mutual-fund providers, investment brokers and advisors. These firms exist, after all, to make a profit.25 These firms’ revenues are increased by charging higher fees and loan rates, paying lower deposit rates and investment returns, and by encouraging greater use of their services, whether warranted or not.
Why do we allow profit-making financial-services firms to operate? The two key assumptions justifying a for-profit retail financial-services sector in the U.S. are that:
1. A competitive, profit-maximizing industry promotes efficiency; and
2. The doctrine of caveat emptor (“let the buyer beware”) produces market discipline and provides a level playing field for competition to flourish.
Recent events and the evidence summarized in this paper cast doubt on the validity of both assumptions. The scandals uncovered by the bursting of the stock-market bubble and, more recently, by New York Attorney General Eliot Spitzer, brought to light some of the seamier and
LEARNING IN MATHEMATICS LITERACY AND PROBLEM SOLVING: PISA2003RESULTS FROM THE U.S.PERSPECTIVE
14 (2004), available at http://nces.ed.gov/pubs2005/2005003.pdf (last visited Mar. 28, 2005). 24
See generally INGO WALTER,CONFLICTS OF INTEREST AND MARKET DISCIPLINE AMONG FINANCIAL SERVICES
FIRMS (N.Y.U., Stern Sch. of Bus., Econ. Dept., Working Paper No. EC-03-24, 2003), available at
http://w4.stern.nyu.edu/economics/research.cfm?doc_id=1025 (last visited Mar. 28, 2005). Examples of a conflict of interest between a financial-services provider and the client are financial planners and brokers who profit from sales commissions. The financial planner or broker earns the most when the client buys the highest-commission investments and if the client frequently moves money into new investments.
25
Financial-services providers that are mutually owned, such as credit unions, mutual savings banks and insurance companies, and other co-operative ventures, are different. They exist to maximize the benefits to the users of the services, rather than the enterprise’s profitability. Government-provided financial services, such as Social Security, Medicare, Medicaid, and unemployment insurance, also are exempt from this critique. In other countries,
institutions such as postal savings banks are sometimes very important providers of retail financial services. Not-for-profit financial-services providers are subject to other problems, but an inherent conflict of interest with their clients is not one of them.
less-competitive aspects of the business of financial services in the U.S.26 A common theme in the still-unfolding financial-services scandals of recent years has been the abuse of inside or privileged access or information to rip off a client. We really should not be surprised by the scandals, because a business that is both profit-maximizing and based on gathering and using valuable private information is a recipe for fundamental conflicts of interest with clients. It is unrealistic to expect competition alone to eliminate all opportunities for a financial firm to choose its own financial interests over those of a client.
Government regulation inevitably expands to counter the inherent shortcomings of
competition in financial services; the Sarbanes-Oxley Act of 2002 is only the latest example of a trend toward greater financial regulation that has been ongoing for more than a century in the U.S.27 The irony of this dialectic between competition and regulation is that the increasing costs of regulation reduce the net efficiency gains of a free market in financial services. At some point, the net-of-regulation gains in efficiency from allowing profit-maximizing competition may be no greater than the level that could have been achieved by a financial-services sector
populated primarily by not-for-profit firms such as credit unions, mutually owned insurance companies, and some government-provided services (such as Social Security, Medicare, Medicaid, and unemployment insurance).
The second flawed assumption underlying our for-profit financial-services sector is that consumers can and do protect themselves against the conflicted, misleading, or fraudulent behavior, communication, and advice of financial-services firms. The first six consumer-finance
26
Several financial-services conflicts of interest exposed by Attorney General Spitzer resulted in negotiated settlements by accused financial-services firms reaching into the hundreds of millions of dollars. Spitzer’s investigations included:
Biased equity research to support investment-banking business (for example, see the $100 million agreement reached with Merrill Lynch); Press Release, Office of New York State Attorney General Eliot Spitzer, Spitzer, Merrill Lynch Reach Unprecedented Agreement to Reform Investment Practices, available at http://www.oag.state.ny.us/press/2002/may/may21a_02.html (May 21, 2002).
Undisclosed kick-backs when insurance brokers arranged large insurance purchases for clients (see the agreement by Marsh and MacLennan to make $850 million in restitution payments); Press Release, Office of the New York State Attorney General, Insurance Broker Agrees to Sweeping Reforms, available at
http://www.oag.state.ny.us/press/2005/jan/marshsettlement_pr.pdf (Jan. 31, 2005).
Undisclosed “late trading” and other preferential fund access to favored mutual-fund clients (see Bank of America’s agreement to pay $375 million); Press Release, U.S. Securities and Exchange Commission, SEC Reaches Agreement in Principle to Settle Charges Against Bank of America For Market Timing and Late Trading, available at http://www.sec.gov/news/press/2004-33.htm (Mar. 15, 2004).
27
Sarbanes-Oxley Act of 2002, Pub. L. No. 107-204, 116 Stat. 745 (codified as amended in scattered sections of 15 and 18 U.S.C.). For a detailed summary of the Sarbanes-Oxley Act of 2002 see American Institute of Certified Public Accountants, Summary of Sarbanes-Oxley Act of 2002, at
myths in the previous section describe some of the difficulties even conscientious and intelligent consumers encounter when making financial decisions. Many consumers probably do not know where to turn for help and may naively assume that a financial-services provider is an impartial source of advice (“Like a good neighbor . . . ,” “You’re in good hands with . . . ,” etc.).
A perfect example of consumer naiveté, and hence vulnerability, is financial-services firms’ efforts to improve consumers’ financial literacy. A 2002 survey by the Consumer Bankers Association found that 96% of retail banks contributed to financial-literacy efforts in some way.28 Banks may believe this “helping hand” can improve their image with consumers, bringing in more business. Moreover, federal bank regulators look favorably on financial-literacy efforts when evaluating banks for compliance with the Community Reinvestment Act.29
But would consumers not be better off if financial-services providers reduced fees and loan rates rather than spending on financial-literacy efforts that, by all accounts, have minimal
impact? The point is, of course, that profit-maximizing financial-services providers really do not want to “give back” any of their profit margin. Nor do they necessarily desire more financially savvy customers who might shop around more actively or bargain down the terms on the products and services they sell.
C. Increasing Complexity of Consumer Finance
The third obstacle to widespread financial literacy is the undeniable fact that the literacy bar keeps rising—that is, the typical household’s responsibilities for managing its financial affairs are increasing. Moreover, the tasks are becoming more and more complex.
Two potentially far-reaching examples of increasing demands on consumers to make complex financial decisions are “personal retirement accounts” and “health savings accounts.” These accounts constitute two key parts of President Bush’s agenda to increase households’ “ownership” and “responsibility” for their own financial well-being.30 Private accounts in Social Security would shift more responsibility for difficult decisions on to consumers. In addition, a
28
CONSUMER BANKERS ASSOCIATION,FINANCIAL LITERACY PROGRAMS:ASURVEY OF THE BANKING INDUSTRY
(2001), available at http://www.cbanet.org/Issues/Financial_Literacy/documents/2002%20Survey%20Overview.pdf (last visited Mar. 28, 2005).
29
Community Reinvestment Act of 1977, 12 U.S.C. §§ 2901-2908 (1977). For a brief overview of the Community Reinvestment Act of 1977, see The Federal Reserve Board, Community Reinvestment Act, at
http://www.federalreserve.gov/dcca/cra/ (last visited Mar. 28, 2005). 30
ECONOMIC REPORT OF THE PRESIDENT 127-30 (2005), available at
shift toward private accounts may reduce the progressivity of Social Security—that is, it could reduce the extent of income redistribution that currently exists in the benefit formulas.
Other examples of increasing financial responsibility include a private-sector shift toward managed health care (health-maintenance organizations, or HMOs) and defined-contribution pension plans (401(k) type plans).31 The increasing cost and complexity of the healthcare system has encouraged employers that provide healthcare benefits to seek cost savings in the form of managed care. The fact that people are living longer than ever before increases the need for retirement saving and planning outside of Social Security.
V. SUMMARY
Consumer finance is becoming more complex every day. The average level of U.S. households’ financial literacy is low. Financial decisions are, by their very nature, complex. Many important consumer-finance myths exist—indeed, some of them are perpetuated actively by financial-services providers and the (largely unwitting) media.
More time, money, information and training initiatives may reduce the number of poor consumer-finance decisions that are made. However, the problem of financial illiteracy is not likely to disappear. Several obstacles to achieving widespread financial literacy exist. In some cases, they are growing larger. Not least among the obstacles is the inherent conflict of interest that exists between profit-maximizing financial-services providers and their financially naïve customers. Consumer-protection regulation is necessary, but it cannot banish all of the
consumer-finance myths to which even conscientious and educated households sometimes fall victim.
31
IBM is one large employer that maintains a website for employees to learn about and discuss changing pension, retirement, and other benefits issues. See IMB Employee News and Links, at
Table 1. Indicators of Basic Financial Literacy
Consumer-Finance Categories
Specific financial behaviors
Percentage of consumers who engage in this financial behavior (as of Dec. 2001) Cash-flow management
Pay all bills on time 88
Have a recordkeeping system 65
Balance checkbook monthly 67
Track expenses 59
Use a spending plan or budget 46
Savings
Have an emergency fund 63
Save or invest money out of each paycheck 49 Save for long-term goals such as education, car, home, or vacation 39
Plan and set goals for financial future 36
Investment
Have money in more than one type of investment 53
Calculated net worth in past two years 40
Participate in employer’s 401(k) retirement plan 37 Put money into other retirement plan, such as an IRA 22
Credit
Review credit report 58
Pay credit card balances in full each month 49 Compare offers before applying for a credit card 35
Other
Do own taxes 40
Read about personal money management 20
Memo: Average number of financial behaviors demonstrated by a household (out of 18 behaviors investigated)
9
Sources: Sandra Braunstein & Carolyn Welch, Financial Literacy: An Overview of Practice, Research, and Policy, 88 FED.RES.BULL. 445 (2002); Marianne A. Hilgert et al., Household Financial Management: The Connection between Knowledge and Behavior, 89 FED.RES.BULL.309(2003).
Table 2. Use of Basic Consumer-Finance Products
Consumer-Finance Product Types
Specific financial product
Percentage of consumers who use this financial product
(as of Dec. 2001) Deposit products Checking account 89 Savings account 80 Certificate of deposit 30 Investment products
Any investment account 52
Mutual fund 46
Public stock 24
Bonds 6
Retirement products
Company pension plan or 401(k) plan 45
IRA or Keogh 43
Credit products
Credit card 79
Mortgage 72 Refinanced mortgage or loan for home improvements 35
Memo: Average number of financial products owned by a household (out of 12)
7
Sources: Sandra Braunstein & Carolyn Welch, Financial Literacy: An Overview of Practice, Research, and Policy, 88 FED.RES.BULL. 445 (2002); Marianne A. Hilgert et al., Household Financial Management:
Table 3. Who Should Buy a House and Who Should Rent?
Criterion
Household characteristics
Optimal housing-tenure choice is more likely to be: Income
Steady over time Own
Variable from year to year Rent
Wealth
High Own Low Rent
Specificity of housing needs
High Own Low Rent
Expected duration of stay in housing unit
More than 5 years Own
Fewer than 5 years Rent
Marginal tax rate
25 percent or above Own
Below 25 percent Rent
Willingness to bear the risk of unexpected future rent increases
Low Own High Rent Note: These recommendations are for purposes of illustration only and are not based on a quantitative
Figure 1. Annual Repayment Burden After Refinancing $100,000 Mortgage from 8 Percent to 6 Percent 0 25 50 75 100 0 1 2 3 4 5 6 7 8 9 10 11 12 13 14 15 16 17 18 19 20 21 22 23 24 25 26 27 28 29 30
Years into the mortgage
Pe rcent of av ailable inc o me Original $100,000 mortgage
Refinance $100,000 mortgage at lower rate
Assumptions:
Expected inflation rate falls from 4 percent to 2 percent.
Original mortgage is for $100,000 at 8 percent for 30 years, with annual level repayments.
Mortgage after refinancing is for $100,000 at 6 percent for 30 years, with annual level repayments.
Available income begins at $10,000 in year 1, increasing by 4 percent annually through year 25 in the original scenario.
Available income begins at $10,000 in year 1, increasing by 2 percent annually through year 25 in the second scenario (after refinancing).
Available income falls by half at retirement beginning in year 26, then increases at the same rate as before retirement.
Figure 2. Annual Repayment Burden After Refinancing $100,000 Mortgage from 8 Percent to 6 Percent, Increasing the Principal Balance to $122, 386
0 25 50 75 100 125 0 1 2 3 4 5 6 7 8 9 10 11 12 13 14 15 16 17 18 19 20 21 22 23 24 25 26 27 28 29 30
Years into the mortgage
Pe rcent of av ailable inc o me Original $100,000 mortgage
After cash-out refinancing to a $122,386 mortgage with the same monthly payment as before
Assumptions:
Expected inflation rate falls from 4 percent to 2 percent.
Original mortgage is for $100,000 at 8 percent for 30 years, with annual level repayments.
Mortgage after refinancing is for $122,386 at 6 percent for 30 years, with annual level repayments.
Available income begins at $10,000 in year 1, increasing by 4 percent annually through year 25 in the original scenario.
Available income begins at $10,000 in year 1, increasing by 2 percent annually through year 25 in the second scenario (after refinancing).
Available income falls by half at retirement beginning in year 26, then increases at the same rate as before retirement.