Modeling of a Solid Oxide Electrolysis Cell for Carbon
Dioxide Electrolysis
Meng Ni
Department of Building and Real Estate, The Hong Kong Polytechnic University Hung Hom, Kowloon, Hong Kong, China
Abstract
In this study, 2 models are developed to investigate the performance of a solid oxide electrolysis cell (SOEC) for CO2 electrolysis at different levels. The first model is a one-dimensional model which is basing on a previously developed electrochemical model for steam electrolysis and considered all overpotentials in the SOEC. The second model is a two-dimensional thermal-fluid model consisting of the 1D model and a computational fluid dynamics (CFD) model. It is found that the mean electrolyte temperature initially decreases with increasing operating potential, reaches the minimum at about 1.1V and increases considerably with a further increase in potential. At the thermal-neutral voltage (1.463V at 1173K), the calculated mean electrolyte temperature matches the inlet gas temperature. Increasing the operating potential increases both the local current density and the electrolyte Nernst potential. The electrochemical performance can be improved by increasing the inlet gas velocity from 0.2ms-1 to 1.0ms-1 but further increasing the inlet gas velocity will not considerably enhance the SOEC performance. It is also found that a change of electrode permeability in the order of 10-16 – 10-13 m2 does not noticeably influence the SOEC performance in the present study, due to negligible convection effect in the porous electrodes.
Keywords:
Solid Oxide Electrolyte; Transport Phenomena; Porous Media; Solid Oxide Fuel Cell (SOFC); Computational Fluid Dynamics (CFD); Finite Volume Method (FVM)
1. Introduction
Because of its good ionic conductivity at high temperatures (873 –1273K), yttria-stabilized zirconia (YSZ) has been widely used as an electrolyte material in solid oxide fuel cells (SOFCs) for electricity generation and solid oxide electrolysis cells (SOECs) for H2 generation through steam electrolysis [1-8]. In addition to steam electrolysis, SOECs can also be used for CO2 electrolysis to generate O2 [9]. In recent years, NASA has initiated a few projects to study the CO2 electrolysis for O2 generation by an SOEC with platinum or nickel cermet electrodes [9-11]. In addition, a few other groups also started their research on CO2 electrolysis [12].
Since most of the research works on CO2 electrolysis are experimental in nature, the present literature is lacking detailed mathematical modeling of CO2 electrolysis. Although there are some valuable modeling studies on steam electrolysis for H2 production using SOECs [5-8], a pertinent modeling or reliable analysis on CO2 electrolysis is needed to understand the physical-chemical processes in an SOEC used for CO2 electrolysis. Chan et al. [13] developed an electrolyte model for CO2 electrolysis, however, the important gas transport phenomenon in porous electrodes was not considered. In this study, two models are developed for CO2 electrolysis by an SOEC at different levels. The 1D model is basing on a previously developed electrochemical model for steam electrolysis and considers all irreversible losses, including ohmic, activation and concentration overpotentials. The second model is a 2D thermal-fluid model where the heat and mass transfer as well as electrochemical reactions in the SOEC are all modeled. The models presented in this paper are different from the previously published models, as the Nernst potential and all the source terms in 2D model for carbon dioxide electrolysis are different from SOFCs or steam electrolysis. For example, fuel cell reaction is exothermic while carbon dioxide electrolysis is endothermic in nature. According to the author’s knowledge, this is the first comprehensive modeling study on carbon dioxide electrolysis for oxygen production. Parametric simulations are performed to understand the
coupled transport and electrochemical reactions in an SOEC used for CO2 electrolysis. The effects of inlet gas velocity, electrode permeability and inlet gas composition on SOEC performance are investigated. The thermal neutral voltage of SOEC for carbon dioxide electrolysis is discussed.
2. Model development
2.1. Operating mechanisms
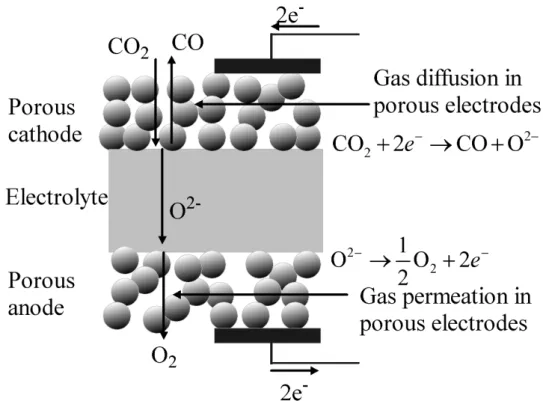
The fundamental working mechanisms and a 2D view of an SOEC for CO2 electrolysis are illustrated in Figs. 1 and 2, respectively. Similar to an SOFC, the SOEC used for CO2 electrolysis consists of a porous cathode, a porous anode and a dense electrolyte. During operation, a sufficient electric potential is applied to the SOEC. CO2 molecules are fed to the porous cathode and transported through the porous layer to the cathode-electrolyte interface, where they are reduced to CO and oxygen ions (O2-). The generated CO molecules are transported out of the porous cathode and get collected, while the O2- are transported through the dense electrolyte to the anode side. At the anode-electrolyte interface, oxygen ions are oxidized to form O2 and electrons (e-). The generated O2 molecules are subsequently transported out of the porous anode while the electrons are transported to the cathode through the external circuit to complete the cycle. The net reaction of CO2 electrolysis by an SOEC can be expressed as:
2 2
CO →CO 0.5O+ (1)
2.2. One-dimensional electrochemical model of an SOEC used for CO2 electrolysis The required potential (V) applied to the SOEC can be written as:
, , , ,
conc c conc a act c act a ohmic
( )
2 2 0.5 0 0 0 ln 0 2 CO O CO P P RT E E F P = + (3)where E is the equilibrium voltage; E0 is the equilibrium potential at standard pressure (about 0.924V at 1200K); F is the Faraday constant (96485 Cmol-1); R is the ideal gas constant (8.3145 J mol-1 K-1); T is the operating temperature (K); P0is the partial pressure at the electrode surface; and the subscripts CO2, CO, and O2 represent the carbon dioxide reactant, carbon monoxide and oxygen products, respectively; ηconc c, and ηconc a, are the concentration overpotentials at the cathode and
anode, respectively; ηohmic is the ohmic overpotential; and ηact c, and ηact a, are the activation overpotentials at the cathode and anode, respectively.
At a temperature between 800K and 1200K, the equilibrium potential E0 can be approximately calculated by a linear formula as,
(
)
0 1.1043 0.00045 800
E = − T− (4)
The ohmic and activation overpotentials can be determined with the Ohm’s law and Butler-Volmer equation, respectively. It should be mentioned that the Butler Butler-Volmer equation may not be the best formula for describing the activation overpotential of SOEC electrodes, as for many good SOEC/SOFC composite electrodes, their current density-voltage relationships are usually rather linear. Nevertheless, Butler-Volmer equation is used in the current study and can be easily modified in the future if more experimental data are available to support a better formula for activation overpotential. Since the materials used for CO2 electrolysis can be the same with those for H2O electrolysis, the electrolyte (YSZ) conductivity and electrode exchange current density for steam electrolysis [14] are used for CO2 electrolysis in the present study. However, the parameters should be updated if reliable data for CO2 electrolysis are available.
In a previous study on SOEC used for steam electrolysis, the concentration overpotentials at the electrodes have been derived and analytical solutions have been obtained [15]. By substituting H2O and H2 with CO2 and CO, respectively, the analytical solution of the cathode concentration overpotential (ηconc c, ) of an SOEC used for CO2 electrolysis can be obtained [15],
− + = − + = 0 0 0 0 0 0 , 2 2 2 2 2 2 2 2 1 2 1 ln 2 2 2 ln 2 CO eff CO c CO eff CO c eff CO c CO CO eff CO c CO CO c conc P FD RTJd P FD RTJd F RT FD RTJd P P FD RTJd P P F RT η (5)
where J is the current density (A/m2), dcis the thickness of the cathode (m), and 2
eff CO
D is the effective diffusion coefficient (m2/s) of CO2, which can be obtained using the Bosanquet formula
2 2 2, 1 1 1 eff CO CO CO CO k D D D ξ ε − = + (6)
where ξ ε/ is the ratio of electrode tortuosity to porosity;
2 CO CO
D − is the molecular diffusion
coefficient for CO2-CO binary system; and
2, CO k
D is the Knudsen diffusion coefficient of CO2. The molecular diffusion coefficient (
2 CO CO
D − ) and the Knudsen diffusion coefficient
( 2, CO k D ) can be calculated as [16, 17], 2 2 2 1.5 0.5 2 0.0026 CO CO CO CO CO CO D T D PM σ − − − = Ω (7) 2 2 , 2 8 3 CO k CO r RT D M π = (8) 2 2 , 2 1 1 CO CO CO CO M M M = + (9)
where
2 CO
M and MCO are the molecular weight of CO2 and CO; r is the mean pore radius;
2 CO CO
σ −
is the mean characteristic length of species CO2 and CO; and ΩD is a dimensionless diffusion collision integral.
2 CO CO
σ − and ΩD can be calculated as [16],
2 2 2 CO CO CO CO σ σ σ − = + (10)
(
τ)
(
τ)
τ τ 3.89411 76474 . 1 52996 . 1 exp 03587 . 1 47635 . 0 exp 193 . 0 06036 . 1 1561 . 0 + + + = ΩD (11)where the values of
2 CO
σ and σCO can be found from Table 2 (ref. [16]). τ is the dimensionless
temperature of CO2 and CO binary system and can be calculated as,
, b i j k T τ ε = (12) where 23
(
)
1.38066 10 / bk = × − J K is the Boltzmann’s constant.
At the anode, oxygen is the only gas transporting in the porous electrode. Darcy’s law can be used to describe the mass transport of O2 in the anode. The analytical solution of anode concentration overpotential (ηconc a, ) has been obtained in a previous study as [15],
( )
+ = 0 2 0 , 2 2 2 ln 4 O O g a a conc P P FB d JRT F RT µ η (13)where Bg is the permeability (m2) of the porous anode and can be determined with the Kozeny-Carman relationship [18]; µ is the dynamic viscosity (kg/
(
m s⋅)
) of O2, which can be obtained from reference [17]; and da is the thickness of the porous anode.The 1D electrochemical model is useful for quick estimation of the current density-voltage of SOEC. However, in practice, the temperature, gas composition and current density are all varied along the gas channel. In order to obtained detailed information inside the SOEC, a 2D thermal-fluid model is needed.
2.3.1. Governing equations
The 2D thermal-fluid model is developed to study the coupled heat/mass transport and electrochemical reaction in a planar SOEC used for CO2 electrolysis. The transport phenomena in an SOEC can be described in the general form as [19],
(
)
(
)
(
)
S t ρφ ρ φ φ ∂ + ∇ = ∇ Γ∇ + ∂ V (14)Where φ is a general variable to be solved, t is time, ρ is density, V is the velocity vector, Γ is the general diffusion coefficient, and S is the general source term. By setting φ =1, the above general transport equation is reduced to the continuity equation. Replacing φ with U and V, Eq. (14) becomes momentum equations in x and y directions, respectively. By setting φ =Yj, the mass fraction of species j, the general transport equation (Eq. 14) becomes the species equations. Substituting φ with temperature T, the general transport equation can be transformed to the energy equation. As a summary, the governing equations for conservation of mass, momentum, energy and species are written below,
(
)
(
)
m U V S x y ρ ρ ∂ ∂ + = ∂ ∂ (15)(
)
(
)
x UU VU P U U S x y x x x y y ρ ρ µ µ ∂ ∂ ∂ ∂ ∂ ∂ ∂ + = − + + + ∂ ∂ ∂ ∂ ∂ ∂ ∂ (16)(
)
(
)
y UV VV P V V S x y y x x y y ρ ρ µ µ ∂ ∂ ∂ ∂ ∂ ∂ ∂ + = − + + + ∂ ∂ ∂ ∂ ∂ ∂ ∂ (17)(
P)
(
P)
T c UT c VT T T k k S x y x x y y ρ ρ ∂ ∂ ∂ ∂ ∂ ∂ + = + + ∂ ∂ ∂ ∂ ∂ ∂ (18)(
)
(
)
, , i i i i i m i m sp UY VY Y Y D D S x y x x y y ρ ρ ρ ρ ∂ ∂ ∂ ∂ ∂ ∂ + = + + ∂ ∂ ∂ ∂ ∂ ∂ (19)The density of the mixture ρ is calculated as
1 1 / N i i i Y ρ ρ = =
∑
(20)where Yi and ρi are the mass fraction and density of species i.
The mass fraction and molar fraction of species i are related by
i i i M Y X M = (21) and 1 N i i i M X M = =
∑
(22)The effective heat capacity (cp) and thermal conductivity (k) can be calculated as,
(
)
, 1 , p p f p s c =εc + −ε c (23)(
1)
f s k=εk + −ε k (24)where kf and ks are the heat conductivity (W/
(
m K⋅)
) of the fluid and solid, respectively; cp,f and cp,s are the heat capacity (J/(
kg K⋅)
) of the fluid and solid, respectively.The source terms in continuity equation (Eq. 15) and species equation (Eq. 19) represent the change in mass and specie’s mass fraction due to the electrochemical reactions at the active surface
(electrode-electrolyte interface). At the cathode-electrolyte interface, the source term for continuity equation can be calculated as,
2 2 2 CO CO active m c JM JM A S F F V = − (25)
where Aactive is the area of active surface and Vc is the control volume. The ratio of Vc to
active
A is the width (in y direction, ∆y) of the control volume at the electrode-electrolyte interface. At the anode-electrolyte interface, the source term for continuity equation is calculated as,
2 4 O active m c JM A S F V = (26)
The source terms in momentum equations (Eqs. 16 and 17) enable the momentum equations to be valid for both the gas channels and the porous electrodes and can be determined with the Darcy’s law (Eqs. 27 and 28).
x g U S B µ = (27) y g V S B µ = (28)
The source term in the energy equation (Eq. 18) results from the (1) heating effect by overpotential losses, including the ohmic, activation and concentration overpotentials and (2) entropy change of the electrochemical reaction. The source term can be calculated as,
2 active T t c A JT S S J F η V ∆ = − + (29)
where ηt (V) is the total overpotential losses, which can be calculated as,
, , , ,
t conc c conc a act c act a ohmic V E
The entropy change (∆S,J/
(
K mol⋅)
) for the carbon dioxide electrolysis can be calculated as, 2 2 0.5 O CO CO S S S S ∆ = + − (31) where 2 O S , SCO and 2 COS are entropy of O2, CO, and CO2, respectively, which can be found in Table 3 [20].
2.3.2. Numerical methodology
The governing equations presented above are discretized into algebraic equations by using the Finite Volume Method (FVM) on a staggered grid arrangement [21]. The details of the numerical method and the boundary conditions can be found in the literature [22]. The source terms in the governing equations are related to the local current density, which is computed based on the updated gas composition and temperature for a given terminal cell potential. Computation is repeated till convergence is obtained. The in-house CFD code was written and developed in FORTRAN.
3. Results and discussion
3.1. Model evaluation
In literature, only Mogensen’s group [12] reported the detailed J–V characteristics and operating/structural parameters of CO2 electrolysis by an SOEC for O2 generation. Therefore, their data are used for model evaluation. In their experiments, the J-V data of a cathode-supported SOEC were measured. The cathode, electrolyte, and anode were made of Ni/YSZ, YSZ, and LSM-YSZ (YSZ is Yttria Stabilized Zirconia) with thicknesses of about 312.5 mµ , 12.5 mµ , and 17.5 mµ , respectively. Measurements were performed at an ambient pressure, a temperature of 1123 K, and
various molar ratios of CO2/CO (70/30 and 50/50). As shown in Fig. 3, the simulation results agree reasonably well with the experimental data from literature [12], thus validate the 1D electrochemical model developed in this paper. The validation of the 2D thermo-fluid model has been reported elsewhere [22] and is not repeated here.
3.2. Parametric simulations using the 1D electrochemical model
The typical parameters used for SOFC are used for SOEC simulation and are summarized in Table 1 [14, 16, 23].
3.2.1. Overpotentials of an SOEC
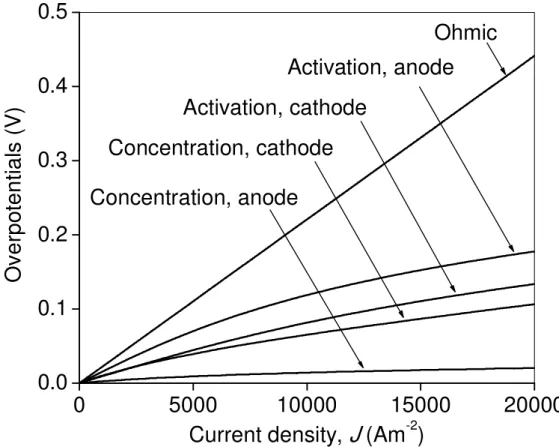
To understand the electrochemical characteristics of an SOEC, individual overpotentials of an anode-supported SOEC for CO2 electrolysis are studied and shown in Fig. 4. Despite its thin thickness, the ohmic overpotential dominates the total overpotential. Activation overpotentials are also important electrical energy losses in CO2 electrolysis. This is because the thermodynamic stability of CO2 makes the electrolysis of CO2 sluggish and CO2 electrolysis involves complicated processes, such as gas adsorption/desorption and charge transfer. Although the concentration overpotentials are lower than the ohmic and activation overpotentials, their effect on SOEC performance should be carefully studied, as they can be high and can limit the SOEC performance under certain conditions. Among all overpotential losses, the concentration overpotential at the oxygen electrode (anode in SOEC mode) is the smallest. It’s smaller than 0.02V even at very high current density (20000 A/m2), due to very small resistance of the porous electrode to the permeation process of oxygen.
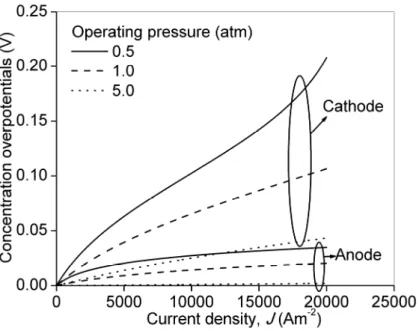
The effect of operating pressure on SOEC potential is shown in Fig. 5. As can be seen from Eqs. (6)-(8), the binary diffusion coefficient (
2 CO CO
D − ) is inversely proportional to the operating pressure (P), but the Knudsen diffusion coefficient (
2,
CO k
D ) is independent of P, thus, the effective diffusion coefficient (
2 eff CO
D ) is less sensitive to P. On the other hand, the gas density significantly increases with increasing pressure. The combined effects result in an increase in molar diffusion rate and a decrease in concentration overpotential with increasing pressure (Fig. 5).
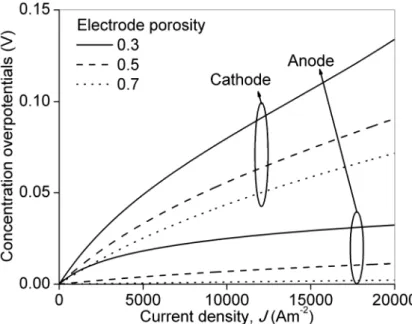
The effect of electrode porosity on the concentration overpotentials of an SOEC is presented in Fig. 6. It is found that the concentration overpotentials at the cathode and anode decrease with increasing electrode porosity. The effective diffusion coefficient is proportional to the electrode porosity, as a high porosity implies that more space in the porous electrodes is available for gas diffusion. Therefore, a high electrode porosity is desired to improve the electric performance of an SOEC for CO2 electrolysis. However, it should be mentioned that the activation overpotentials are assumed to be independent of the electrode microstructures, which is valid for conventional SOEC electrodes and might be invalid for advanced composite electrodes [24, 25]. In order to account for the electrode structural effect on activation overpotentials, micro-scale modeling is needed.
3.3. Results of 2D thermal-fluid model
The typical parameters for planar SOFCs are used for 2D thermal-fluid modeling of SOECs for CO2 electrolysis and are summarized in Table 2 [22]. Simulations are conducted to understand the coupled transport and electrochemical reactions in the SOEC.
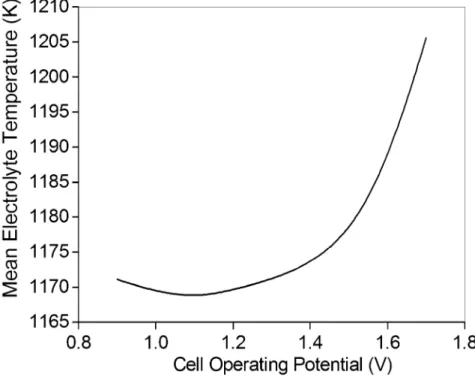
In CO2 electrolysis, the CO2 reduction reaction is endothermic, while the overpotential losses during operation generate ohmic heating. As the endothermic heat sink increases linearly while the ohmic heating increases rapidly with increasing current density, the net heat generation is negative at low current densities, increases to zero at a current density corresponding to the thermal neutral voltage (TNV), and positive at higher current densities.
Figure 7 shows the calculated mean electrolyte temperature as a function of operating potential. At a temperature of 1173K, the TNV for CO2 electrolysis is calculated to be about 1.463V, with the method developed by Hawkes et al. [26]. Theoretically, the endothermic heat sink and the ohmic heat generation should be balanced at the TNV and the mean electrolyte temperature should be the same as the inlet gas temperature. In the present study, it is found that the mean electrolyte temperature is 1173.1K at TNV (1.463V), which is very close to the temperature at the gas inlet (1173.0K).
3.3.2. Operating potential effect
The effects of operating potential on current density and Nernst potential are shown in Fig. 8. As expected, the current density increases with increasing operating potential and decreases along the main flow stream, as shown in Fig. 8(a). The decrease in current density is due to the increase in electrolyte Nernst potential along the gas flow channels (Fig. 8(b)). Along the gas flow channel, the molar ratio of CO/CO2 increases (Fig. 9), raising the Nernst potential (Fig. 8(b)) and thus decreasing the current density (Fig. 8(a)). The change in current density and Nernst potential is significant near the inlet because of the boundary conditions, since the gas velocity at the inlet of the porous electrode (x=0) is zero. It is also found that the gradient of gas composition in the porous electrode is higher than in the gas channel, indicating the resistance of porous structure to
is more significant (Fig. 9(a) and (b)), due to a higher current density (electrochemical reaction rate).
Figure 10 (a) and (b) show the temperature contours of the SOEC at operating potentials of 1.0V and 1.6V, respectively. As discussed above, the SOEC temperature decreases along the gas flow channel at an operating potential of 1.0, as it is smaller than the TNV (1.463V). At an operating potential of 1.6V, the SOEC temperature increases along the gas channel, as the ohmic heat generation is higher than the heat requirement for the electrochemical reaction. At the same longitudinal location (x), considerable temperature gradients in the y direction are found for the gas streams. For comparison, the temperature gradient in y direction is small in the solid part, due to high thermal conductivity of the solid structures.
3.3.3. Effects of operating parameters – inlet gas velocity and gas composition
Figure 11 (a) and (b) show the effect of inlet gas velocity on distributions of current densities and Nernst potentials. At the inlet, both the local current density and Nernst potential do not vary with inlet gas velocity, as the gas composition and temperature are the same at the inlet. At the downstream, the local current density increases and Nernst potential decrease with increasing inlet gas velocity. This is because at a higher inlet gas velocity, the gas composition along the main flow stream is more uniform than at a lower inlet gas velocity (Fig. 12 (a)-(c)), which in turn decreases the electrolyte Nernst potential and increases the local current density. For example, the average current density is increased from 7505 Am-2 at an inlet gas velocity of 0.2ms-1 to 8300Am-2 at an inlet gas velocity of 1.0ms-1. Since the differences in current density and Nernst potential between 0.5ms-1 and 1.0ms-1 are small, it is expected that further increase in inlet gas velocity will not significantly improve the SOEC performance.
The effect of inlet gas composition on SOEC performance is shown in Fig. 13 (a) and (b). With a decrease in inlet CO2 molar fraction, the local current density decreases and electrolyte
Nernst potential increases. This phenomenon can be explained easily by the formula of the Nernst potential (Eq. (3)). In order to save electric power for CO2 electrolysis, high CO2 molar fraction is needed.
3.3.4. Effect of electrode permeability
In literature, the values of SOFC electrode permeability vary from 10-16 m2 to 10-13 m2 [27], it is therefore meaningful to examine whether the use of different values of electrode permeability can greatly affect the SOEC performance. Figure 14 shows the local current density distributions in SOECs with different values of electrode permeability. It is found that increasing the electrode permeability from 10-16 m2 to 10-13 m2 almost does not influence the current density distribution. In the porous electrodes of an SOEC, the transport of gas species is mainly by means of diffusion and permeation is generally negligible. Since the diffusion process is independent of the electrode permeability, changing the electrode permeability in the studied range (10-16 m2 to 10-13 m2) does not significantly influence the SOEC performance.
4. Conclusions
Two models of increasing complexity are developed to study SOECs for CO2 electrolysis at different levels. The first model is a 1D model extended from a previously developed electrochemical model for steam electrolysis, which considers all important electrochemical losses including ohmic, activation and concentration overpotentials. The second model is a 2D model integrating the 1D model and a 2D thermal-fluid model. Detailed heat and mass transfer in both the gas channels and the porous electrodes are fully considered in the 2D model.
sluggish CO2 electrolysis rate. Compared with the anode, the cathode concentration overpotential is more significant as the large molecular weights of CO2 and CO result in small effective diffusion coefficients of CO2 and CO. The cathode concentration overpotential can be considerably reduced by increasing the operating pressure or increasing the electrode porosity. However, it should be mentioned that the current study does not consider the electrode structural effect on activation overpotential thus micro-scale modeling is needed in designing optimal electrode structures.
Parametric simulations are conducted using the 2D model to investigate the coupled transport and electrochemical reactions in a planar SOEC. At an operating potential lower than the TNV (1.463V at 1173K), the mean electrolyte temperature decreases with increasing potential, reaches the minimum at a potential about 1.1V and then increases with further increase in operating potential. At the TNV, the calculated mean electrolyte temperature matches very well the inlet gas temperature, indicating that the heat requirement for electrochemical reduction of CO2 is balanced by the ohmic heat generation. An increase in operating potential considerably increases the local current density, which in turn leads to lower CO2 molar fraction and higher Nernst potential. Increasing the inlet gas velocity increases the SOEC electric performance due to more uniform distribution of gas composition along the flow channel. In addition, the local current density can be enhanced by increasing the inlet CO2 molar fraction, due to reduced Nernst potential. It is also found that varying the electrode permeability in the range of 10-16 m2 – 10-13 m2 does not noticeably influence the SOEC performance.
The models developed in this paper are capable of predicting the SOEC performance at 1D and 2D levels. In order to better understand the physical-chemical processes, 3D models will be developed in the future. In addition, energy and exergy analysis will be conducted in the future to optimize the overall efficiency of the SOEC system.
References:
[1] W. Jamsak, S. Assabumrungrat, P.L. Douglas, N. Laosiripojana, R. Suwanwarangkul, S. Charojrochkul, E. Croiset, Performance of ethanol-fuelled solid oxide fuel cells: proton and oxygen ion conductors, Chemical Engineering Journal, 133(1-3) (2007) 187 -194.
[2] P.Piroonlerkgul, W. Wiyaratn, A. Soottitantawat, W. Kiatkittipong, A. Arpornwichanop, N. Laosiripojana, S. Assabumrugrat, Operation viability and performance of solid oxide fuel cell fuelled by different feeds, Chemical Engineering Journal, 155(1-2) (2009) 411-418.
[3] Z. Gao, Z.Q. Mao, C. Wang, J.B. Huang, Z.X. Liu, Composite electrolyte based on nano-structured Ce0.8Sm0.2O1.9(SDC) for low-temperature solid oxide fuel cells, International Journal of Energy Research, 33(13) (2009) 1138-1144.
[4] Z.Q. Mao, Fuel cells, Chemical Industry Press, Beijing, 2005.
[5] G.L. Hawkes, J. O’Brien, C. Stoots, B. Hawkes, 3D CFD model of a multi-cell high-temperature electrolysis stack, International Journal of Hydrogen Energy, 34 (2009) 4189-4197.
[6] J.S. Herring, J.E. O’Brien, C.M. Stoots, G.L. Hawkes, J.J. Hartigsen, M. Shahnam, Progress in high-temperature electrolysis for hydrogen production using planar SOFC technology, International Journal of Hydrogen Energy, 32 (2007) 440 – 450.
[7] J. Udagawa, P. Aguiar, N.P. Brandon, Hydrogen production through steam electrolysis: model-based steady-state performance of a cathode-supported intermediate temperature solid oxide electrolysis cell, Journal of Power Sources, 166 (2007) 127-136.
[8] J. Udagawa, P. Aguiar, N.P. Brandon, Hydrogen production through steam electrolysis: model-based dynamic behavior of a cathode-supported intermediate temperature solid oxide electrolysis cell, Journal of Power Sources, 180 (2008) 46 – 55.
[9] G. Tao, K.R. Sridhar, C.L. Chan, Study of carbon dioxide electrolysis at electrode/electrolyte interface: part I. Pt/YSZ interface, Solid State Ionics, 175 (2004) 615-619.
[10] G. Tao, K.R. Sridhar, C.L. Chan, Study of carbon dioxide electrolysis at electrode/electrolyte interface: part II. Pt-YSZ cermet/YSZ interface, Solid State Ionics, 175 (2004) 621-624.
[11] K.R. Sridhar, B.T. Vaniman, Oxygen production on Mars using solid oxide electrolysis, Solid State Ionics, 93 (1997) 321-328.
[12] S. Dalgaard Ebbesen, M. Mogensen, Electrolysis of carbon dioxide in solid oxide electrolysis cells, Journal of Power Sources, 193 (2009) 349-358.
[14] M. Ni, M.K.H. Leung, D.Y.C. Leung, An electrochemical model of a solid oxide steam electrolyzer for hydrogen production, Chemical Engineering & Technology, 29 (2006) 636-642. [15] M. Ni, M.K.H. Leung, D.Y.C. Leung, A modeling study on concentration overpotentials of a reversible solid oxide fuel cell, Journal of Power Sources, 163 (2006) 460-466.
[16] E. Hernandez-Pacheco, D. Singh, P.N. Hutton, N. Patel, M.D. Mann, A macro-level model for determining the performance characteristics of solid oxide fuel cells, Journal of Power Sources, 138 (2004) 174-186.
[17] R.C. Reid, J.M. Prausnitz, B.E. Poling, The Properties of Gases & Liquids, 4th Edition, McGraw-Hill Book Company, New York, 1987.
[18] J.H. Nam, D.H. Jeon, A comprehensive micro-scale model for transport and reaction in intermediate temperature solid oxide fuel cells, Electrochimica Acta, 51 (2006) 3446-3460.
[19] C.Y. Wang, Fundamental models for fuel cell engineering, Chemical Reviews, 104 (2004) 4727 – 4765.
[20] M.W. Chase, NIST-JANAF Thermochemical Tables (4th ed.), American Chemical Society; American Institute of Physics for the National Institute of Standards and Technology; 1998.
[21] S.V. Patankar, Numerical Heat Transfer and Fluid Flow, New York: McGraw-Hill Book Company; 1980.
[22] M. Ni, Modeling of a planar solid oxide fuel cell based on proton-conducting electrolyte, International Journal of Energy Research, 2009, in press. DOI: 10.1002/er.1620.
[23] S.H. Chan, K.A. Khor, Z.T. Xia, A complete polarization model of a solid oxide fuel cell and its sensitivity to the change of cell component thickness, Journal of Power Sources, 93 (2001) 130-140.
[24] X.J. Chen, S.H. Chan, K.A. Khor, Simulation of a composite cathode in solid oxide fuel cells, Electrochimica Acta, 49 (2004) 1851 – 1861.
[25] A. Ali, X. Wen, K. Nandakumar, J.L. Luo, K.T. Chuang, Geometrical modeling of microstructure of solid oxide fuel cell composite electrodes, Journal of Power Sources, 185 (2008) 961 – 966.
[26] G. L. Hawkes, J.E. O’Brien, C.M. Stoots, J.S. Herring, CFD model of a planar solid oxide electrolysis cell for hydrogen production from Nuclear energy, The 11th International Topical Meeting on Nuclear Reactor Thermal-Hydraulics (NURETH-11), Avignon, France, 2 – 6 October 2005.
[27] E. Resch, Numerical and experimental characterization of convective transport in solid oxide fuel cells, MSc. Thesis at Queen’s University, Kingston, Ontario, Canada, 2008.
List of Tables
Table 1. Parameters used in electrochemical modeling analysis of an SOEC for CO2 electrolysis [14, 16, 23]
Table 2. Parameters used in calculating the effective diffusion coefficients Table 3. Entropy of O2, CO and CO2 [20]
Table 4. Parameters used in 2D thermal-fluid modeling analysis of a planar SOEC for CO2 electrolysis [22]
List of Figures
1. Working mechanisms of CO2 electrolysis by an SOEC 2. 2D view of a planar SOEC used for CO2 electrolysis
3. Comparison of simulation results with experimental data [12] for model validation
4. Theoretical activation, concentration, and ohmic overpotentials of an anode-supported SOEC 5. Effect of operating pressure on concentration overpotentials
6. Effect of electrode porosity on concentration overpotentials 7. Mean electrolyte temperature versus operating potential
8. Effect of operating potential on SOEC performance – (a) Effect of operating potential on current density distribution; (b) effect of operating potential on electrolyte Nernst potential distribution 9. Effect of operating potential on CO2 molar fraction distribution at the cathode – (a) Operating
potential: 1.0V; (b) Operating potential: 1.6V
10.Effect of operating potential on temperature distribution – (a) Operating potential: 1.0V; (b) Operating potential: 1.6V
11.Effect of inlet gas velocity on SOEC performance – (a) Current density distribution; (b) Electrolyte Nernst potential distribution
12.Effect of inlet gas velocity on CO2 molar fraction distribution at the cathode – (a) Inlet gas velocity: 0.2ms-1; (b) Inlet gas velocity: 0.5ms-1; (c) Inlet gas velocity: 1.0ms-1
13.Effect of inlet CO2 molar fraction on SOEC performance – (a) Current density distribution; (b) Electrolyte Nernst potential distribution
Table 1. Parameters used in 1D electrochemical modeling analysis of an SOEC for CO2 electrolysis [14, 16, 23]
Parameter Value
Operating temperature, T (K) 1,073
Operating pressure, P (bar) 1.0
Electrode porosity,
ε
0.4Electrode tortuosity, ξ 5.0
Average pore radius, rp (µm) 0.5
Electrolyte conductivity (Ω ⋅−1 m−1) 4 10300 3.34 10 exp T × −
Exchange current density (A/m2) Cathode Anode 5300 2000 Anode-supported SOEC: Anode thickness da (µm) Electrolyte thickness, L (µm) Cathode thickness, dc (µm) 500 50 50
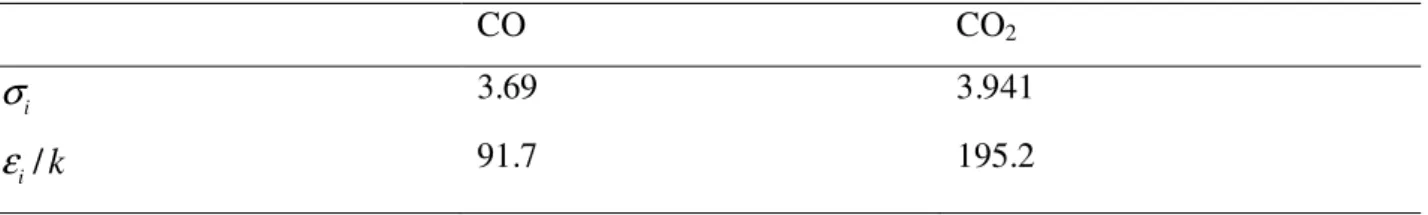
Table 2. Parameters used in calculating the effective diffusion coefficients CO CO2 i
σ
3.69 3.941 / i kε
91.7 195.2Table 3. Entropy (S, J/
(
K mol⋅)
) of O2, CO and CO2 [20] Temperature (K) O2 CO CO2 800 235.921 227.277 257.494 900 239.931 231.074 263.645 1000 243.578 234.538 269.299 1100 246.922 237.726 274.528 1200 250.010 240.679 279.390Table 4. Parameters used in 2D thermal-fluid modeling analysis of a planar SOEC for CO2 electrolysis [22]
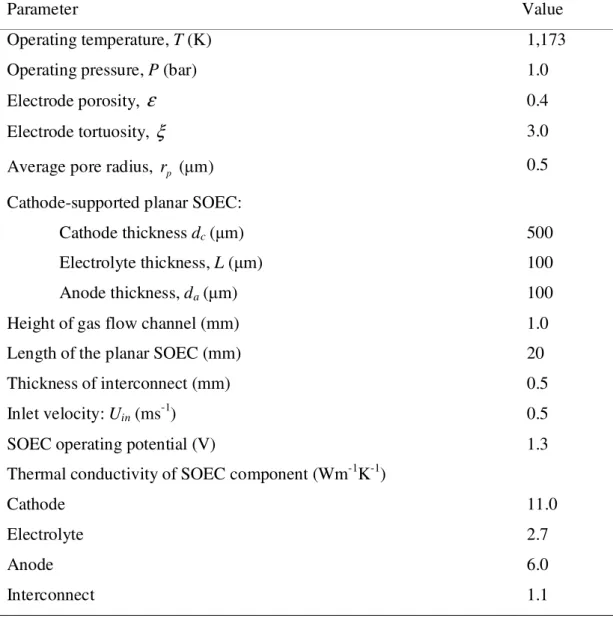
Parameter Value
Operating temperature, T (K) 1,173
Operating pressure, P (bar) 1.0
Electrode porosity,
ε
0.4Electrode tortuosity, ξ 3.0
Average pore radius, rp (µm) 0.5
Cathode-supported planar SOEC: Cathode thickness dc (µm) Electrolyte thickness, L (µm) Anode thickness, da (µm) 500 100 100
Height of gas flow channel (mm) 1.0
Length of the planar SOEC (mm) 20
Thickness of interconnect (mm) 0.5
Inlet velocity: Uin (ms -1
) 0.5
SOEC operating potential (V) 1.3
Thermal conductivity of SOEC component (Wm-1K-1) Cathode Electrolyte Anode Interconnect 11.0 2.7 6.0 1.1
0
5000
10000
15000
20000
0.0
0.1
0.2
0.3
0.4
0.5
Concentration, anode
Concentration, cathode
Activation, cathode
Activation, anode
Ohmic
O
v
e
rp
o
te
n
ti
a
ls
(
V
)
Current density,
J
(Am
-2)
(a) Effect of operating potential on current density distribution
(b) Effect of operating potential on electrolyte Nernst potential distribution Fig. 8 Effect of operating potential on SOEC performance
(a) Operating potential: 1.0V
(b) Operating potential: 1.6V
(a) Operating potential: 1.0V
(b) Operating potential: 1.6V
(a) Current density distribution
(b) Electrolyte Nernst potential distribution
(a) Inlet gas velocity: 0.2ms-1 (b) Inlet gas velocity: 0.5ms-1
(c) Inlet gas velocity: 1.0ms-1
(a) Current density distribution
(b) Electrolyte Nernst potential distribution
![Table 1. Parameters used in 1D electrochemical modeling analysis of an SOEC for CO 2 electrolysis [14, 16, 23]](https://thumb-us.123doks.com/thumbv2/123dok_us/10056174.2498380/22.892.90.809.222.699/table-parameters-used-electrochemical-modeling-analysis-soec-electrolysis.webp)
![Table 3. Entropy (S, J / ( K mol ⋅ ) ) of O 2 , CO and CO 2 [20] Temperature (K) O 2 CO CO 2 800 235.921 227.277 257.494 900 239.931 231.074 263.645 1000 243.578 234.538 269.299 1100 246.922 237.726 274.528 1200 250.010 240.679 279](https://thumb-us.123doks.com/thumbv2/123dok_us/10056174.2498380/24.892.82.816.217.404/table-entropy-s-j-k-mol-o-temperature.webp)
![Fig. 3. Comparison of simulation results with experimental data [12] for model validation](https://thumb-us.123doks.com/thumbv2/123dok_us/10056174.2498380/28.892.207.681.313.687/fig-comparison-simulation-results-experimental-data-model-validation.webp)