FACEBOOK USERS’ EXPERIENCE AND ATTITUDE TOWARD FACEBOOK ADS
By
XUEYING ZHANG
Master of Arts in Applied Linguistics Beijing Foreign Studies University
Beijing, China 2005
Submitted to the Faculty of the Graduate College of the Oklahoma State University
in partial fulfillment of the requirements for
the Degree of MASTER OF SCIENCE
ii
FACEBOOK USERS’ EXPERIENCE AND
ATTITUDE TOWARD FACEBOOK ADS
Thesis Approved:
Dr. Derina Holtzhausen Thesis Adviser
Dr. Joey Senat
iii
ACKNOWLEDGMENTS
(Acknowledgements reflect the views of the author and are not endorsed by committee members or Oklahoma State University.)
I would like to express my sincere gratitude to my advisor, Dr. Derina Holtzhausen, for the continuous support of my graduate study and research, for her valuable time, motivation, enthusiasm and immense knowledge. Her guidance helped me in all the time of research and writing of this thesis. I could not have imagined having a better mentor for my master study. I would also like to thank the rest of my thesis committee: Dr. Joey Senat and Dr. Ken Kim for their encouragement, insightful comments and hard questions. My sincere thanks also go to Dr. Stan Ketterer and Dr. Cynthia Nichols. Dr. Ketterer’s statistical expertise has aided me to present empirical data to support research hypotheses. Dr. Nichols’s detailed effort has
enlightened me of data entry using SPSS software.
In addition, I would like to thank Dr. Joey Senat, Dr. Ken Kim, Professor Mike Sowell, Dr. Cynthia Nichols, Professor Juliana Nykolaiszyn and her husband and Dr. Tieming Liu and Dr. Zhenyu Kong in Industrial Engineering department for use of their class time to administer the surveys. I appreciate the participating students’ time and effort in filling out the
questionnaire, this study would not be possible without their assistance.
Lastly, I wish to thank my mom, for giving birth to me at the first place and supporting me spiritually throughout my life. It is to her I dedicate this work.
iv Name: XUEYING ZHANG
Date of Degree: MAY, 2013
Title of Study: FACEBOOK USERS’ EXPERIENCE AND ATTITUDE TOWARD FACEBOOK ADS
Major Field: MASS COMMUNICATION Abstract:
As Facebook is gaining power as an advertising vehicle, it is crucial for both Facebook and advertisers to understand users’ Facebook experience. Based on media context effect studies and media uses and gratification theory, this research proposes and empirically tests the relationship between users’ Facebook experience and their attitude toward ads (Aad). Three Facebook experience factors and five Aad factors are generated. Most of the experience factors are highly and significantly correlated with users’ Aad factors, however, the empowerment experience is shown to have a stronger association with Aad than the other two experience factors. The individual factors of gender and online shopping time’s effect on Aad are also tested but only minor associations are found. Implications for Facebook and advertisers were then posited and discussed.
v
TABLE OF CONTENTS
Chapter Page
I. INTRODUCTION ...1
II. REVIEW OF LITERATURE...5
Advertising hierarchy of effects model and attitude toward ads ...5
Media context effect and media engagement as antecedents of Aad ...8
Defining users’ Experience with Facebook ...14
Conceptualizing advertising on Facebook ...15
Individual difference factors ...19
Hypotheses and research questions ...21
III. METHODOLOGY ...24
Sampling ...24
Measures ...25
Users’ experience with Facebook ...25
Facebook users’ attitude toward the ads ...28
vi
Chapter Page
IV. FINDINGS ...32
Characteristics of respondents ...32
Factor analysis of Facebook experience ...34
Factor analysis with Facebook users’ attitude towards ads ...37
T-test ...41
Regression tests ...42
V. CONCLUSION ...61
Discussion ...61
RQ1: What are the underlying factors of users’ Facebook experiences ...63
H1: Users’ experience with Facebook differs by gender ...65
RQ2: What are the underlying factors of users Aad. ...65
H2: Users Facebook experiences are related to attitude toward ads ...66
Implications...70
Limitation & Future research ...72
REFERENCES ...74
APPENDIX A: INSTRUMENTS ...83
Figure A1: Survey Consent...83
Figure A2: Questionnaire...84
APPENDIX B: IRB DOCUMENTATION ...91
Figure B1: Application Approval...91
Figure B2: Approved Script for Introduction of Survey...92
vii
LIST OF TABLES
Table Page
3.1 Facebook Experience Measures ...27
4.1 Sample Demographics ...32
4.2 Factor Analysis of Facebook experience ...35
4.3 Factor Analysis of Attitude toward ads ...39
4.4.1 T-test Comparing Gender by Facebook experience—Empowerment ...41
4.4.2 T-test Comparing Gender by Facebook experience—Community-self-worth .... ...41
4.4.3 T-test Comparing Gender by Facebook experience—Social participation ...42
4.5 Pearson Correlation Coefficients for Facebook Experience and Attitude toward ads ...43
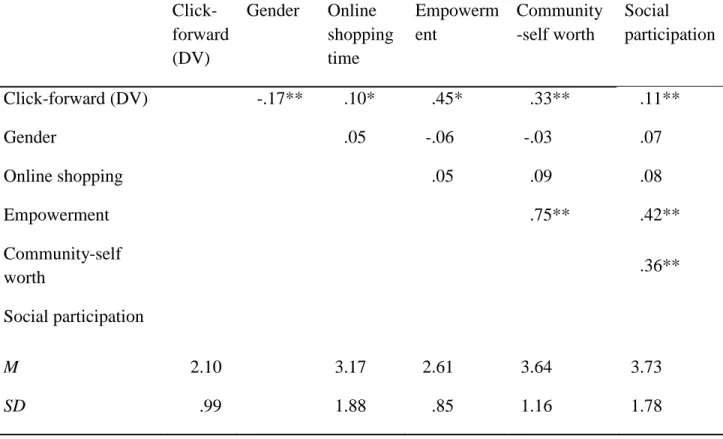
4.6.1 Pearson Correlation and Descriptive Statistics for Click-forward and Facebook experiences ...46
4.6.2 Sequential Regression for Click-forward and Facebook Experiences ...47
4.7.1 Pearson Correlation and Descriptive Statistics for Attention-interest and Facebook experiences ...49
4.7.2 Sequential Regression for Attention-interest and Facebook Experiences ...50
4.8.1 Pearson Correlation and Descriptive Statistics for Perceived ads Value for Facebook and Facebook Experience ...52
4.8.2 Sequential Regression Statistics for Perceived ads Value for Facebook and Facebook Experience ...53
4.9.1 Pearson Correlation and Descriptive Statistics for Ads Avoidance and Facebook Experience ...54
4.9.2 Sequential Regression for ads Avoidance and Facebook experience ...55
4.10.1 Pearson Correlation and Descriptive Statistics for Friend Forwarded ads Avoidance and Facebook experience...56
4.10.2 Sequential Regression for Friend Forwarded Ads Avoidance and Facebook Experience ...57
4.11 Person Correlation Coefficients for Facebook Experience and Attitude toward Ads Variables ...58
1 CHAPTER I
INTRODUCTION
Social Networking Sites (SNS) have become an important online destination among internet users over the last decade. comScore Data Mine (2012) reported that in October 2011 Social Networking Sites ranked as the most popular content category in World Wide Web engagement, accounting for 19 percent of all time spent online. Nearly 1 in every 5 minutes spent online is now spent on SNSs, which represents a stark contrast from when the category accounted for only 6 percent of time spent online in March 2007. Among the most popular SNSs is Facebook, which claimed to have 955 million monthly active users at the end of June 2012 (Facebook.com). Along with building their public profiles and establishing connections with others in their social network (Boyd & Ellison, 2007), Facebook users derive a variety of uses and gratifications from social networking sites and develop “stickiness” of the site (Joinson, 2007, p.1035).
Ever since the penny press newspaper was introduced in the 19th century, media companies have been operating on advertising revenue. SNSs are no exception to this business model. By providing an arena for people to interact with one another, SNSs
2
seem to display a greater deal of potential for business to reach their target audiences (Todi, 2008). The momentum of SNS has given rise to the broad anticipation of using it as a marketing tool, such as turning it into a new destination of online shopping and perfect place for advertising. However, doubts have been cast on both options. Last year, several pioneers such as Gap Inc., J.C. Penny (JCP) Co. and Nordstrom (JWN) Inc., have opened and closed storefronts on Facebook (Lutz, 2012). Skepticism about effectiveness of advertising on Facebook is also prevailing. Paralleled with the General Motors’ withdrawal of $ 10 million annual ad spending on Facebook is the fact that the click-through rates for Facebook ads are as tiny as .05%. Facebook seems to be facing a problem serving as advertising platform and analysts do not view this conundrum to be surprising. “People on Facebook use it to communicate with friends and family, while happily ignoring the ads that Facebook runs along the side of the page” (Evans, 2012, para.4). The skeptical argument about advertising on Facebook also goes to Facebook pages brands create, since “many ‘likes’ simply have to do with contests and giveaways as opposed to consumers being enthralled with a brand” (Evans, 2012, para. 6).
Up to August 15, 2012 Facebook’s stock has tumbled 46% since it went public in May 2012, valued at a more than $100-billion (Raice, 2012). Much of the drop has been fueled by concerns over the efficacy of Facebook’s ads. “The crux of advertisers’ doubts centers on whether Facebook ads actually sell goods and if they can be measured in a way that can be compared to other forms of advertising” (Raice, 2012, para. 16). Marketers aired their frustration of not being able to get access to the exact data of Facebook users’ reaction to the ads, and they are afraid that this conundrum is likely to
3
continue since Facebook cannot reveal too much information about individual people due to privacy policies, which is the information marketers need (Raice, 2012).
The need for research on advertising on SNS like Facebook is apparent, especially because SNS users’ information is not readily available to advertisers. More empirical research is needed to sooth the fears of investors or analysts who are looking at Facebook as an advertising platform with tremendous marketing potential. One way to provide new insights for advertisers hoping to better understand how ads on SNS work would be to use research based on behavioral analysis. “A variety of behavioral variables can help deliver improved ROI (Return of Investment). There is an opportunity to develop models to more efficiently target audiences with characteristics similar to brand Fans and Friends of Fans” (comScore, 2012, p. 3). On the other hand, communication researchers have also recognized the media context effect on consumers’ acceptance of the ads presented on the platform and posited that consumers tend to be more responsive to advertising when they are “highly engaged with a media vehicle ” (Calder, Malthouse & Schaedel, 2009, p. 321). Therefore, it is possible to approach the efficacy of ads on Facebook by probing into Facebook users’ usage patterns, to see if their engagement with Facebook relates with consumers’ acceptance of the ads, and how this happens.
The contribution of this study is twofold. First, it adds to the study of media engagement dimensions, as previously studied in print, broadcasting and Internet (Bronner & Neijens, 2006; Calder, Malhouse & Schaedel, 2009). Understanding users’ engagement with Facebook specifically is an extension of these studies. Second, it yields insights regarding how advertisers can best manage their campaign message to reach the
4
consumers with the greatest likelihood of having a favorable reaction and strong brand affinity.
This study adds to this field of knowledge through a thorough review of the relevant literature and a quantitative survey among a student population before describing the results of the study and drawing conclusions on users’ engagement with ads on Facebook.
5 CHAPTER II
LITERATURE REVIEW
A relatively large number of theories have in the past been applied to the study of reaction to advertisements in different media context. Each of these theoretical
approaches was discussed below.
Advertising hierarchy of effects model and Attitude toward Ads
In their ground breaking model for predictive measurements of advertising
effectiveness, Lavidge and Steiner (1961) suggested advertising is a force to move people up a series of steps from initially being aware of the product, to liking and preference, and then making purchase decisions. In this hierarchy of effects model, consumers’ attitudes at each stage of the process can be used as an important measure in evaluating the effectiveness of marketing practice (Poh & Adam, 2012). Attitude refers to a person’s internal evaluation of an advertisement, which is relatively stable and can indicate
enduring predisposition to behavior (Mitchell & Olson, 1981). In advertising studies, the majority of attitude toward ad research comes from two sources: Shimp (1981) and
6
Mitchell and Olson (1981). They introduced the concept of attitude toward ad (Aad) as individuals’ evaluations of the overall advertising stimulus, which should be considered distinct from beliefs and brand attitudes (Muehling & McCann, 1993). Mackenzie and Luz (1986) elaborated more specifically on Aad’s role and purported a dual mediation hypothesis (DMH). According to DMH, Aad and the other four measures --Ad
Cognitions (C ad), Brand Cognitions (Cb), Attitude toward the brand (Ab) and Intention to Purchase the Brand (Ib) -- are considered indicators of advertising effectiveness. Aad. plays a mediating role in advertising effectiveness by influencing brand attitude both directly and indirectly through its effect on brand cognitions, which in turn will influence consumers’ intention to buy.
Although a lot of researchers have recognized Aad as a distinct dimension, they never reached a consensus on what it is exactly comprised of. Some researchers referred to Aad as a purely affective dimension (Lutz, 1985; Mackenzie & Lutz, 1989) while others considered it in multidimensional terms (Shimp, 1981; Olney, Holbrook, & Batra, 1991; Muehling & McCann, 1993). And a vast body of research gave diverse answers to the question of what affects Aad (Muehling & McCann, 1993; Brackett & Carr, 2001). In their review of Aad, Muehling and McCann (1993) summarized the purported
antecedents and subdivided them in to three categories: 1) personal/individual factors that are inherent in the ad processer (e.g. Litz, Mackenzie & Belch, 1983); 2) ad-related Factors, e.g. use of humor or celebrity to enhance an individual’s view about the ad; 3) other factors such as time and product features. Muehling and McCann (1993) argued that “settling the definitional/dimensional issue would appear to be critical before
7
questions concerning Aad’s antecedents and consequences can be further explored” (p.51).
Allowing a wide range of definition of Aad antecedents actually give researchers flexibility in applying the concept to different contexts. For example, when Lutz (1985) viewed Aad as a purely affective term without involving cognitive or behavioral
components, he noted this view of Aad should focus on a particular exposure to a particular ad (Muehling & McCann, 1993). Choosing different models of Aad actually allows researchers to operationalize their research of advertising effectiveness in “varying degrees of depth, breadth, and specificity” (Brackett & Carr, 2001, p. 24). This
diversified model allowed research on attitude toward web advertising to flourish when it came into being. Some researchers based their investigations upon the existent model of Aad of traditional advertising. For example, Karson and Fisher (2005) reexamined Makenzie and Lutz’s (1989)’s Dual Mediation Hypothesis in an online advertising context, substituting attitude toward site for attitude toward ad. Brackett and Carr (2001) tested Ducoff’s (1995) model with its three perceptual antecedents (entertainment, informativeness and irritation) to investigate Aad on the internet. They added credibility and demographic variables to construct a new model, which they tested using a student sample. Poh and Adam’s (2012) research on online marketing context was also based on Ducoff’s (1995) model but they substituted ad with commercial website as the subject of the test.
Other researchers have paid special attention to examining unique characteristics of online advertising. This line of research addressed the impact of the interactivity of the ads (Rosenkrans, 2009), the Web site’s complexity (Bruner & Kumar, 2000) and the
8
placement of ads and fee paid to access internet content (Gorden & Turner, 1997). They also took Web users’ attributes into consideration. For example, Sicilia and Ruiz’s (2007) research introduced flow state to the model of Aad and Korgaonkar and Wolin (2002) examined the variance of Aad among heavy, medium and light users. To summarize, since there’s no universal definition of Aad, researchers have introduced a broad variety of antecedents for Aad to approach specific research situations.
Media context effect and media engagement as antecedents of Aad
Researchers have long recognized the capacity of media context to influence audience perceptions of the ads (De Pelsmacker, Geuens & Anckaert, 2002; Moorman, Neijens & Smit 2002; MacInnis & Park, 2002; Lord, Burnkrant & Unnava 2001; Kim & Sundar, 2012). Such influence can be generated from multiple attributes of the medium, such as the similarity in the mood of the media context and the ads; the prestige of the media source that rubs off on the brand; and the media context serving as a cognitive prime that guides the attention and determines the interpretation of the ad (Dahlen, 2005). The nature of the medium itself may also moderate the editorial content’s influence on acceptance of the ads. Norris and Colman (1992) provided a medium-related view, claiming that because ads in print media can be skipped more easily compared to ads on radio and television, the appreciation of the context leads to less ad processing in print media than on radio and television. When it comes to Internet ads, Kim and Sundar, (2012) have noticed the ad relevance effect, which was called fittingness (Kanungo & Pang, 1973) or congruence (Kamins, 1990; Lynch & Schuler, 1994). Ad relevance effect in traditional advertising research applied well to the Internet environment with the ad relevance contributing positively to both the users’ attitude toward website and attitude
9
toward ads (Kim & Sundar, 2012). The researchers suggested the rationale behind this is that Internet users are goal-oriented when they use a website, therefore, the ads that are relevant to the website context would probably match their goals for browsing this site and therefore be of greater interest. These and other studies combined to form Media Context Studies, which “investigate how and which media context variables influence the effects of the advertisements embedded in that context” (Bronnner & Neijens, 2006, p.82).
While the influence of media context on embedded ads undoubtedly exists and is important, it is also complicated and difficult to evaluate. Hypotheses should be posited with caution, since related theories may be conflicting in this regard. For example, the Feelings-as-information Theory suggested that people in a positive mood tend to avoid stimuli such as ads (Kuykendall & Keating, 1990). If people acquire a good mood as a result of processing media content, they may avoid paying attention to ads embedded in this context and process them less intensively. However, the Hedonic Contingency view stated that people in a positive mood may engage in greater processing of a stimulus because they believe that the consequences are going to be favorable (Lee & Sternthal, 1999). Given the complexity of the issue, a framework of media context effect on advertising response is demanded. One such endeavor is conceptualizing media engagement as an antecedent of the attitude toward the embedded advertisements (Malthouse & Calder, 2009; Dahlen, 2005; Bronner & Neijens, 2006).
Initially, scholars used the term experience to refer to these influential factors when relating to how media use would influence advertisement acceptance. For example, in Bronner and Neijens’ (2006) study on audience experience of media context and
10
embedded advertising, the authors used the experiences variables to refer to all media context variables. Experience was described as “an emotional, intuitive perception that people have while using the media” (p. 84). Calder and Malthouse (2009) defined media experience as “the thoughts and feelings consumers have about what is happening when they are doing something” in or with media (p.257). For example, users have a utilitarian experience when they believe a website provides information that facilitates their
decision making. They have an intrinsically enjoyable experience when other content enables them to escape from the pressures of daily life. Calder and Malthouse (2009) described experience as consisting of two dimensions: the hedonic value associated with the experience and the motivational component, which is posited as engagement. Hence, the engagement is conceptualized as “the sum of the motivational experiences consumers have with the media product” (p.259), which affects the strength of media experience. It influences people’s reaction to advertisements because the strong motivational
experiences consumers have with a media vehicle would make an ad potentially part of something that consumers are trying to make happen in their life. This theory has an important relevance for this study as it indicates a relationship exists between media users’ behaviors with the media platform and their reaction toward ads.
When Calder et al. (2009) applied this theory to examine the effectiveness of advertising; they developed second-order engagement factors by applying factor analysis to eight online experiences. They identified two types of engagement, personal
engagement and social interactive engagement. They argued personal engagement is manifested in experiences that have counterparts in magazines and newspapers. It is about users seeking stimulation and inspiration, interactions with other people, self-worth
11
and a sense of intrinsic enjoyment in using the site itself. Social-Interactive Engagement relates to users experiencing some of the same things in terms of intrinsic enjoyment, utilitarian worth, and valuing the input from the larger community of users, but in a way that links to a sense of participating with others and socializing on the site. It is proposed to be more specific to Websites because Internet is thought to be more social in nature and Social-interactive Engagement emphasizes the value users can get from the social use of the website.
Malthouse and Calder’s (2009) conceptualization of experience and engagement to approach people’s involvement with the media viewed the audience as proactive
individuals. This approach paralleled with uses and gratifications theory, which posited that media users actively seek out media to satisfy either utilitarian or hedonic needs (Katz & Foulkes, 1962). Katz, Blumber and Gurevitch (1974) pointed out that the uses and gratifications approach is concerned with the social and psychological origins of needs, which generate expectations of the mass media or other sources. This leads to differential patterns of media exposure or engagement in other activities resulting in need gratifications and other consequences, perhaps mostly unintended ones. According to this theory, if the acceptance of the ads on media is viewed as an unintended consequence, both the media uses and gratifications and the motives -- “the expressed desires for gratification in a given class of situations” (Mcleod & Becker, 2981, p.74) -- should be held as accountable for the variance of ad acceptance.
The importance of examining motives that drive individuals to use the Internet has long been recognized by scholars when they examine what kind of ads and ad appeals attract attention and prompt click-throughs (Clary, Ridge, Stukas, Snyder, Copeland,
12
Haugen & Miene, 1998; Rodgers & Sheldon, 2000). The central idea of this approach is to understand why individuals visit the Internet before beginning to understand how people process Web-based ads (Rodgers & Thorson, 2000). Rodgers and Thorson (2000) proposed this approach as a functionalist model and posited that the rationale is based on John Dewey’s (1896) notion of the reflex circuit, that is, the activity does not start with a stimulus, it is a “reflex circuit” where the responses become the stimuli (Rodgers & Thorson, 2000, p. 44.). The researchers argued that in terms of Internet advertising, how Internet users perceive and process ads do not start with the advertising message, but rather represents a response to individual needs. Rodgers and Thorson posited that the functionalist model is broader than the Uses and Gratifications model. While the Uses and Gratification approach more often than not just focuses on the why of the users’ Internet motives, a functionalist approach strives to articulate both the why and how of users’ Internet motives. For example, Internet users can log onto cyberspace for searching or surfing and these two motives might switch during the process. So, in addition to the motive, Rodgers and Thorson proposed a second component of their model, namely, the mode, which is the extent to which the Internet users are goal oriented. The difference of mode would make the online experience more serious or just being playful. These two dimensions of motives and mode, the authors argued, are the most important factors to understand how interactive advertising operates. Again, their approach, the functionalist model, represents an effort to apply Uses and Gratifications theory to evaluate Internet ads’ outcome. It is similar to Malthouse and Calder’s (2009) effort to conceptualize media experience and engagement to approach consumers’ attitude toward ads.
13
After providing the conceptual clarity for thinking about media context effects, scholars proposed and tested the relationship between media engagement and advertising effectiveness. They suggested that all things being equal, if consumers engaging with a media vehicle have strong motivational experiences, an ad potentially becomes more effective on this medium as well. Based on this argument Calder and Malthouse (2006) proposed a media congruency hypothesis and tested it empirically with magazine ads, with positive results. Bronnner and Neijens (2006) tested this hypothesis with eight media platforms ranging from print to broadcasting and showed different strengths of the interaction between media context and the embedded advertising. The strongest
relationships were found for print media, and the weakest for television and cinema. With the emergence of the Internet, Calder, Malthouse and Schaedel (2007) tested it in
Website context and also got supportive results. The experiment yielded a positive
correlation between Web users’ engagement with Websites and reaction toward an Orbitz (an online travel agency) ad. This study showed both overall engagement and personal and social interactive engagement affected reaction to ads, while social interactive engagement was more uniquely attributed to online media having an independent effect on ad reaction.
This study adopts the above theoretical framework to examine Facebook users’ engagement and their attitude toward ads. This requires identifying Facebook users’ SNS engagement factors first. In this regard, studies using Use and Gratifications theory casts light on the current study.
14 Defining Users’ Experience with Facebook
Social networking sites (SNS) are important social platforms for computer-mediated communication. In recent years, they have infiltrated people’s daily lives with amazing rapidity (Lin & Lu, 2011). As Web-based service aims to foster group formation, scope and influence (Kane, Fichman, Gallaugher, & Glaser, 2009; Lin & Lu, 2011), SNS allow individuals to construct a profile that is public or semi-public, keep a list of other users with whom they share a connection, view others’ lists of connections, share text and images, and link other members of the site by applications and groups (Boyd & Ellison, 2008; Lin & Lu, 2011). Examples of successful SNS may include Facebook, MySpace, Friendster, Live Journal, LinkedIn, Cyworld and Xiaonei (Pempek, Termolayeva, & Yermolayeva, 2009; Kwon &Wen 2009; Taylor, Lewin, & Strutton, 2011).
Facebook’s expansion has attracted scholars who examined SNS users’ practices, motivations, and influences from a uses and gratifications perspective. Exploratory interview and survey studies yielded a series of social and informational motives
(Joinson, 2008; Johnson & Yang, 2009; Kwon and Wen 2009; Pempek, et al., 2009), and researchers paid special attention to Facebook’s advantage in forming relationships between individuals and enhancing interactions between users. They posited that Facebook usage had the potential to impact individuals’ social capital by enabling interpersonal feedback and enhancing peer acceptance, by fulfilling the users’
informational needs, and by providing a series of applications to meet users’ needs for pure entertainment and recreation (Ellison, 2007). Researchers also proposed enjoyment is the most influential factor in people’s continued use of Facebook, followed by number of peers who use the site and its usefulness (Lin & Lu, 2010).
15
Although studies varied in classification of what exactly constitutes the Facebook users’ experiences, there is a probability that they can be reduced to a concise version of second-order engagement factors. Calder et al.’s (2009) experience measures covered both experiences that are common across media and specific in online experiences, which include most of the users’ motives suggested in the above-mentioned SNS literature. Their study highlighted social engagement and the need of interactivity, which make them valuable measures to be tested within the Facebook environment. Therefore, this study will factor analyze Calder et al. (2009)’s experience measures and test whether they could plausibly be reduced to second-order engagement dimensions in Facebook context.
Conceptualizing Advertising on Facebook
Social media emerged as a new advertising media with many advantages: the potential to reach large audiences exceeding those of traditional media, cost efficiency, and ability to target advertising more effectively (Todi, 2008). More importantly, social media advertising is changing the way companies communicate with their consumers. Not only can companies talk to customers on social media in the traditional way, but consumers can also talk to each other and produce a magnified form of word-of-mouth (WOM) (Mangold & Faulds, 2009). For companies, it means tremendous opportunities to “deliver maximum reach and achieve brand resonance and hopefully influence consumers to purchase or engage with the brand” (comScore, 2012, p.7).
“For brands to resonate on Facebook, the first step is literally to be seen (comScore, 2012, p.7)”. To create brand exposure, the most straightforward way would be placing ads on the Web page. Sponsored ads that appear on the right side bar resemble the
16
traditional banner ads on Web pages, except liking information would appear at the bottom (e.g. 2,945,499 people like AT&T). Sponsored ads are far from the core advertising effort brands make to take advantage of Facebook’s social function. According to comScore’s (2012) report, although Facebook emerged as a marketing channel, the early emphasis is just on developing a brand page for brand exposure, not on making Facebook exposure as a primary means of brand engagement on Facebook. With Fan acquisition as their objective, brands’ Facebook presence is targeted at amplification of their Fan base and the continuous communication with these brand followers.
Therefore, more effort is put on reaching fans and friends of fans with four primary dissemination channels of creating brand impressions:
1. Page Publishing: unpaid impressions appear on the Brand Page wall and may also appear in the News feed of a Fan or a Friend of a Fan.
2. Stories about Friends: Friends’ engagement stories with a brand that can be seen on a Friend’s wall or in the News Feed.
3. Sponsored Stories: Paid impressions, which are distributed more broadly and appear to Fans and Friends of Fans in the News Feed or in the right hand column.
4. Ads with Social: branded messages come directly from the advertisers with a social context on the unit that appears to Friends of Fans.
As much as brands are trying every means of amplify their fan base, what they really want to take advantage is of the (WOM) effect via Facebook. WOM refers to informal communication about products and services by two or more individuals, neither one of whom is a marketer (Arndt, 1967). It has an important effect on consumer
17
decisions because WOM information is perceived as more reliable and impartial than forms of paid, persuasive information such as advertising. In SNS context, two factors would differentiate the acceptance of WOM information passed from fans to friends of fans from ads purely sponsored by companies appearing on the side bar. For one thing, traditional studies of advertising suggested consumers distrust advertising and have strong inclinations to avoid advertising on media platforms (Shavitt, Lowrey & Haefner, 1998). For another, SNS is a powerful tool for eWOM, which has enhanced the ease and speed of information dissemination, including brand-related experiences, among peers (Chu & Kim, 2011; Alon, 2005). Previous research has shown that “a social network user may believe that interactions among ‘friends’ are trustworthy but may independently appraise the site itself or advertising content displayed inside panels” (Soares, Pinho & Nobre, 2012). Therefore, the current research examined users’ response toward the purely sponsored ads and advertising information their friends delivered respectively.
Different levels of response to ads on SNS are also of interest in the current research. According to comScore’s (2012) report, brands have multilayered marketing objectives: to deliver maximum reach, achieve brand resonance, and hopefully influence consumers’ purchase decisions. To achieve these objectives, brands’ information
dissemination goes through three steps: (1) Fan reach: brand messages reach Fans in News Feeds; (2) Engagement: Fans ‘talk about’ news feed content; and (3)
Amplification: News Feed content spreads to Friends, and Ads boost content and stories. Translating brands’ expectation of marketing efforts to SNS users’ reaction to ads, this study proposes three kinds of reaction to ads: (1) users pay attention to the ads; (2) users click through to check specific information; (3) users ‘like’ the brand and share the link
18
to the brand with their friends. Only the third reaction will generate information that can be seen on friends’ news feed, and create a WOM effect. Literature examining users’ motivation of engaging in WOM communication has suggested both individual motivations and social benefits can explain voluntary behavior in computer-mediated knowledge exchange networks (Hennig‐Thurau, Gwinner, Walsh, & Gremler, 2004;
Wasko &Faraj, 2005). Individual motivation may include advice seeking, self-enhancement, economic incentives and professional reputation enhancement. Social benefits involve connection to a large number of others, commitment to the community, true altruistic desire to of help other consumers and companies, and so forth (Hennig-Thurau et al., 2004; Wasko & Faraj, 2005).
Wiertz and De Ruyter (2007) conducted a study on contribution behavior to firm-hosted commercial online communities. It shows consumers who contribute most in terms of quantity and quality are driven primarily by their commitment to the community as well as member’s online interaction propensity and the perceived informational value in the community. These results indicate a relationship between individuals’ intrinsic motivation of participating in community activity and the intention of passing
information to other community members. This provides a link to connect the SNS users’ engagement with Facebook and their likelihood to share an ad link. As both individual motivation and social benefit will enhance the knowledge contribution to the virtual community, it is reasonable to assume that people who have both stronger personal and social-interactive engagement of SNS will also have stronger intention to share
19
As social media have only recently come to the foreground of advertising, academic literature in this area is limited. Some papers provided a conceptual exploration of the future trends of integrating social media into companies’ marketing mix (Mangold & Faulds, 2009; Wright, Khanfar, Harrington & Kizer, 2010). Others were exploratory investigations of representative advertising cases (Todi, 2008) or the qualitative study of consumer responses (Harris & Dennis 2011). Taylor, Lewein and Strutton (2011)
represented a quantitative effort to construct a model of users’ attitudes toward Ads on Social Networking sites (SNA), while they proposed content-related, structural, and socialization factors as antecedents. But still little is known regarding how the differences in consumers’ use of SNS will influence their attitude toward SNA. The purpose of this study is to improve the current understanding of consumers’ attitude toward SNA from a media engagement perspective.
Individual Difference Factor: Gender Differences and Online Shopping Time
Individual differences should also be brought into consideration as we evaluate Facebook users’ engagement and their attitude toward ads. For example, previous
researches suggested that men and women have different motivations for Internet use and therefore different attitudes and behaviors (Shavitt, Sharon, Lowrey, &Haefner. 1999; Weiser, 2000; Wolin & Korgaonkar, 2003). Men are more likely to seek entertainment, leisure, and functional purposes on the Internet, while women tend to use the Internet for communication and interaction purposes (Weiser, 2000). So it is reasonable to suggest that men and women engage with Facebook in different ways. Gender differences also influence people’s attitude toward SNA. In that regard, Taylor et al. (2011) suggested a moderating effect of gender differences on the perceived ads’ features and perceived
20
social network usage’s impact on attitude toward ads on social networks. Their findings indicated (1) the motivation to seek entertainment or information from ads on SNS had a stronger effect on women’s Aad than men; (2) Users who use SNS as a way to improve quality of life (by purposefully distracting oneself from life’s ongoing challenges) had a negative attitude toward advertisements on the sites and that negative relationship was stronger for men than women; and (3) The use of SNS as a means of structuring time (using sites as part of daily routine) had a negative influence on Aad for men but a positive influence on Aad for women. Noting that their findings contradict previous studies in that the positive relationships between informativeness and entertainment on Aad is stronger for women while the peer influence on attitude toward Aad was stronger for men, the researchers interpreted such contradiction as a unique feature of SNS use. They also suggested such differences may result from the evolvement of the user profile, indicating the previous research is no longer applicable.
In this study, we propose one individual factor, online shopping, would also influence users’ attitude toward ads on Facebook. This consideration is based on the functionalist perspective of internet use (Rodgers& Thorson, 2000). Researchers have noticed that consumers’ attention paid to ads is rooted in their need to shop. With the shopping need in mind, Internet users are likely to find an ad that satisfied the need and help them make decisions. Assuming that high online shopping frequency is a response to the consumers’ needs to shop online, it is reasonable to assume that the Facebook users who happen to be frequent online shoppers have stronger shopping motivation and therefore are more likely to develop positive attitude toward ads on Facebook. In this regard, previous research showed that the experienced online shopper and inexperienced
21
ones have different ways in attending to retail information online. The experienced online shoppers are more likely to notice, understand and appreciate information and features required to search, compare and order (Petty& Cacioppo, 1986). They are more open to purchase off the web (Ward & Lee, 2000), and pay less attention to security but more to reliability, personalization and ease of use (Yang & Jun 2002). Moreover, previous research also suggested a moderating role of online shopping experience in influencing favorable attitude toward retail websites for web site factors (Elliott, 2005). For
inexperienced shoppers more so than for experienced shoppers, the ease of use is related to a more favorable evaluation of the retail sites. However, the product information and customer support are more important for online shoppers to develop positive attitude toward the sites than non-shoppers.
In light of the existing discussion of the influence of online shopping experience on Internet users’ reaction toward ads, this study will include online shopping time as another independent variable in influencing Facebook users’ reaction toward ads.
Hypotheses and Research Questions
In the literature review, the attitude toward ad, media context and ad acceptance, media experience and engagement, users’ experience with SNS and advertising on Facebook are discussed. In light of the previous studies, this study used original survey data to test users’ Facebook experience and their attitude toward ads on Facebook. Regarding media experience, previous researchers have identified a set of measures and included them on surveys of website visitors, newspaper and magazine readers, and TV news viewers (Calder & Malthouse, 2004, 2005; Malthouse, Calder, & Tambane, 2007).
22
Calder et al. (2009) went a step further in factor analyzing experience measures and identified two types of second-order engagement of web users: personal engagement and social-interactive engagement. Personal engagement is intrinsically motivated and closely related to individual qualities while social interactive engagement is both intrinsically and extrinsically motivated with the value acquired from social relevance of the experience. This study aimed to first explore Facebook users’ experience in general.
Since SNS users’ experiences haven’t been explored before, the research question was posited as:
RQ1: What are the underlying factors determining users’ Facebook experiences?
The gender difference in Facebook experience was also of the interest of the current study. Past research suggested that men and women have different motivations and resultant attitudes and behaviors for Internet use (Schlosser et al., 2999; Weiser, 2000; Wolin and Korgaonkar, 2003). Therefore, the following hypothesis was posed:
H1: Users’ experience with Facebook differs by gender.
Regarding Facebook users’ attitude toward ads, two dimensions were of concern in this study. On the one hand, previous research suggested that due to the WOM effect, the brand-sponsored stories on the side panel and friends’ recommendation that appeared in the news feed would be treated differently (Soares, Pinho & Nobre, 2012). On the other hand, by simply paying attention to the ads or developing positive attitude and hence sharing the ads’ information, the different SNS users’ attitude toward ads will have a different influence on the amplification of brand information through Facebook
23
made a difference in Facebook users’ attitude toward ads on Facebook. Therefore, this research explored the exact factors forming users’ attitude toward Facebook ads:
RQ2: What are the underlying factors that lead to users’ attitude toward ads?
The primary goal of the current research was to explore the relationship between users’ Facebook experiences and their attitude toward ads on it. Researchers have proposed that the experience with the surrounding media context increases advertising effectiveness and they have tested this hypothesis with multiple media vehicles (Calder & Malthouse, 2006, 2009; Bronnner &Neijens, 2006). Although this hypothesis has not been tested in SNS context directly, Taylor, Lewin and Strutton’s (2011) recent study on users’ attitudes toward SNS advertising (SNA) lend support to this hypothesis. In their research, a model of content-related, structural and socialization factors that would affect users’ attitudes toward advertising on SNS was tested and the conclusion posited, “When SNA delivers content that is consistent with the motivations originally expressed in media uses and gratification theory, consumers were more likely to ascribe positive attitudes toward advertising conveyed to them through an SNS medium” (p. 269). Based on the past research, the current study proposed that the users’ Facebook experience is positively related with their attitude toward ads. And as theory suggested, another two individual factors – gender and individual’s online shopping time -- would also contribute to users’ attitude toward Facebook ads. Therefore, the current study proposed the
research hypothesis regarding users’ Facebook experience and their attitude toward ads as:
24 CHAPTER III
METHODOLOGY
To examine Facebook users’ experience and their attitude toward ads (Aad) on it, this study employed survey research. This section discusses how survey participants were sampled, the specific procedures involved in the survey, how measures were identified, and which statistical methods were used.
Sampling
The study recruited students at Oklahoma State University as participants for a paper-pencil survey. Justification for selecting this target group is based on the fact that students’ involvement with Facebook has increased considerably since 2004. Many college students interact on social networking sites such as Facebook as a daily activity and they have become heavy users of SNS (Ellison, Stainfield, & Lampe, 2007).
Participants were selected by applying nonprobability sampling. The researcher reached potential participants in two ways: (1) the researcher entered selected classes and sought cooperation from the students; (2) the researcher randomly sought interested participants
25
in the university library. As such the researcher had access to a student group covering a varied range of school status, ages and major areas.
Before handing out the questionnaire, students were screened by being asked if they are Facebook users. Only Facebook users were invited to participate. Students were not required to participate in the study and could opt out of it at any time. All paper surveys were completely anonymous.
A consent form was attached at the beginning of the questionnaire to allow the participants to make an informed and voluntary decision whether or not to participate in the research. Subsequently a series of Likert-type statements were posited on three topics:
1. Users’ experiences with Facebook 2. Users’ attitude toward Ads on Facebook 3. Demographic information
The survey took about 10 minutes to complete. Next the specific measures are explained.
Measures
As mentioned, two dimensions were measured: users’ experiences with Facebook and users’ attitude toward ads on Facebook. Demographic information also was
collected.
Users experience with Facebook
This research used Calder et al. (2009)’s measurement of users’ online experience in their study of online experience and advertising reaction. Their study measured eight
26
online experiences using 38 items. In this study, one item was deleted from Community experience, namely, “I am as interested in input from other users as I am in the regular content on this site.” This was removed because the regular content on Facebook is generated by users. The items used to measure the eight Experience dimensions in this study are displayed in Table 3.1.
27 Table 3.1
Facebook Experience Measures
Experience Item
Stimulation and Inspiration It inspires me in my own life.
Facebook makes me think of things in new ways.
Facebook stimulates my thinking about lots of different topics. Facebook makes me a more interesting person.
Some stories I read from Facebook touch me deep down.
Social Facilitation I bring up things I have seen Facebook in conversations with many other people. Facebook often gives me something to talk about
I use things from Facebook in discussions or arguments with people I know.
Temporal Logging on Facebook is part of my routine.
This is one of the sites I always go to anytime I am surfing the web. I use it as a big part of getting my news for the day.
It helps me to get my day started in the morning. Self-Esteem and Civic
Mindedness Using Facebook makes me feel like a better citizen. Using this site makes a difference in my life. I use Facebook to reflect my values. It makes me more a part of my community. I'm a better person for using Facebook Intrinsic Enjoyment It's a treat for me.
Going to this site improves my mood, makes me happier. I like to kick back and wind down with it.
I like to go to this site when I am eating or taking a break.
While I am on Facebook, I don't think about other websites I might go to. Utilitarian Facebook helps me make good purchase decisions.
You learn how to improve yourself from using Facebook.
Facebook provides information that helps me make important decisions. Facebook helps me better manage my money.
I give advice and tips to people I know based on things I've read through Facebook. Participation and Socializing I do quite a bit of socializing on this site.
I contribute to the conversation on this site.
I often feel guilty about the amount of time I spend on this site socializing.
I should probably cut back on the amount of time I spend on this site socializing.
Community A big reason I like Facebook is what I get from other users.
Facebook does a good job of getting its visitors to contribute or provide feedback. I'd like to meet my friends who regularly visit Facebook
I've gotten interested in things I otherwise wouldn't have because of others on Facebook.
Overall, the visitors to Facebook are pretty knowledgeable about the topics it covers so you can learn from them.
28 Facebook users’ attitude toward the Ads
This study used the following steps to form measures evaluating users’ reaction toward ads. First, a six items scale was borrowed and adapted from Soares et al.’s (2012) research on people’s response to marketing efforts on Social Networks Sites (SNS). They derived the items from exploratory interviews and adapted others from Muehling (1987). The six items were:
1. I never really pay attention to it. 2. I fully ignore it.
3. It makes me less willing to use Facebook. 4. It is very boring.
5. It is necessary for funding Facebook. 6. It adds value to my use of Facebook.
This study added two additional measures to further investigate users’ reaction and contribution to spreading advertising messages on Facebook. These are “I would like to click on the ads and check out information” and “I would like to share the ads’ links to my Facebook friends.”
Statistical Analysis
To measure Facebook users’ experience and their attitude toward ads, the
questionnaire used the above-mentioned statements, which were used in previous studies (Calder et al. 2009; Soares et.al 2012; Muehling, 1987), and asked participants’
agreements with them based on a 7-point Likert-type Scale (1- 7 scale: where 1=Strong disagree and 7= Strongly agree). The scores were reverse-coded when necessary to make
29
the measurement consistent regarding to the level that people positively/negatively engage with Facebook and react to ads on it.
After the data were collected, the researcher screened the information for miscoded and suspicious-looking data entries. Then data were entered to SPSS 20.0 software and a report of descriptive statistics from the data collected was produced. Next, data were screened for missing responses and the assumptions of factor analysis. First, all variables had missing cases representing less than 5% of the data, so Listwise deletion was used (Mertler & Vannatta, 2005, p.36). Second, all variables with outliers were recorded, and the Z-scores were generated. For the variables that had outliers exceeding the benchmark ± 3.0 (Garson, 2008), a new variable was created by winsorizing these outliers
(Tabachnick & Fidell, 1996, p.69).
Subsequently factor analysis was conducted to identify dimensions underlying Facebook users’ experiences and their attitude toward ads. For initial extraction, Principle Components was used and components with eigenvalues greater than one were obtained. Then an alternative scree plot test (Cattell, 1966) was used to retain the factors “with eigenvalues in the sharp descent part of the plot” (Green and Salkind, 2005, p.317). Lastly the factor loading was checked and factors that had components with loadings higher than .50 were retained.
Next, the Principle Components was used as an extraction technique to determine the meaningful factors, and varimax rotation was used to maximize high correlations and minimize low ones. Four criteria were used for factor extraction: (1) factors must have an eigenvalue of 1.0 or greater (Kaiser, 1960; Guttman, 1956); (2) factors had to appear on a
30
scree plot before it leveled off (Cattell, 1966); (3) variables had to have loadings of at least .50 (Schwab, 2007; Horvath, 2004) on one variable and less than .40 on all other variables in this exploratory factor analysis (American Psychiatric Association, 1994; Horvath, 2004; Schwab, 2007); and (4) at least two variables must load at .50 or higher on each factor (Schwab, 2007).
After that, a reliability analysis was conducted on each of the Facebook experience and Aad factors since some researchers suggested using Cronbach’s alpha to assess the internal consistency of the factors (Pett, Lackey and Sullivan, 2003; Schwab, 2007). Factors with Cronbach’s alpha value above Garson (2009)’s standard of .60 for
exploratory analysis were collapsed into new variables and were used in the subsequent regression analysis.
To answer the research question that if a statistically significant difference exists between the male and female Facebook users’ experience, the experience variables were separated into two groups according to gender and an independent t-test was conducted. Alpha was set at .05, which means if the p-value (probability value) was below .05 then it was statistically significant.
Subsequently regression tests were conducted to investigate the relationship
between Facebook experience and users’ Aad. First, variables were screened for linearity and multicollinearity. All correlations between DV and IV’s were checked and two standards were used for checking multicollinearity: 1) The correlations between the IVs is of .70 or higher (Tabachnick and Fidell, p. 86); 2) The Variance Inflation Factor (VIF) values are 4.0 or higher. The influential outliers were also screened by using Cook’s
31
distance and Standardized Studentized Deleted Residuals. The data generated a maximum for Cook’s Distance of .062, well below the standard of 1.0 for problems. Similarly, the minimum and maximum Studentized Deleted Residuals were -1.59 and 3.25, below the standard of ± 3.3 for problems. Thus these statistics indicated no problems with outliers in the solution and indicated the model fits the data well.
Next a sequential regression test was used to test the hypotheses. The individual factor, gender, was entered into the model first followed by online shopping time, because demographic variables occur prior to other variables and are unlikely to be affected by other transitory variables (Cohen & Cohen, 2002). They were entered first also to control for their influence. The order of the Facebook experience factors that were entered into the regression model was determined by consulting the correlation matrix. The Facebook experience variable with the highest zero-order correlations would have the most effect on the reaction toward ads variable, hence it was entered first and all others were entered in descending order according to their zero-order correlations. The sequential regression allowed each Facebook experience variable’s full contribution to the reaction toward ads variables to be explored when they were correlated (Cohen & Cohen, 2002).
32 CHAPTER IV FINDINGS Characteristics of Respondents Table 4.1 Sample Demographics (N=367) Demographics N % N %
Gender Online shopping time
Female 201 55.5
Male 166 45.5 Never shop on line 18 4.92
Seldom shop online 65 17.76
Age Once every several month 70 19.13
18-24 253 78.57 Once a month 55 15.03 23-25 44 13.65 2-3 times a month 68 18.58 25-40 25 7.73 Once a week 43 11.75 2-3 times a week 32 8.74 Time on Facebook Everyday 15 4.1 No time at all 2 0.54 < 10 min 36 9.84 10-30 min 76 20.77 30min --1hr 99 27.05 1hr -- 2 hr 75 20.49 2 hr -- 3hr 43 11.75 > 3 hr 35 9.56
33
Of the 367 subjects responding to the survey question, 366 reported gender. Of these 45.5% (n=366) were males and 55.5 % (n=366) were females. The age range of the 322 respondents who reported their age was 18 to 40 years. The average age of respondents was 21.52 years, with 78.57 % at 18 to 24 years; 13.65% at 23 to 25 years and 7.73% above 25.
In addition to collecting the demographic data, respondents were asked two more questions regarding to their individual traits. One was, “On a typical day, about how much time do you spend on Facebook?” This question was used to access more accurately their ability to provide meaningful information regarding their Facebook usage. For the 366 respondents who answered this question the average time spent was between the levels “more than 30 minutes, up to 1 hour” and “more than 1 hr, up to 2 hrs”. Only 9.8% indicated they spend less than 10 minutes a day. The research retained the less informed respondents for two reasons as stated in the previous research on SNS advertising (Taylor et al., 2011). First, the samples featuring varying levels of usage and knowledge are statistically desirable to get findings that are more generalizable to the population the sample represents. Second, less well-informed consumers’ attitudes still matter to advertisers since SNS providers should expect less frequent users.
Another question was “How often do you shop online?” This question was to see how the respondents’ online shopping experience would influence their reaction toward ads. For the 366 respondents who answered this question on a scale where 0 represented “never shop online” and 7 represented “shopping online every day”, the mean response was 3.16, pointing at somewhere between “once a month” and “two to three times a month”.
34 Factor Analysis of Facebook experience
This research aimed to explore the relationship between users’ Facebook experience and their attitude toward ads. As mentioned, the independent variable, Facebook
experience, was measured using 37 items adopted from the previous research on Internet experience (Calder et al., 2009). Research question 1 asked if users’ Facebook experience could be collapsed into fewer underlying factors and what they would be. Hence a factor analysis was conducted to analyze intercorrelations among the 37 measurement items for users’ Facebook experience.
35
Table 4.2 Factor analysis (principal components analysis and varimax rotation) of measures of Facebook experience, N=367
Experience Item M SD
Standard loading Enpowerment
I give advice and tips to people I know
based on things I've read through Facebook 2.04 1.10 0.778 (Cronbach’s α = .90)
Using Facebook makes me feel like a
better citizen 2.39 1.26 0.752
I'm a better person for using Facebook 2.49 1.25 0.747 M = 2.61 SD = .86 Facebook provides information that helps
me make important decisions 2.68 1.37 0.725
Facebook helps me better manage my
money 2.64 1.37 0.724
I learn how to improve myself from using
Facebook. 2.52 1.32 0.702
Facebook helps me make good purchase
decisions 2.78 1.44 0.681
A big reason I like Facebook is what I get
from other users 2.77 1.40 0.668
Using Facebook inspires me in my own
life 3.35 1.51 0.523
Community-self-worth
I've gotten interested in things I otherwise wouldn't have because of others on
Facebook 3.28 1.59 0.781
(Cronbach’s α = .80)
Overall, the visitors to Facebook are pretty knowledgeable about the topics it covers
so you can learn from them 3.78 1.69 0.75
M = 3.63 SD =1.16 I'd like to meet my friends who regularly
visit Facebook 4.01 1.54 0.601
Facebook makes me feel more a part of my
community. 3.83 1.70 0.574
Using Facebook is a treat for me. 3.60 1.55 0.571 I use Facebook to reflect my values. 3.26 1.69 0.532 Social participation I do quite a bit of socializing on Facebook. 3.51 0.912 (Cronbach’s α = .89)
36
As shown in Table 4.2, the principle components factor analysis with varimax rotation of Facebook experience items found three factors. The first factor (Cronbach’s α = .90) included 9 items and a closer look at them found that these items shared in
common the experience of being empowered by using Facebook. Users get useful information to facilitate daily life or acquire the ability to give advice. They improve lives by feeling better about themselves while using Facebook. This factor would be called empowerment in the following analysis. The empowerment factor accounted for the most variance, 28.25%, among the users’ Facebook experiences.
The second factor would be called community-self-worth factor, since items in this category pertained to the enjoyment the users acquire from being in a Facebook
community. With Facebook friends, users are stimulated by learning new things from a larger community, they enjoy revealing themselves to their friends, and they feel happy simply by being accompanied with friends. This factor explained 17.75% of the total Facebook experience variance.
The third factor includes two participation items. Users socialize and contribute to the conversation on Facebook and it therefore was called social participation factor. This factor accounted for 12.35% of the total variance. Together these three factors explained 58.35% of the variance among users’ Facebook experiences.
Some researchers such as Pett, Lackey and Sullivan (2003) and Schwab (2007) suggest using Cronbach’s alpha to access the internal consistency of the factors. So the three factors were evaluated using reliability analysis. The Cronbach’s alpha for factor 1 was a very high .90, well above the .70 standard (Garson, 2009)for exploratory factor
37
analysis, indicating the highest correlations among variables. Factor 2 had an acceptable alpha at .80 and the alpha for Factor 3 was above the standard at .89. All factors meet the .60 criteria for Cronbach’s alpha for exploratory factor analysis.
Subsequently, each of the three Facebook experience factors was collapsed into a single variable, to correlate with Facebook users’ attitude toward ads. On a Likert scale of 1 to 7 where 7 represented the most positive value, the average responses ranged from 2 to 4, which indicated an overall negative attitude from the Facebook users toward the statements of the possible experiences. Among the three factors, Social participation had the highest mean score (M=3.72, SD = 1.77), followed by Community-self-worth
(M=3.63, SD =1.16). Empowerment, which had the highest explained variance, had the lowest mean score (M=2.61, SD = .86).
Factor Analysis with Facebook users’ Attitude toward Ads (Aad)
In this study, the questions asked about users’ Aad, which were designed with two dimensions. The first dimension assumed users would develop different Aad toward the purely sponsored ads versus ads forwarded by their friends. The second dimension addressed the different levels of the possible engagement with the Facebook ads – users may start engaging with ads by paying attention, followed by clicking through and then take a step further to share the ads to their friends. However, no existent evidence showed how many Aad factors were formed by these two dimensions. Therefore, factor analysis was conducted on the 16 Aad items to determine what the Facebook users’ Aad consisted of.
38
The initial extraction indicated 5 factors that have eigenvalues of 1.0 or more. The varimax rotation was then used and the confounded variables and the variables with loading below .50 standard (Tabachnik &Fidell,1996; Schwab, 2007) were removed. The rotated solution with five factors explained 72.15 % of the variation in the data, which is higher than Schwab’s standard of .60 or more.
39
Table 4.3 Factor Analysis (principal components analysis and varimax rotation) of Measures of Attitude toward Ads, N=367
Aad Item M SD Standard
loading Intention to click and
share
(Cronbach’s α = .831)
M = 2.08 SD = .97
I would forward the friend recommended
ads to my other friends 2.05 1.19 0.84 I often click through Friends’
recommended ads and check out
information 2.28 1.26 0.79
Iwould forward the ads to my friends 1.81 1.1 0.75 I often click through the ads and check
out information 2.17 1.23 0.69
Attention and interest (Cronbach’s α = .76)
M = 3.43 SD = 1.37
Ads add value to my use of Facebook 3.67 1.87 0.83 I always pay attention to ads on
Facebook. 3.56 2.02 0.73
Friends’ recommendation of ads adds
value to my use of Facebook 3.31 1.65 0.70 Ads on Facebook are very boring 3.16 1.61 0.66 Perceived value for
(Cronbach’s α = .71) M = 3.75 SD = 1.50
Friends’ recommended ads are necessary
for funding Facebook. 3.51 1.61 0.87
Ads are necessary for funding Facebook.
3.99 1.77 0.82 Avoidance of ads
(Cronbach’s α = .67) M = 2.76 SD = 1.42
I fully ignore ads on Facebook. 2.42 1.57 0.85 Ads make me less willing to use
Facebook. 3.10 1.70 0.75
Avoidance of Friend forwarded ads
(Cronbach’s α = .74) M = 2.78 SD = 1.50
I fully ignore friends’ recommended ads 2.57 1.65 0.88 Friends’ recommended ads make me less
40
As shown in Table 2, principle components factor analysis with varimax rotation of Attitude toward ads items generated five factors. The first factor (Cronbach’s α = .83) included 4 items relating to the users’ intention to click through and share the ads to their friends. This factor involved the deeper engagement with the ads on Facebook, which accounted for the most variance, 29.51%, of the Aad measurement.
The second factor included four items pertaining to the users’ willingness to pay attention to ads, their evaluation of the interest of the ads, and the value that Facebook ads bring to their general Facebook experience. In this regard, whether the ads are forwarded from their friends did not make a difference. This factor would be called Attention and Interest in the following analysis and this factor explained 18.8% of the Aad variance.
The third factor included two items relating to the users’ perception about the ads’ value for the Facebook company. Again users perceived the pure ads and the friend forwarded ads in the same way on this issue. This factor accounted for 9.97% of the total variance.
The fourth and fifth factors related to the users’ intention to avoid the ads. To avoid the ads, they would either ignore the ads or simply log on to Facebook less often. On this issue, the source of the ads made a difference in the users’ attitude. Factors four and five addressed the pure ads and the friend recommended ads respectively, and they accounted for 7.60% and 6.25% of the total variance.
Next each Aad factor was collapsed into a single variable, to correlate with users’ Facebook experience variables. Overall, subjects (n=367) had a negative attitude and
41
passive reaction toward ads on Facebook. The average score of each variable ranged from 2 to 3 on a 7-point Likert scale. Of these, the perceived value of the ads for Facebook had the highest mean (M = 3.75, SD =1.5) while the intention to click and share the ads had the lowest mean (M = 2.08, SD = .97).
T-test
Hypothesis 1 predicted users’ Facebook experiences differ by gender. Independent t-tests were conducted to compare means of two unrelated groups on three Facebook experience factors—Empowerment, Community-self-worth and Social Participation.
Table 4.4.1 T-test Comparing Gender by Facebook Experience—Empowerment
n M SD t η \ η 2
Males 166 2.67 .92 1.00 .053 .003
Females 198 2.58 .79
* p < .05 **p <.01
Table 4.4.1 shows that t (362) = 1.00, p=.17, so males (M =2.67, SD = .92) were not statistically more empowered by Facebook compared Females (M =2.58, SD = .79).
Table 4.4.2 T-test Comparing Gender by Facebook Experience—Community-self-worth
n M SD t η \ η 2 Males 167 3.64 1.19 .29 .015 .000 Femal es 197 3.61 1.31 * p < .05 **p <.01