Future Network & MobileSummit 2012 Conference Proceedings Paul Cunningham and Miriam Cunningham (Eds)
IIMC International Information Management Corporation, 2012 ISBN: 978-1-905824-29-8
Poster Paper
Managing Customer Experience through
Service Quality Monitoring
Anderson MORAIS1, Ana CAVALLI1, Hai Anh TRAN2, Abdelhamid MELLOUK2, Brice AUGUSTIN2, Said HOCEINI2, Antonio CUADRA-SÁNCHEZ3, Kjell BRUNNSTRÖM4,
Andreas AURELIUS4
1
Institut Telecom/Telecom SudParis, 9 rue Charles Fourier, Evry, 91000, France Tel: +33 1 60764427, Email: {anderson.morais,ana.cavalli}@it-sudparis.eu 2
University of Paris Est Creteil, 122 Rue Paul Armangot, 94400, Vitry sur Seine, France Email: mellouk@u-pec.fr
3
Indra, Parque Tecnologico de Boecillo, Valladolid, 47151, Spain Tel: +34 983 100818, Email: acuadra@indra.es
4
Acreo AB, Electrum 236, Kista, 16440, Sweden
Tel: +46-8-6327732, Email:{kjell.brunnstrom,andreas.aurelius}@acreo.se Abstract: The evolution from traditional telecommunication networks towards NGN (Next Generation Networks) is enabling service providers to deploy a wide range of multimedia services such as Internet Protocol Television (IPTV), Video on Demand (VoD), and multiplayer games services, all on the same underlying IP network. However, managing the satisfaction level of customers has not been an easy task for network operators and service providers. In this paper, we analyze existing Quality of Experience (QoE) measurement approaches including Customer Experience Management (CEM) and Service Quality Management (SQM) schemes, which have been defined by Telecom Forums and standardizations bodies. A monitoring level inside Customer Experience Management System (CEMS) architecture is proposed in the context of IPNQSIS project to assess and quantify the user experience level, and accordingly adapt the network traffic.
Keywords: Customer Experience Management, Service Quality Management, Quality of Experience.
1. Introduction
The importance of understanding consumer behavior has never been more important to network operators and service providers. Service providers are more interested in objectively measuring that part of an offered service which they control, for instance, network bandwidth or channel capacity. However, consumer perception of service quality may embrace additional quality parameters, such as that based on the level of jitter perceived by the end-user in a voice call, or the time it takes for the user to change channel on a IPTV system, i.e., the zap time.
Customer experience [1] is the accumulation of all experiences a customer has with a service provider during his/her relationship with that provider which results from the direct interaction with the offered services. Traditionally, Customer Relationship Management (CRM) has been in charge of managing the company’s interactions with the clients and customers. Nevertheless, the methodology employed by CRM mainly focuses on sales activities, marketing, and business procedures, not taking into account the customer needs on the service quality. As a result, there is a large gap between the company approach and customer expectations and desires for the quality of service. Customer Experience
Management (CEM) provides a fully integrated framework that measures not only Quality of Service (QoS) metrics but also the level of consumer satisfaction concerning services delivered by telecom companies. CEM has the potential to overcome the limitations of CRM to deal with common clients’ technical problems and performance issues of services.
Service Quality Management (SQM) is the process of monitoring and maintaining an acceptable level of quality for end-to-end (e2e) services delivered to an individual or a group of customers. The focus of IPNQSIS CELTIC project [3] is to develop continuous monitoring systems to study the behavior of Quality of Experience (QoE) through the analysis of network and service performance and their impact on end-customer experience.
An important novelty of IPNQSIS is that QoE is taken up as the main driver for building a complete CEM System (CEMS). Within the CEMS architecture [2] developed in the context of IPNQSIS, three main levels are required to dynamically manage the quality of services and consequently the level of customer experience:
• Data Acquisition Level is responsible for gathering traffic information from different datasources such as active and passive probes, or deep packet inspectors.
• Monitoring Level is designed to process the information collected from datasources. Thus, based on a fine-grained analysis of the network data, Key Performance Indicator (KPI) and Key Quality Indicator (KQI) metrics are calculated, and then correlated in order to supervise the QoS parameters and the corresponding QoE level for a service.
• Control Level handles QoE measures provided by the Monitoring Level, and proactively executes corrective actions in order to improve such QoS metrics and consequently recover the QoE level, which represents the customer satisfaction level. In this paper, we describe service quality monitoring architectures which allow service providers to assess the customer experience by measuring KPI information from network traffic in order to assure that performance requirements of streaming services are meet from the point of view of end-users. Section 2 introduces CEM and SQM approaches employed for multimedia platforms as well as related standards. In Section 3, we outline KPI and KQI metrics for QoE measurement. Section 4 analyses the effect of impairment factors on a video codec for QoS/QoE assurance. Finally, Section 5 concludes the paper.
2. Customer Experience Management and Service Quality Management
2.1 – Customer Experience Management (CEM)
CEM approach is designed to focus on procedures and a methodology to satisfy the service quality needs of each end-user. Telecom operators are focusing on solutions to maximize the customer experience on audio and video services. CEM solutions essentially provide a monitoring architecture and traffic analysis engines to manage and optimize the e2e customer experience process. In 2009, TM Forum launched a working group called Managing Customer Experience (MCE) that constituted the major initiative to establish the links between Quality of Service (SQM) and Customer Experience (CEM). The MCE program released three reference deliverables:
1. TR 148 [4] examines the factors that influence customer experience and also a number of business scenarios for the delivery of digital media services, such as IPTV, Mobile TV, Enterprise IPVPN, and Blackberry, through a chain of co-operating providers; 2. TR 149 [5] describes the customer experience/SQM framework that has been designed
to meet the need for assuring e2e quality of customer experience when services are delivered using a chain of co-operating providers. It aims to support the business scenarios and requirements described in TR 148;
3. TR 152 [6] captures at an executive level the main results of the Managing Customer Experience Focus Area Catalyst presented at Management World Orlando 2008.
ITU-T has one Study Group [12], “SG12 – Performance, QoS and QoE”, which is the main responsible for ITU-T Recommendations related to QoE [1]: 1) Perceived Quality of Speech (Recommendations P.862, P.563, P.564); 2) Quality-planning model for telephony services (Recommendation G.107) and video-telephony applications (G.1070); 3) QoE requirements and monitoring for IPTV services (Recs. G.1080, G.1081, G.1082).
CEM uses as main inputs the objective QoS parameters that contribute to QoE, i.e. NQoS (network indicators) and AQoS (service and application indicators). Combining both NQoS and AQoS, we can calculate the effect of both encoding and transport of multimedia on the QoE. Nonetheless, QoE is a subjective measure, so subjective assessment is the only reliable method. This means that CEM must also use customers’ feedback. On the other hand, subjective testing is expensive, time consuming, and reference content is sometimes missing. Therefore, the CEMS solution should use the minimum available subjective tests on reference material by building prediction models for real-time estimation.
The first steps of the CEMS architecture developed in IPNQSIS context focus on the construction of accurate as well as practical QoE prediction models. In order to optimize the provisioning of mobile streaming services as a first step we set out to measure and predict the user’s QoE of multimedia streaming. This enables us to better understand how QoS parameters affect service quality, as it is actually perceived by the end-user. Over the last years, this goal has been pursued by means of subjective tests and through the analysis of the user’s feedback. Existing statistical techniques have led to poor accuracy (order of 70%) and inability to evolve prediction models with the system’s dynamics. The CEMS solution [2] proposes a novel approach for building accurate and adaptive QoE prediction models using Machine Learning classification algorithms, trained on subjective test data. These models can be used for real-time prediction of QoE and can be efficiently integrated into online learning systems that can adapt the models according to changes in the environment. Providing high accuracy of above 90%, the classification algorithms become an indispensable component of a mobile multimedia QoE management system.
2.2 – Service Quality Management (SQM)
TM Forum TR 148 defines Service Quality Management (SQM) as the set of features displayed by an operation support system (OSS) that allow management of the quality of the different products and services offered by an enterprise. On the other hand, QoS is the collective effect of service performances, which determines the degree of satisfaction of a user of the service (ITU-T Rec. E.800 [7]). Therefore, the term quality of service is used in this document as a quality figure rather than referring to the ability to reserve resources.
SQM refers to the level of satisfaction a customer perceives when using a given service. To proactively manage this, the e2e components that make up the service must be monitored and maintained. Typically, e2e service quality management requires a powerful data aggregation engine and a tool for e2e mapping of services. This way SQM systems make use of collected information (regarding user perceived QoS and the performance of the provision chain) in order to enhance the guarantee in the quality of the offered services. Customer data is collected from the network in order to formulate the characterization of services usage. By this way, these activities fulfill the generation of key performance and quality indicators (KPI/KQI), allow threshold management, SLAs surveillance, real-time monitoring, and are the more appropriate approach to CEM. The QoS perceived by the customer depends on: 1) the components that set up the service; 2) Business Processes related to the service; 3) the resources on which the processes are supported; 4) the performance of the underlying network. With the purpose of quantifying the perceived QoS, we must know the KQI and KPI metrics for the network and services, and fulfill a methodology that correlates any factor. This methodology has been clearly defined in terms
of four basic stages shown in the Figure 1.
Figure 1: Methodology for supporting Service Quality Management (SQM).
3. Quality of Experience Measurement
To measure the QoS of a network, many network-level metrics have been proposed such as packet delay, packet loss rate, packet reordering, and jitter. These metrics are often referred as Key Performance Indicators (KPI). Similarly, the development of the concept of QoE requires the definition of new kinds of metrics called Key Quality Indicators (KQI). These new metrics can be defined from scratch or be a composition of standard, well-known KPI. In the latter case, there is a need for methods to correlate KPI with KQI, i.e. map QoS parameters into a measure of the level of satisfaction of a user. The QoE notion refers to the perception of the user about the quality of a particular service or network. It is indicated in human feelings like “excellent”, “good”, “average”, or “poor”.
Recently, in order to redirect the focus towards the end-user and quantify the subjective experience gained from using a service, the notion of QoE has emerged, describing quality as perceived by the human user. Many approaches have been proposed in order to measure, evaluate, and improve QoE in networks. With regard to QoE, we classify three approaches:
• Usability Metric: QoE is how a user perceives the usability of a service when it is in use, i.e., how satisfied he/she is with a service in terms of usability, accessibility, retainability, and integrity.
• Hedonistic Concept: QoE describes the degree of delight of the user for a service, which is influenced by content, network, device, application, user expectations and goals, and context of use.
• Buzzword Extension: QoE has been defined as an extension of traditional KPIs used in the QoS concepts in the sense that QoE provides information regarding the delivered services from the point of view of an end-user.
The CEMS of IPNQSIS project applies a Buzzword Extension method in which QoS of video and audio streams are monitored in real-time, then QoE measurement is objectively inferred based on a suitable QoE model, and encoding and transmission parameters (e.g. codec bitrate, error correcting codes, traffic shaping) are adaptively modified to optimize the service quality in real-time. The QoE model is computationally lightweight, and it is
based on a No Reference (NR) model [8], i.e., the degraded stream analyzed on receipt for quality estimation is not compared to the original signal since it is not available.
3.1 – KQI: Usability Metric
KQI measurement has become very meaningful for network operators with the development of new multimedia services. Measuring and monitoring KQI can be used to analyze problematic cases and improve the performance of the network. In [9], the authors propose a method for QoS and QoE management in UMTS cellular systems that consists of three layers: Network Elements, Element Management Layer, and Network Management Layer. In the first layer, the network element is used to collect performance measures, usage data, and generate alarms. The Element Management Layer is responsible for aggregating and transferring collected QoE and QoS performance measurements and generated alarms/events. The Network management Layer is used to collect and process performance, fault, and usage data. This layer provides the following functions: a) SQM: this is responsible for the overall quality of a service as it interacts with other functional areas to access monitored information; b) Customer QoS Management (CQM): this includes monitoring, managing, and reporting the QoS customers.
The authors constructed a QoE monitoring framework with two practical approaches for measuring QoE in mobile networks: 1) Service level approach using statistical samples, and 2) Network management system approach using QoS parameters. Regarding the first approach, the main idea is performing statistical sampling, and then take the most accurate measurements according to the samples. Most of the measured performance indicators are at application level, so providing a real end-user perspective. The process involves: a) Determining the weighting of key service applications; b) Identifying and weighting QoE metrics; c) Devising a proper statistical sample (geographic areas, traffic mix, and time of day) and collecting QoE metrics: d) Utilizing mobile agents in handsets to make the results more accurate; e) Giving an overall QoE score (index) from KPI values for each separate service. In the second approach, hard QoS metrics from several elements of the network are mapped onto user-perceptible QoE performance goals. The process includes: a) Identifying the relationship between QoS KPIs and their effect on QoE; b) Measuring QoS KPIs in the network, c) Rating QoE through measured QoS KPIs using some mapping metrics.
3.2 – KQI: Hedonistic Concept
The focus is primarily on attributes of the system with special attention paid to user’s attributes or the context in which network usage occurs. The work [10] presents an approach for predicting judgment models using Hidden Markov Models (HMM). The user’s opinion is considered as a continuous process evolving over time.
HMM reproduces a sequence of events as a sequence of states, in which each state emits certain symbols with some probability. In fact, the transitions between states are probabilistic. The model consists of a set of state symbols, a set of emission symbols, the probabilities for the initial state, the state transition matrix, and the emission matrix. The transition matrix contains the probabilities for transitions from each state to each other state or itself. The emission matrix contains the probabilities for each emission symbol to occur at each state. While the sequence of emissions can be observed, the state sequence is hidden. However, given an emission sequence, standard algorithms defined for the HMM allow to calculate the probability of each state at each point in the sequence. The probability for the model to be in a state is dependent on the previous state and the emissions observed at the current state. Authors gave a model where the user judgment can either be “bad” or “good”. Each judgment has a probabilistic relation to the current events in the dialog.
Systems (SDSs) using HMMs. The approach allows predicting user’s judgments at each step of the dialog. For predicting the rating distribution of users, the approach takes into account differences between user’s judgment and behaviors.
3.3 – KQI: Buzzword Extension
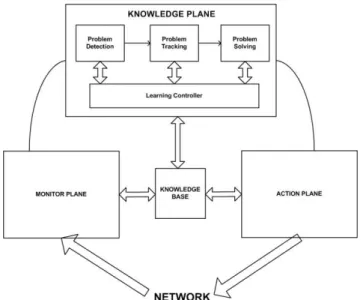
Recently, multimedia services are being accessed via fixed and mobile networks. These services are typically much more sensitive to packet loss, delay variation, and congestion than traditional services. In particular, multimedia data is often time critical and, as a result, network issues are not well tolerated by customers, which can significantly deteriorate the user’s QoE. Therefore, optimization of KQIs is more and more necessary. In [11], the authors propose an autonomic architecture for optimizing QoE in multimedia access networks. In this approach, the Knowledge Plane is an autonomic layer that optimizes the QoE in multimedia access networks from the service originator to the user.
The focus of this approach is the development of an autonomic architecture to maximize KQI of all services in multimedia access networks. This architecture spans the complete network from service originator to the end-user. Its functionality is defined through three separate layers: the Monitor Plane (MPlane), the Knowledge Plane (KPlane), and the Action Plane (APlane). Figure 2 illustrates the architecture components.
Figure 2: A generic and autonomic architecture.
MPlane is responsible for a complete and detailed view of the network. A view is obtained by establishing some monitor probes at border points (e.g. access nodes, video servers) to watch over parameters such as packet loss and router queue size. With regard to APlane, it is used to execute KQI optimizing actions in the network. In fact, authors have chosen two types of KQI optimizing actions: 1) adding error control such as FEC; and 2) switching to a different video bit rate. All information about the network is stored in a knowledge base. The most important component is KPlane that makes the link between MPlane and APlane. Here, the autonomic design goal is met when KPlane determines the right KQI optimizing actions to take without any human interference. KPlane needs a learning controller to self-adapt its behavior if needed. Authors have designed two components, also referred as reasoners, for behavior reasoning: 1) Analytical reasoner: it uses a number of equations to determine in two phases the amount of FEC packets required and the video bit rate selected for each channel; and 2) Neural network based reasoner: this reasoner is based on the use of a neural network, a black box able to solve complex problems. Authors constructed a feed-forward neural network consisting of one hidden layer with five hidden neurons, and used Levenberg–Marquardt algorithm to train the
network. The neural network tries to map a set of monitored values to the configuration of two possible QoE optimizing actions.
4. Quality of Experience Assurance for Video Services
Transport of video packets over IP network is the basis of most currently available multimedia services, such as IPTV, videoconferencing, or video streaming. In all of these cases, it is especially important to monitor the QoE offered to the end-user because typical transport architecture using Real-time Transport Protocol (RTP), User Datagram Protocol (UDP), or IP does not guarantee service provisioning with specific QoS. Moreover, some other QoE metrics are not directly related with QoS such as channel change delay.
In this section, the scenario considered for analysis is the transmission of H.264 Advanced Video Coding (AVC) video over MPEG-2 Transport Stream (MPEG2-TS). This is a common situation for DVB/ATSC television, IPTV, or HTTP adaptive streaming. H.264 has a significant toolset advantage over MPEG-2 concerning picture types and number of reference pictures available to construct predicted pictures or macro-blocks. MPEG-2 always has to select the nearest reference picture (I or P frame) for prediction while H.264 can use I, P, or B Frames and can use up to 6 reference pictures for the prediction process, this method is known as Hierarchical Group of Pictures (GOP).
4.1 – Effect of Packet Loss in H.264 AVC
Packet loss is the most common impairment factor suffered by IP video distribution, and it produces macro-block errors as well as audio discontinuities among other effects.
Hierarchical GOP is a technique that dramatically reduces the required bit rate, but if the transmission causes errors in one frame then it is propagated to all frames that refer to it. If these frames, in turn, serve as reference for others, the impairment would be propagated even more along the reference chain. Therefore, when computing the degradation value of an image, it is necessary not only to take into account the error produced in the picture itself, but also the error propagated from reference frames. The GOP size has also influence on the resilience of IP video distribution for packet loss, since a larger GOP size used for bit rate improvement would produce more visual artifacts than a solution with a shorter GOP, i.e., more Instantaneous Decoding Refresh (IDR) frames are used.
When performing qualitative analysis for decoded video frames in which packets have been lost on IDR frames, the error becomes more noticeable in the following P-frames. This means the frame with highest Mean Square Error (MSE) is the one where the lost occurred, but it is not the frame where artifacts are most visible. The error may have higher visibility in next frames, even with lower MSE, because the error has been propagated by inter-frame predictions. This effect is due to error concealment: when part of the frame is lost, it is simply replaced by the most recent reference frame available. The visual effect of this replacement is a frame with a spatial discontinuity (part of the frame is the correct one and part is the previous), which is not very disturbing visually.
For the quantitative analysis by using MSE (aggregated along all the impaired frames) as method to measure the impact of error in the sequence. We can observe that error has higher impact in higher levels of the reference hierarchy, i.e., when an error occurs in an I-frame or in a P-I-frame, it generates higher MSE than when it occurs at a (reference) B frame, which in turn is higher than the error generated by losses in (no-reference) b frames. This is mainly due to the fact that errors in reference frames propagate, and therefore affect more frames. Error concealment also produces more visible results in I frames and P frames since the previous frame available is further back in time (four frames distant), than in the case of B frames (two frames away), or b frames (one frame away).
Effect Prediction Model as general as possible and meaningful for network operators. It should be adaptive on the position in the network since the concealment strategy has a great impact on the experience of errors and practically every implementation of decoder might use its own strategy. If access to the video player output, that is close to user, is available the actual decoded video may be used, otherwise this must also be estimated from the basis of the most likely concealment strategy. The CEMS solution goes beyond the current state of the art by developing and implementing new algorithms for proactive and reactive rate adaptation based on the compression and transmission parameters of the video codec in use.
5. Conclusions
This paper presents the main elements that allow proactively managing customer experience for multimedia services. The CEM and SQM architecture described in this document are essential to provide a comprehensive QoE management solution so that service providers can manage multimedia services from end-to-end, monitor associated network devices, and improve the QoE level of offered services as perceived by the users. The QoE assessment can be obtained from different KQI measurement models or derived from network objective metrics, also referenced as KPIs. Nonetheless, many issues have influence on user’s perception of a service quality in many different ways, for instance, the method applied for measuring and monitoring KQI metrics, the choice of the user satisfaction model, as well as the impact of user mobility and network resource utilization.
The CEMS proposed by IPNQSIS project intends to apply SQM/CEM elements but focusing on the QoE delivered to customers, which is mainly based on QoS measures (KPIs) that are calculated from traffic information collected by different datasources, such as passive and active probes, which continuously monitor IP traffic in different points of the network environment. Furthermore, CEMS approach aims to automatically adjust network performance guided by the QoE measurement and service quality estimations.
Acknowledgments
This work was supported by CELTIC European research initiative, a EUREKA Cluster, in the context of IPNQSIS project CP07-009.
References
[1] A. Palmer, “Customer experience management: a critical review of emerging ideas”, Journal of Services Marketing 24:3, pp. 196-208, 2010.
[2] IPNQSIS Project presentation, “Customer Experience Management System (CEMS)”, [Online], available at http://www.ipnqsis.org/index.php?title=Project_presentation.
[3] Call 7 Celtic Project, “IP Network Monitoring for QoS Intelligent Support (IPNQSIS)”, [Online], available at http://projects.celtic-initiative.org/ipnqsis/.
[4] TeleManagement Forum, “Technical Report: Managing the Quality of Customer Experience”, TR 148 v0.9, November 2009.
[5] TeleManagement Forum, “Technical Report Part 1: Holistic e2e Customer Experience Framework”, TR 149 v0.9, November 2009.
[6] TeleManagement Forum, “Technical Report: Managing Quality of Customer Experience”, TR 152 v0.9, November 2009.
[7] ITU-T, “Definitions of terms related to quality of service”, ITU-T Recommendation E.800, 2008.
[8] “PEVQ Advanced Perceptual Evaluation of Video Quality (PEVQ Whitepaper)”, Opticom, [Online], available at http://www.pevq.org.
[9] D. Soldani, M. Li, and R. Cuny, “QoS and QoE Management in UMTS Cellular Systems”, Wiley Ed., New York, 2006.
[10] K.-P. Engelbrecht, F. Gödde, F. Hartard, H. Ketabdar, and S. Möller, “Modeling User Satisfaction with Hidden Markov Models”, in Proc. of Sigdial, London, UK, pp. 170-177, 2009.
[11]S. Latré a, P. Simoens, B. De Vleeschauwer, W. V. de Meerssche, F. De Turck, B. Dhoedt, P. Demeester, S. V. den Bergheb, and E. G. de Lumley, “An autonomic architecture for optimizing QoE in multimedia access networks”, Computer Networks, Elsevier, vol 53, pp. 1578-1602, 2009.
[12] ITU-T Study Group 12, “ITU-T Study Group 12 - Performance, QoS and QoE”, [Online], available at http://www.itu.int/ITU-T/studygroups/com12/index.asp.